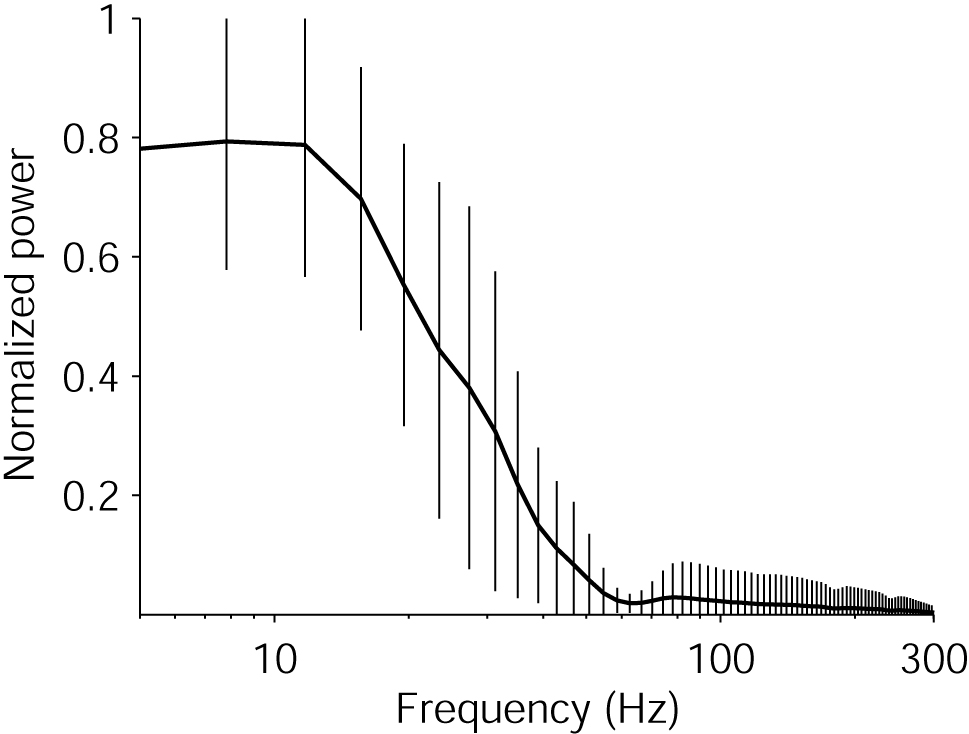
Power spectrum of the LFP signal averaged across pictures and across sites. The power spectrum was computed for each site by averaging across all repetitions and across pictures using the Welch method with a 256-point Hanning window and a 10 point overlap.(Press et al: Numerical Recipes in C, 2nd ed. Cambridge: Cambridge University Press; 1996). The power spectrum at each site was normalized by the maximum and then averaged across all sites. Error bars show 1 standard deviation across all sites (n=315 sites). The dip at 60 Hz is an artifact of the notch filtering applied to the signal.