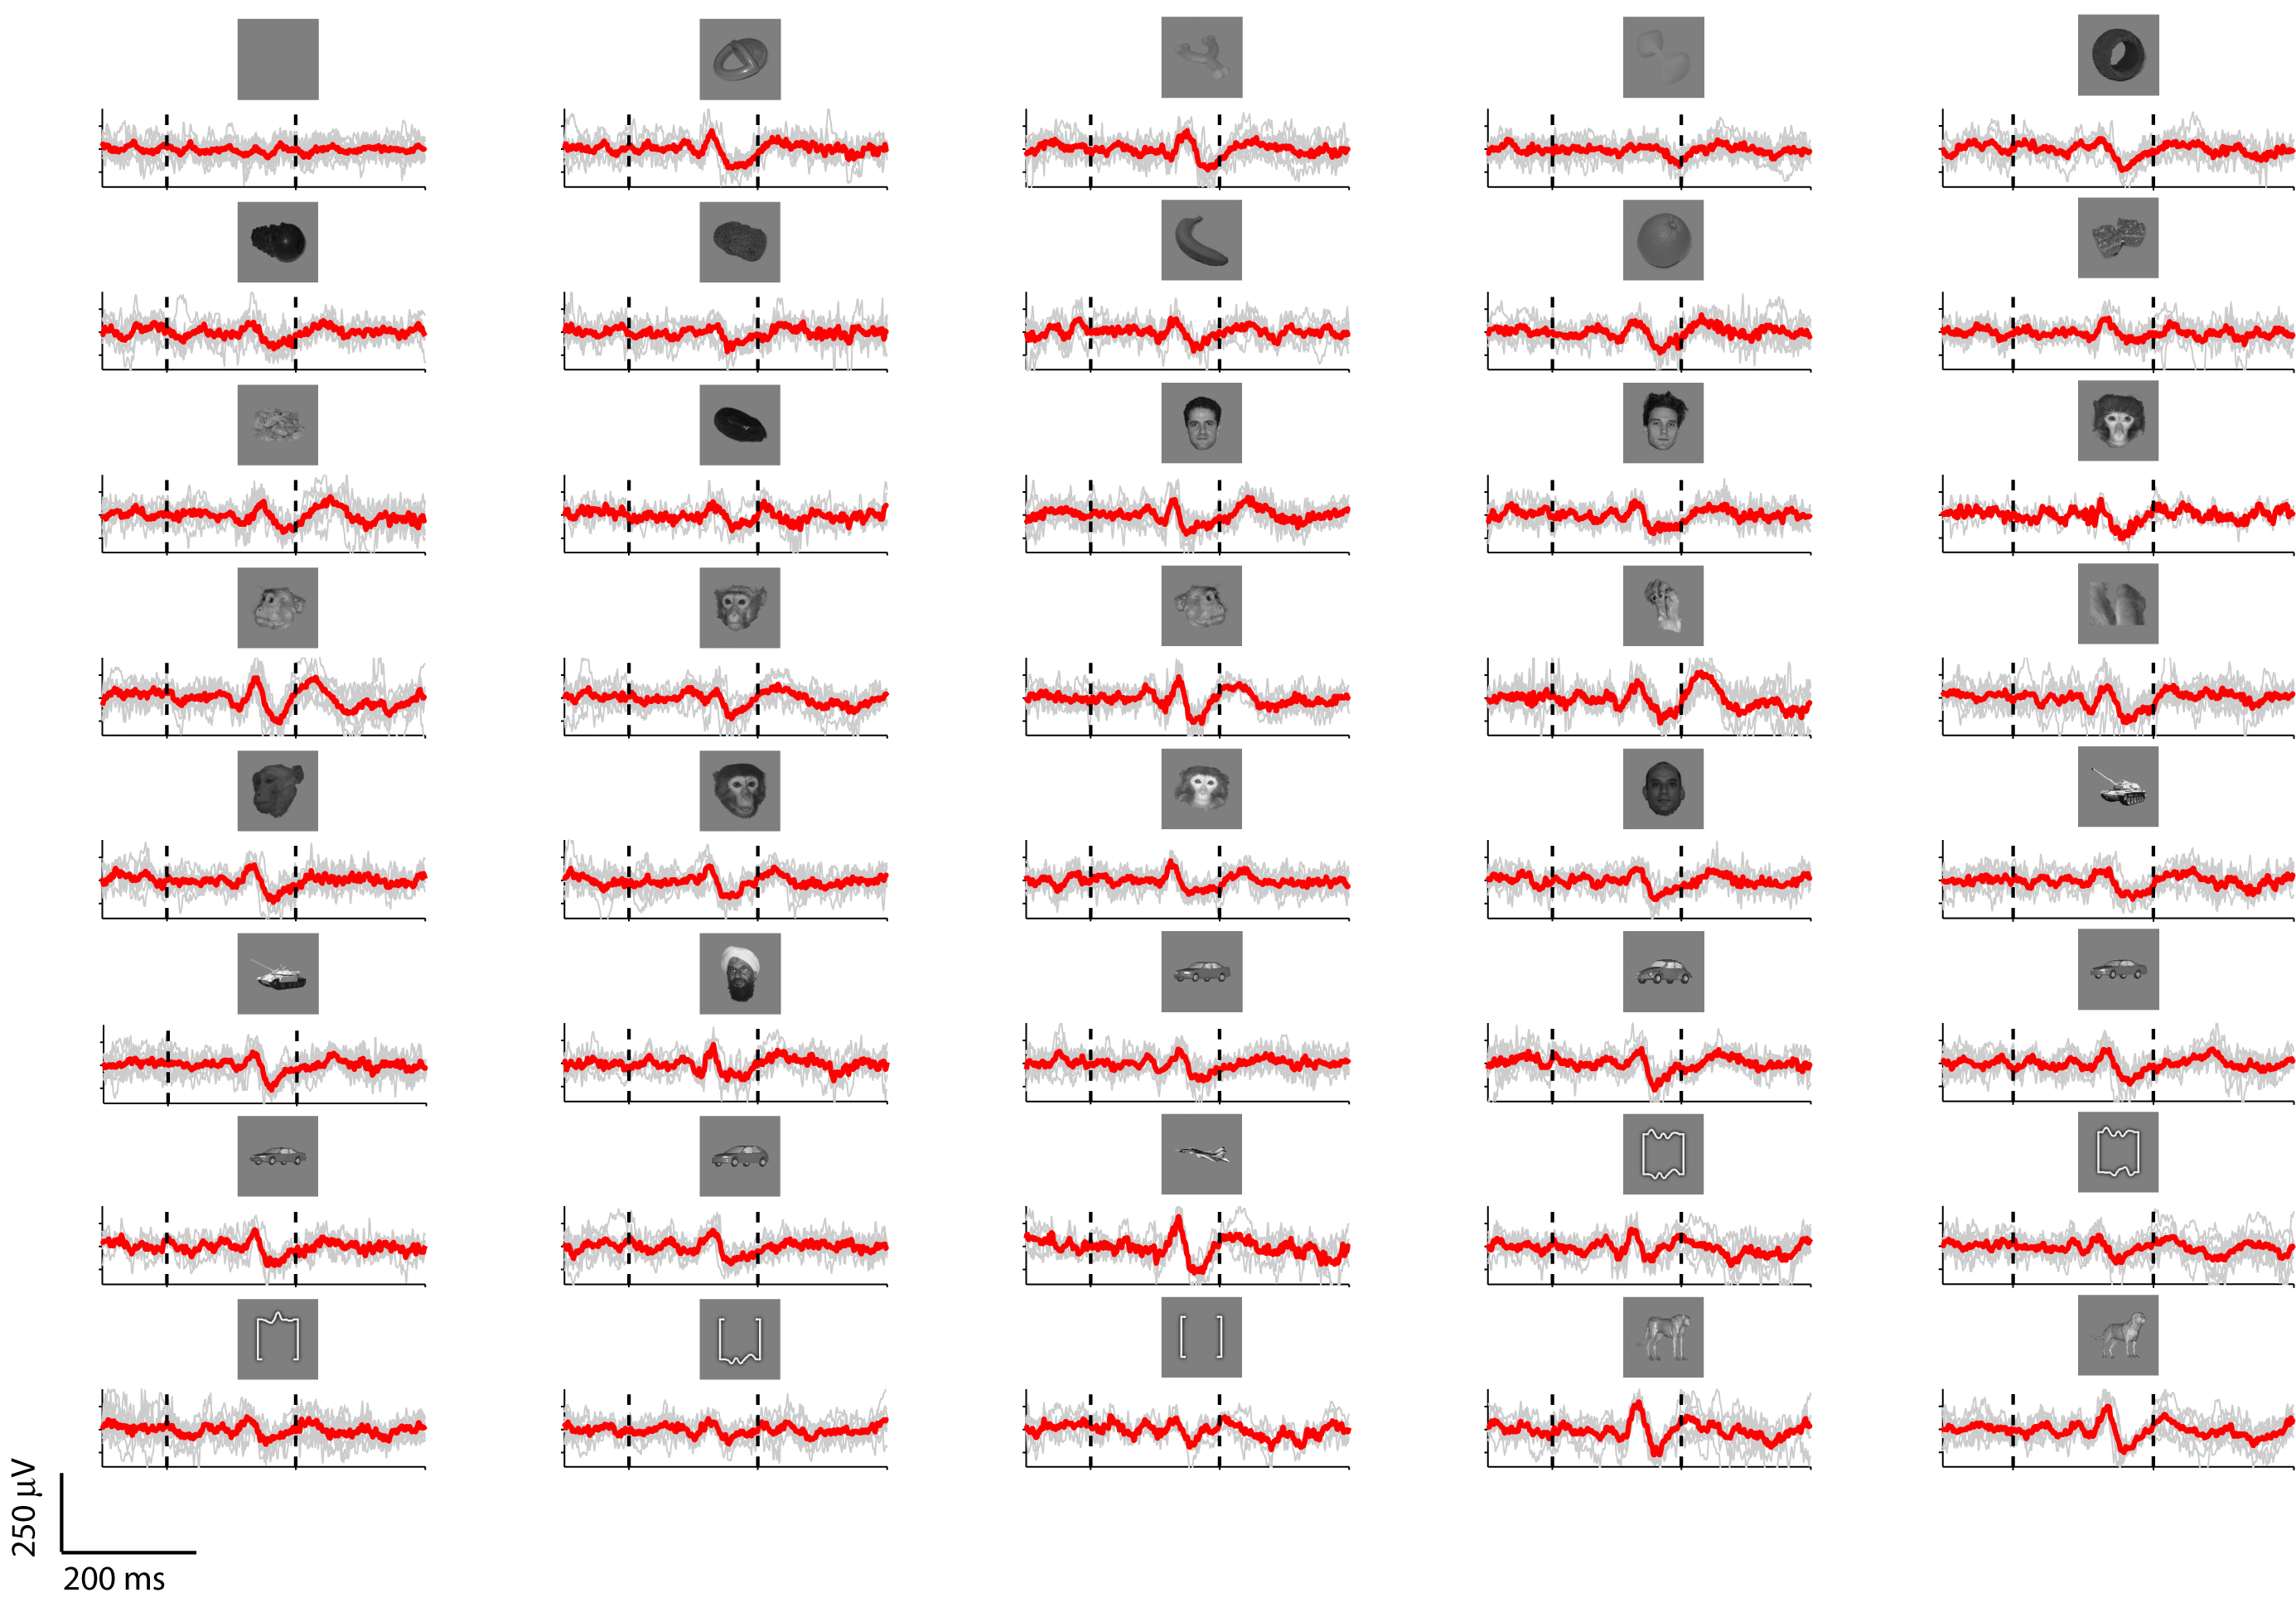
Example of the LFP responses at one IT recording site to a random selection of 40 objects out of the 77 different objects shown to the monkey. The format is the same as in Figure 1 in the main text. The gray lines show the LFP response to each of the 10 repetitions of each stimulus aligned at the time of stimulus onset (the raw signal is low pass filtered at 300 Hz and the DC component is removed). The thick red line shows the average LFP waveform. The vertical dashed lines denote stimulus onset and offset. In contrast to Figure 1 in the main text, here the stimuli were presented for 200 ms and there was a 300 ms blank interval between stimuli.