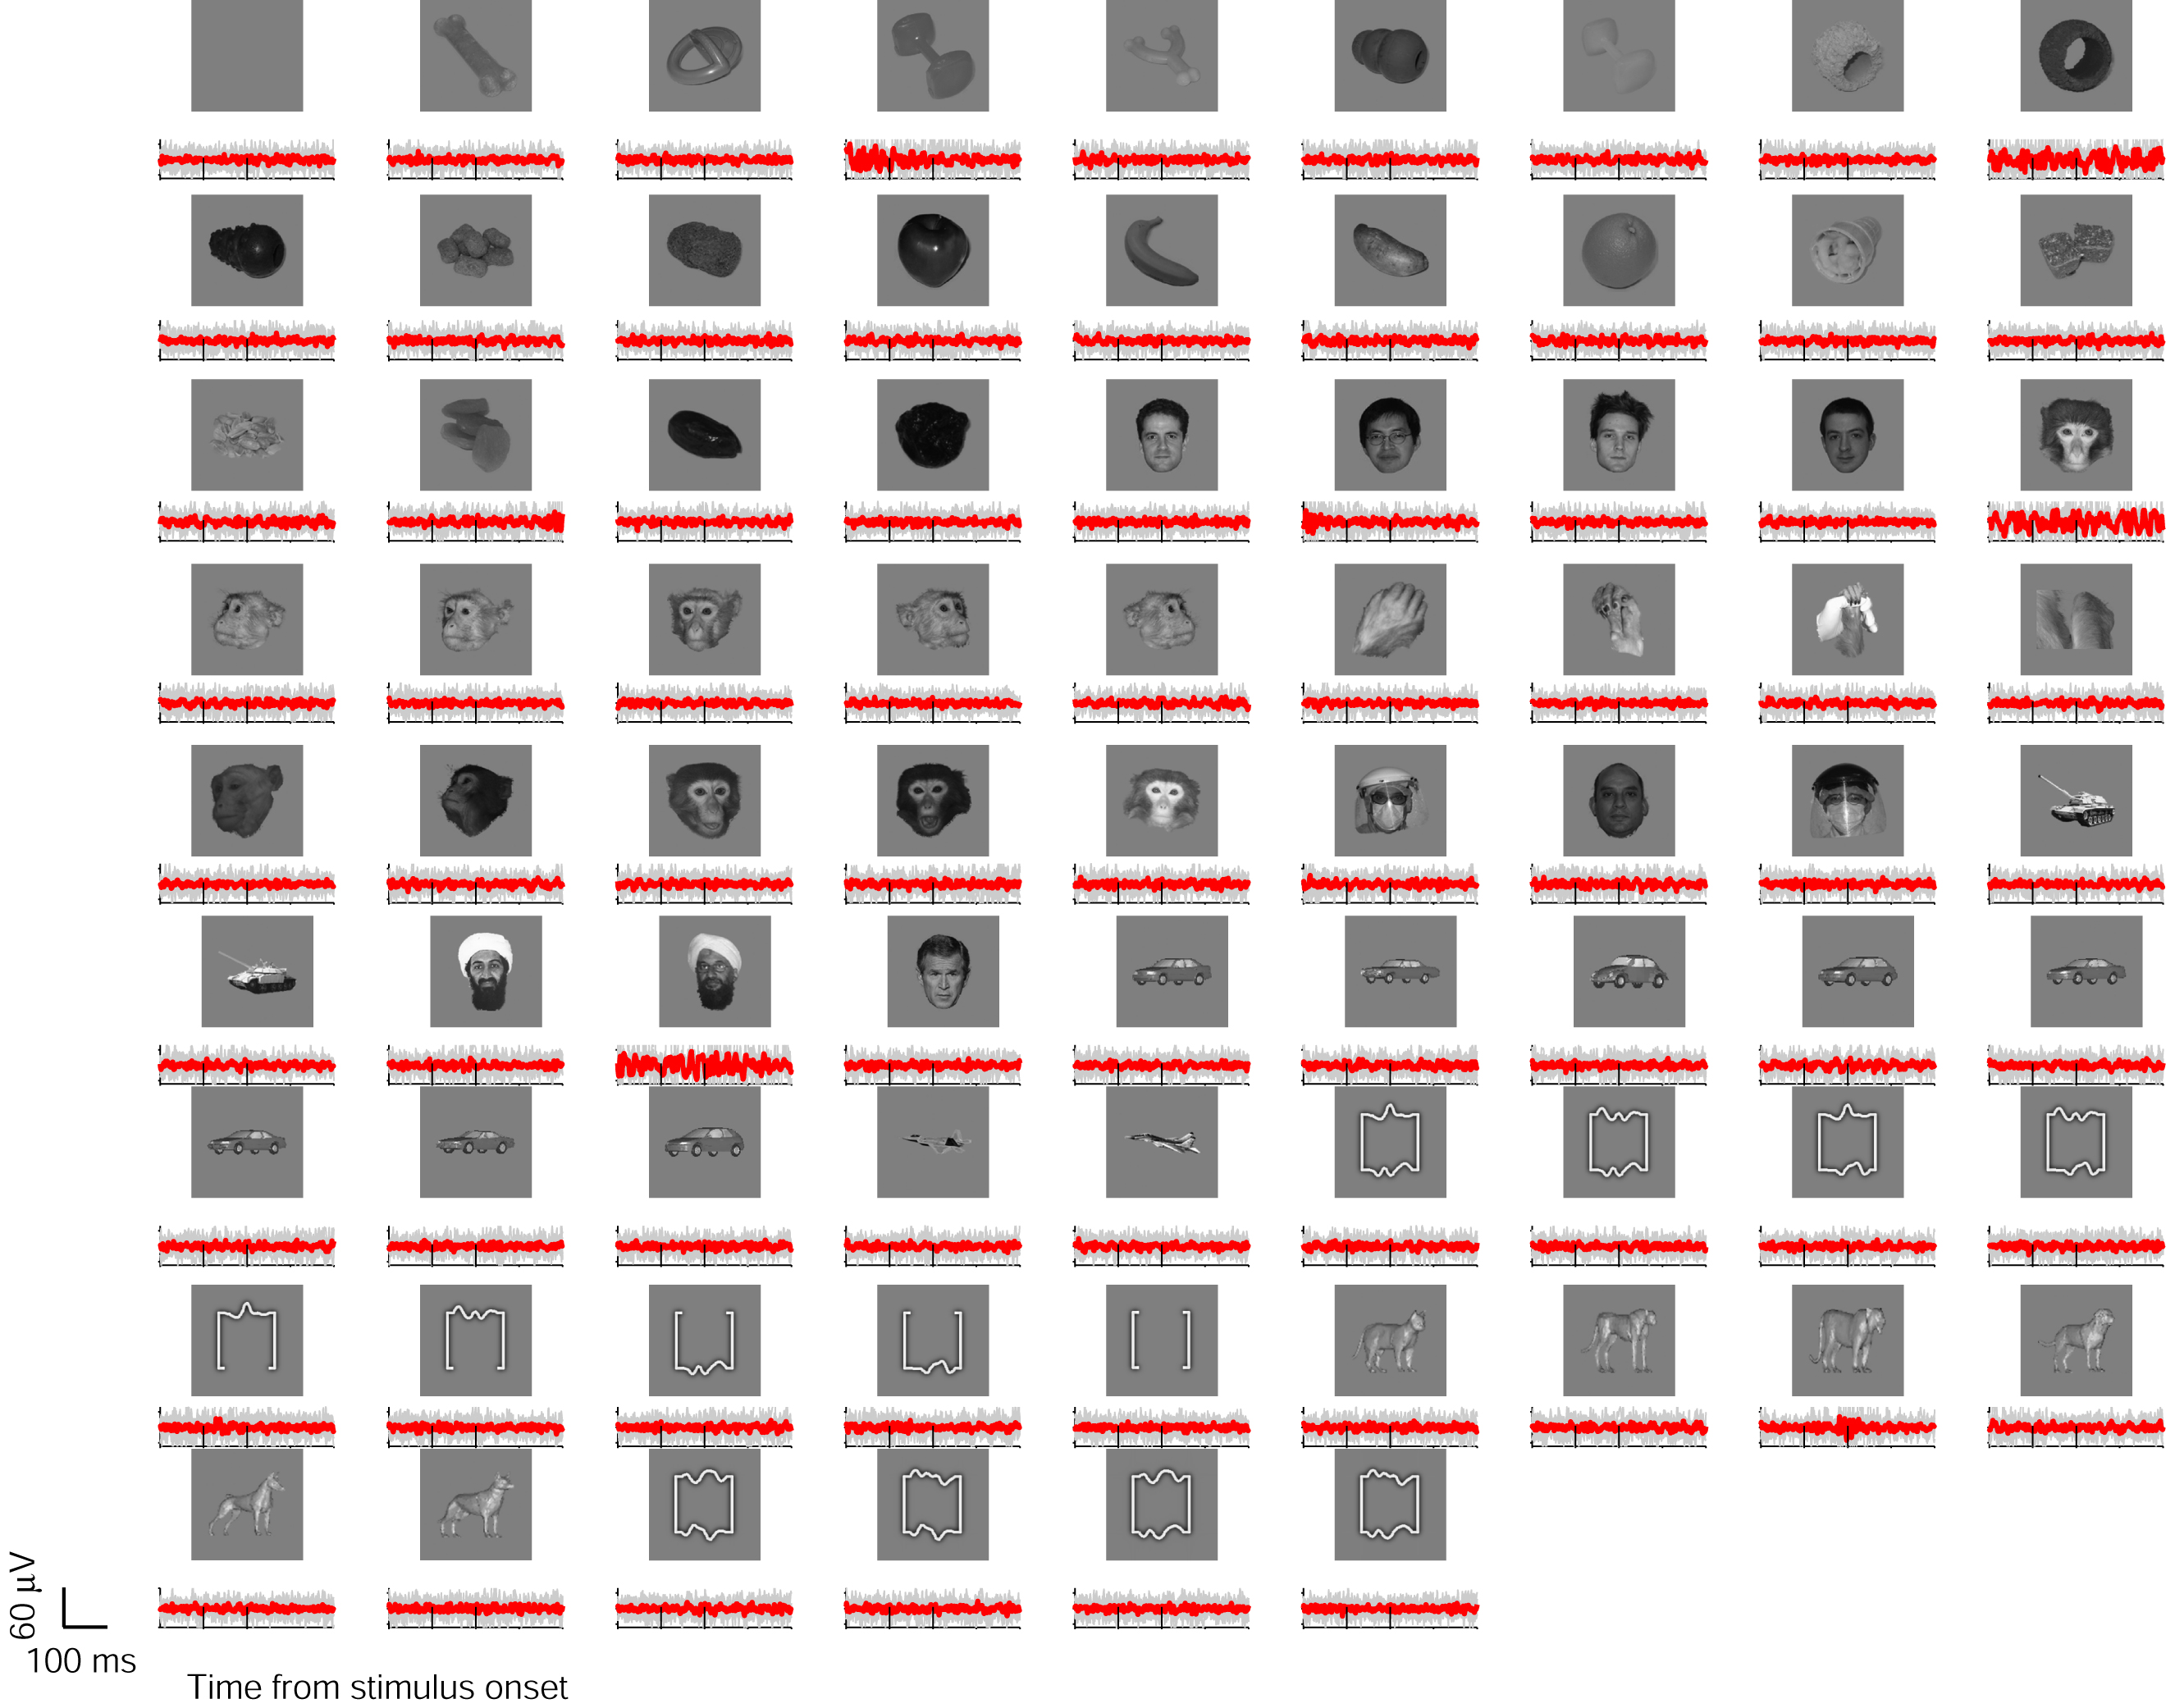
Example of LFP recordings at one site in white matter outside of IT cortex (the format is the same as in Figure 1). The gray lines show the LFP response to each of the 10 repetitions of each stimulus aligned at the time of stimulus onset (the raw signal is low pass filtered at 300 Hz and the DC component is removed). The thick red line shows the average LFP waveform. The vertical dashed lines denote stimulus onset and offset. The response was not selective to any of the images (p>0.2). We did not observe any selectivity in the 18 sites that we recorded from outside of IT (in the white matter just above IT cortex or in the striatum). This distinguishes the LFP recordings from scalp recordings or other long-range electrophysiological recordings of low-frequency signals and further confirms that the LFP signals that we measured are specific to IT cortex.