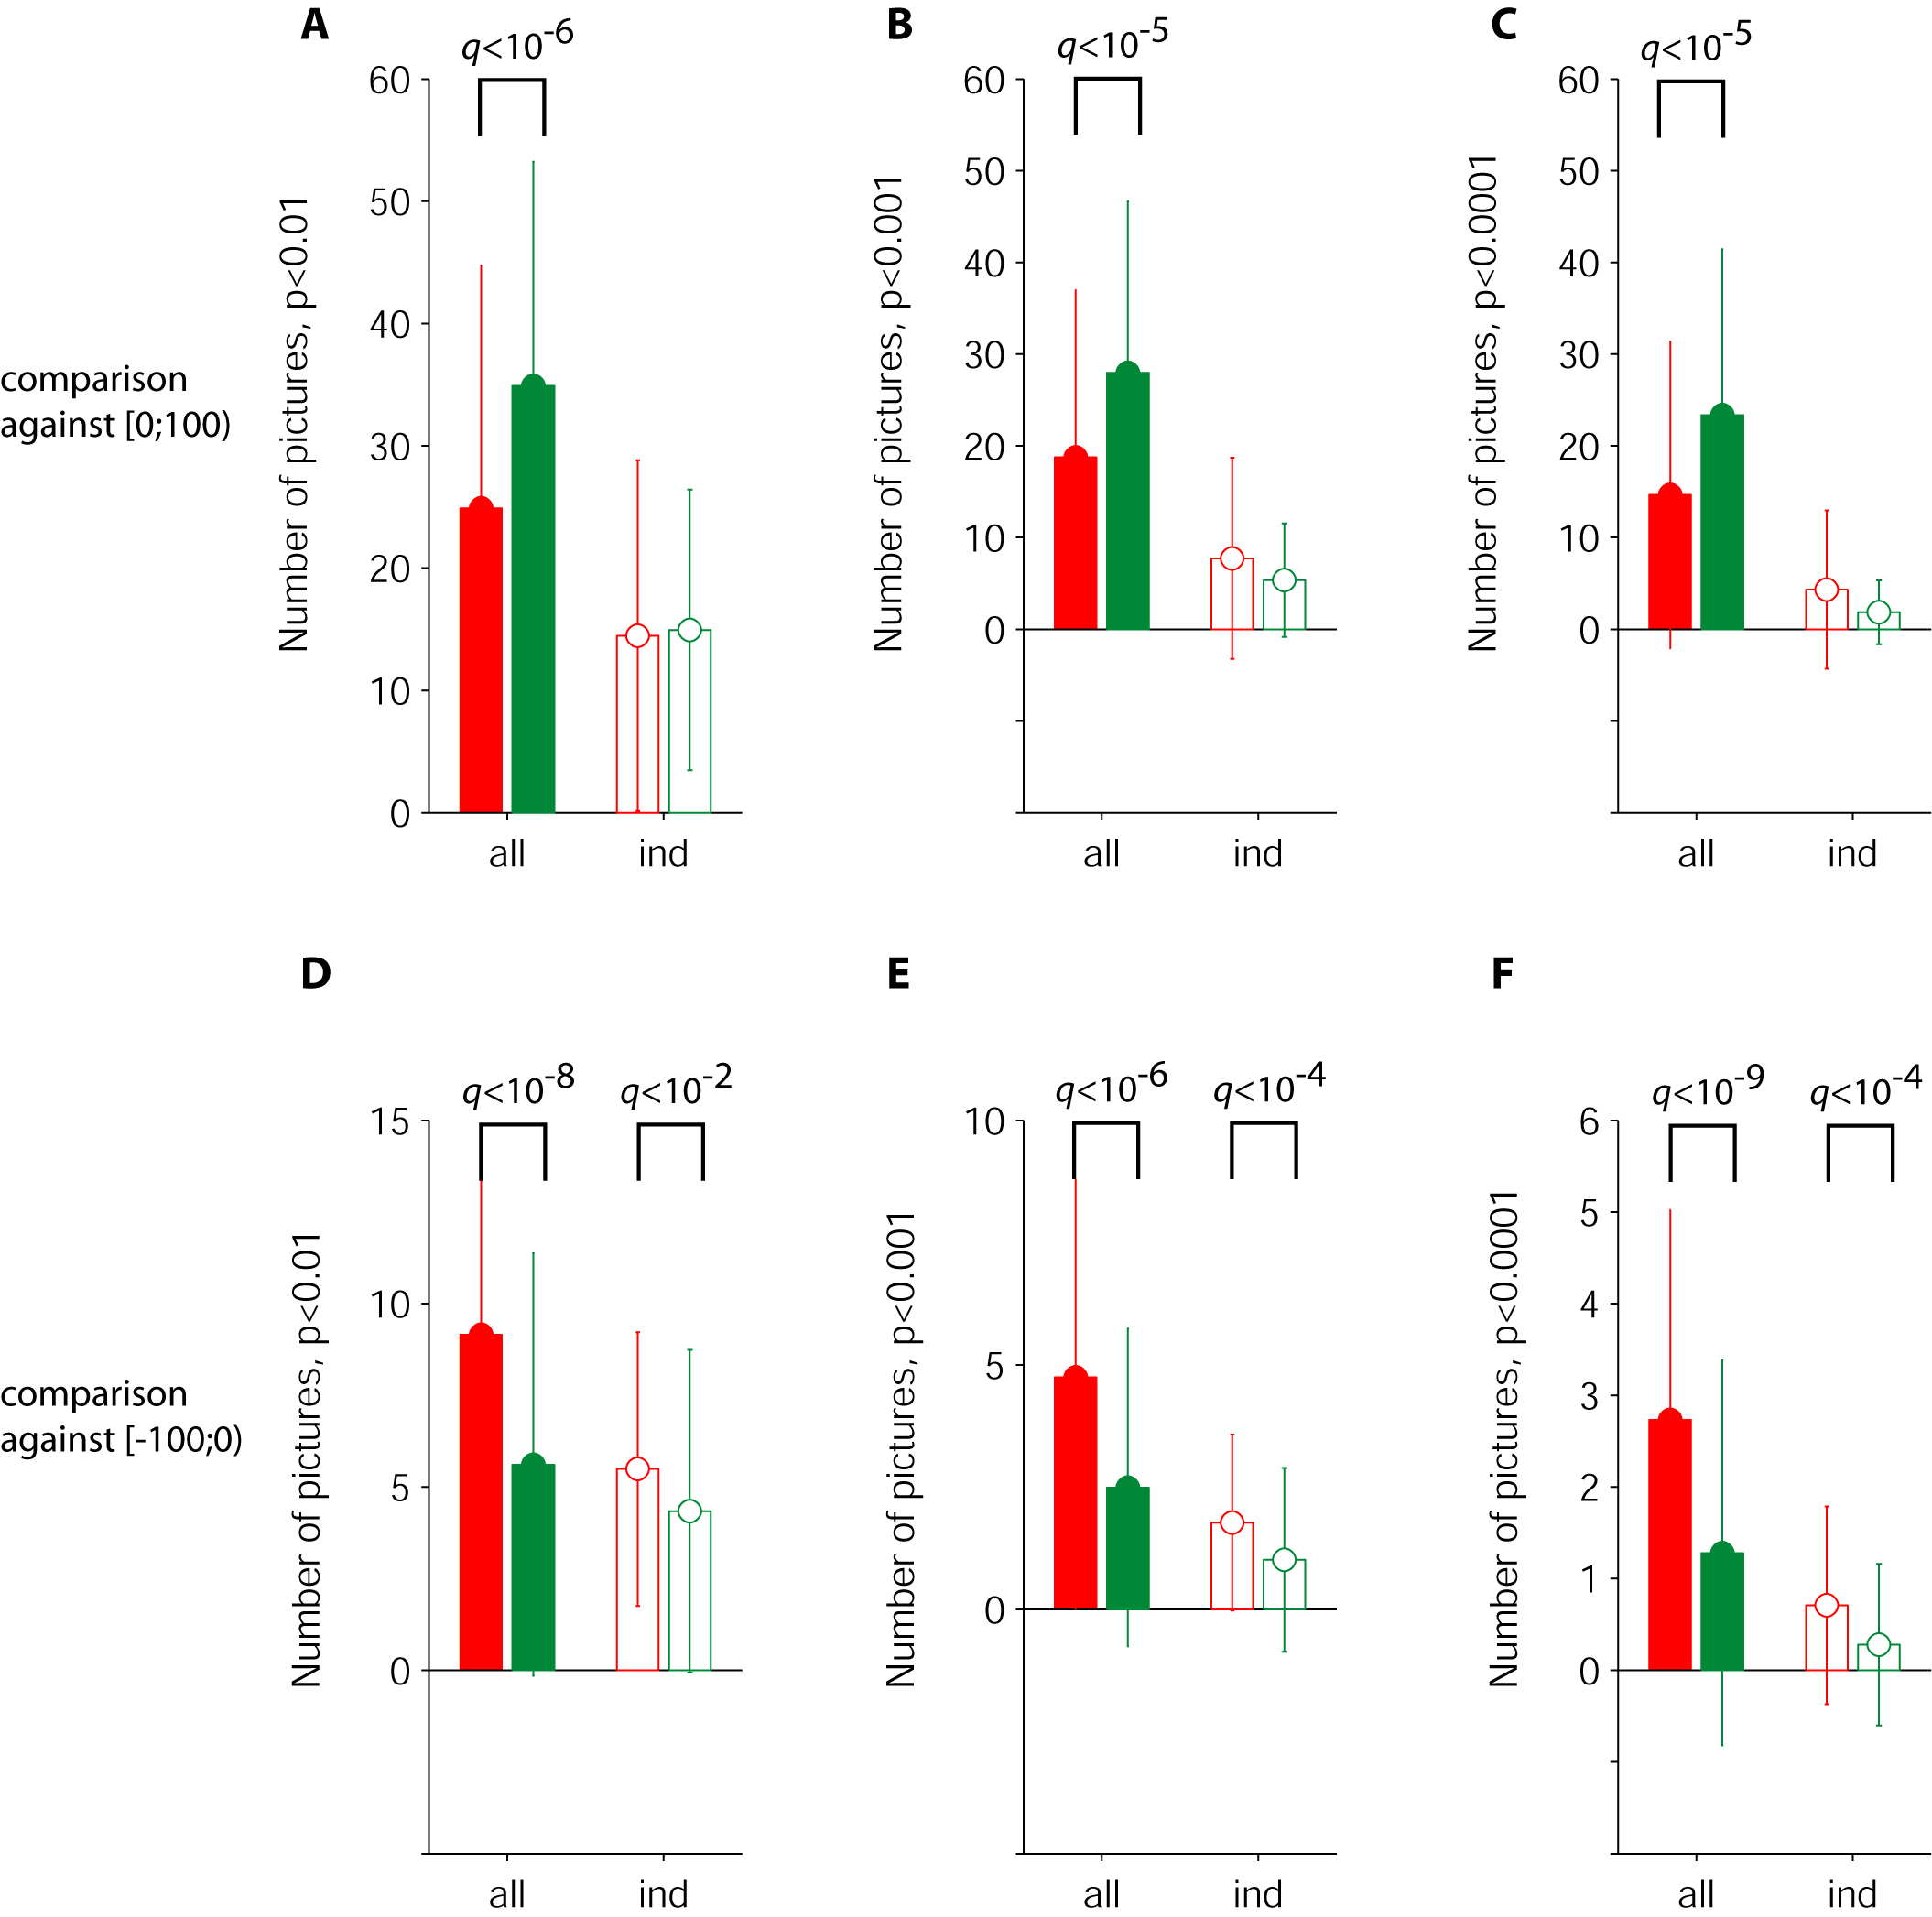
Comparison of different criteria to determine whether a given site responded to an object or not for MUA (red) and LFP (green). (A-C) The baseline was defined as the interval from 0 to 100 ms after stimulus onset (responsivity criterion). (D-F) The baseline was defined as the 100 ms interval before stimulus onset (selectivity criterion). Filled bars: comparison was made for each object against all other objects. Empty bars: comparison was made for each object against the corresponding interval for that object only. The latter condition has only 10 repetitions for each object and therefore has considerably less power. All comparisons indicated here were done using a two-tailed t test. The p value threshold for the t test was (A,D) 0.01, (B,E) 0.001, (C,F) 0.0001. The "q" values show the p values for a t test comparing the number of pictures that showed selectivity for MUA versus LFP (only cases with p<0.01 are shown). The bottom row (comparison against the 100 ms preceding stimulus onset) shows a smaller number of pictures; this is due to the stronger neuronal activity in this interval because of the preceding stimulus presentation. Error bars show one standard deviation.