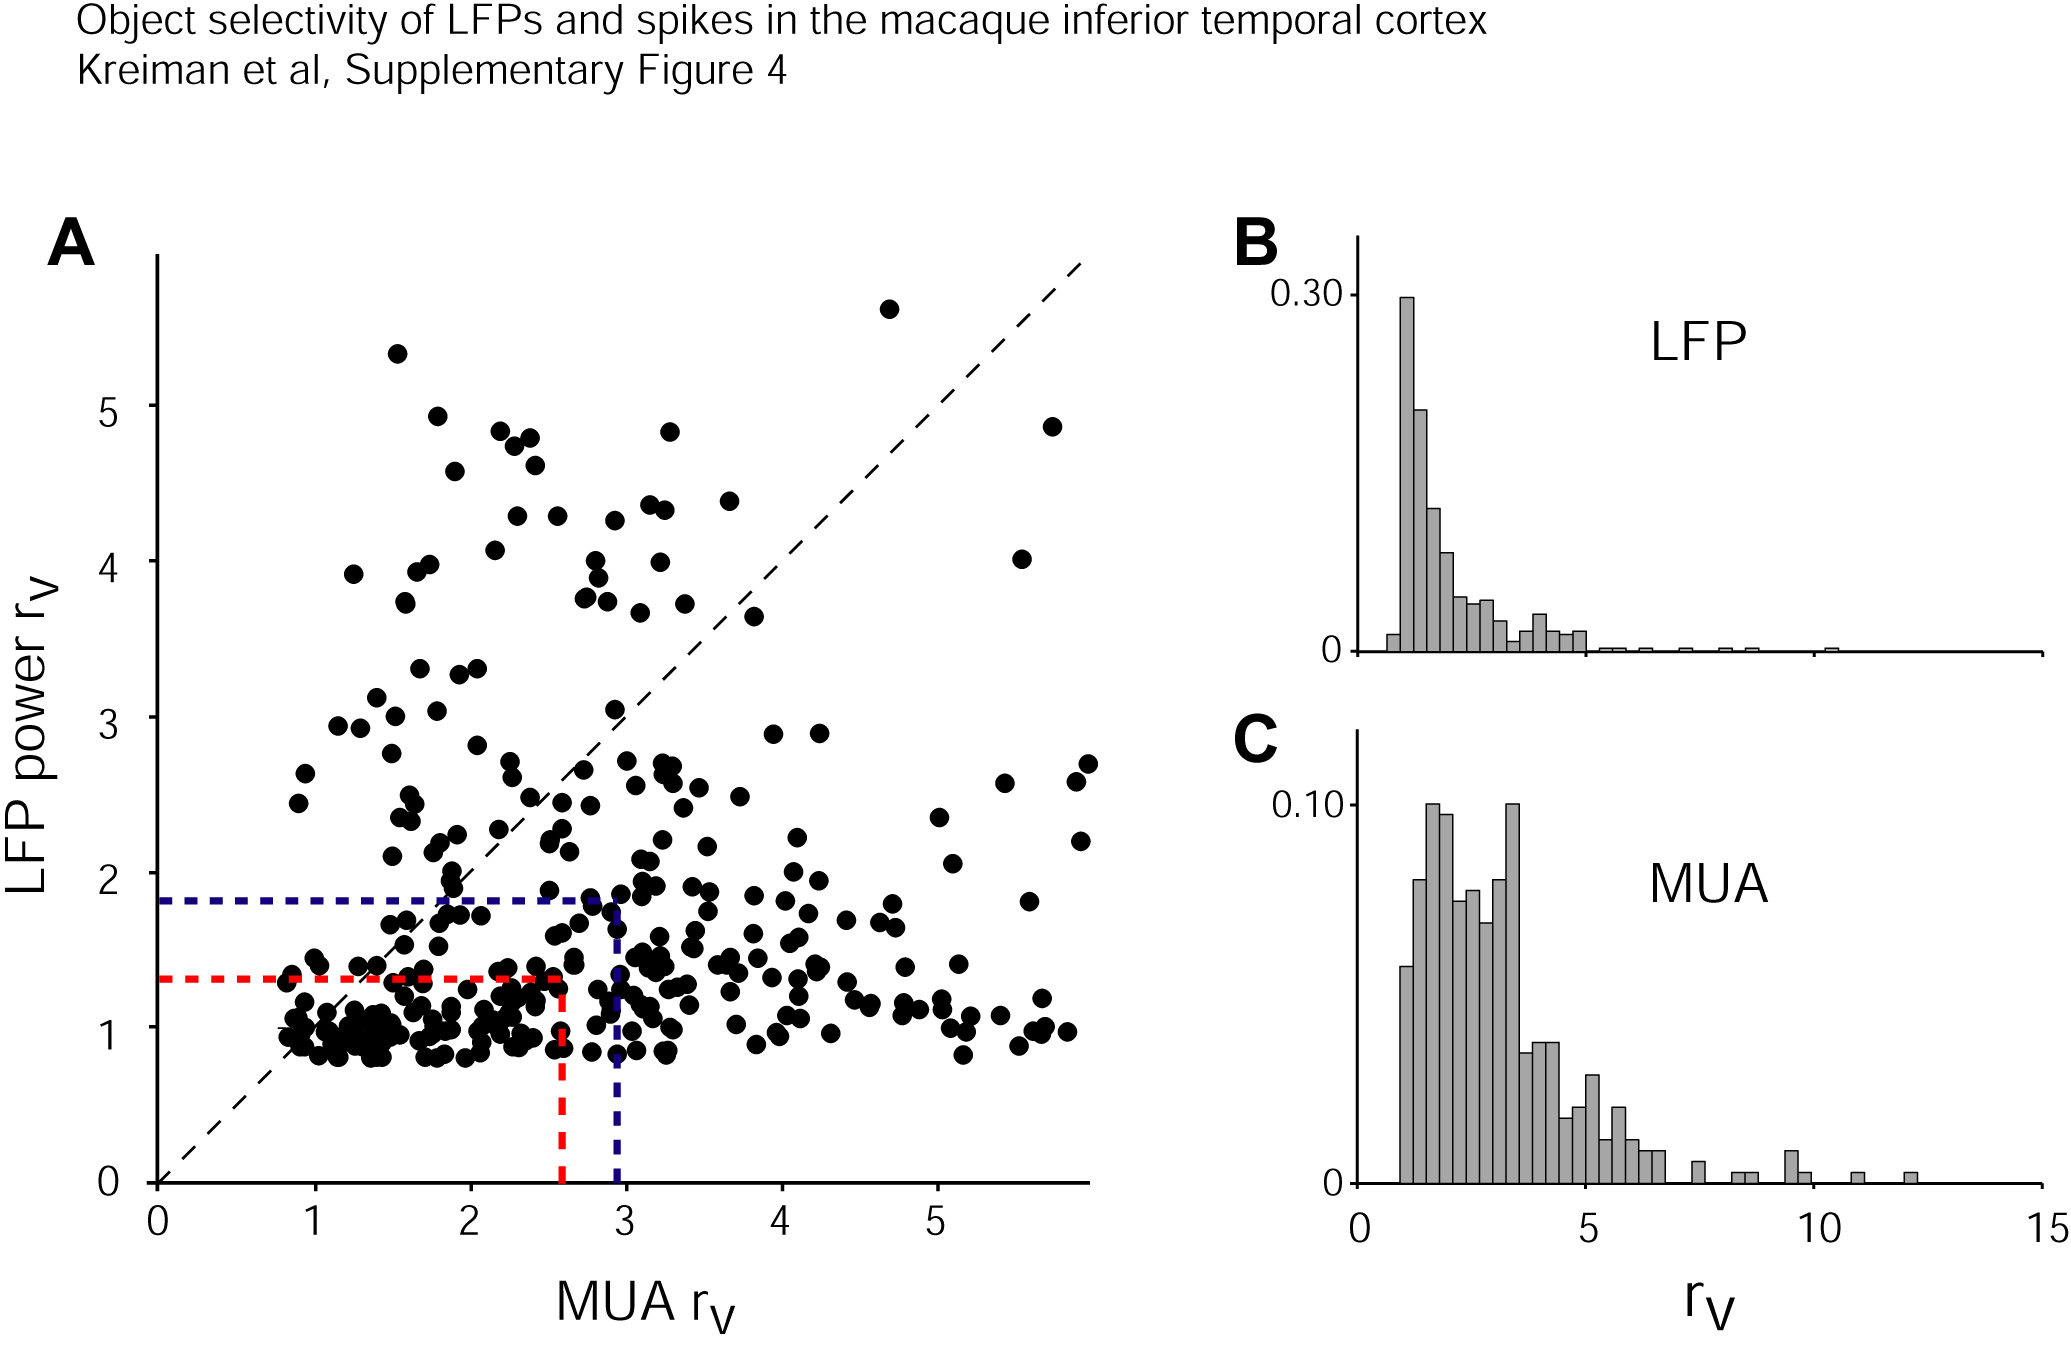
A. Sharpness of the stimulus selectivity (ratio of the variance across pictures
to the variance within pictures, rv, see Experimental Procedures) for LFP power
(ordinate) and the MUA spike counts (abscissa). The diagonal dashed line shows
equivalent MUA and LFP selectivity. We show the median (red) and mean (blue)
of the rv distributions for the MUA and LFP (n=249 including selective and non-selective
sites). The axis was cut at rv=6 for clarity. The distributions of rv values
are shown in panel B (LFP) and panel C (MUA).