Robustness
to two-object images in human visual cortex
Figure W5: Comparison of responses to
target-present images versus target-absent images
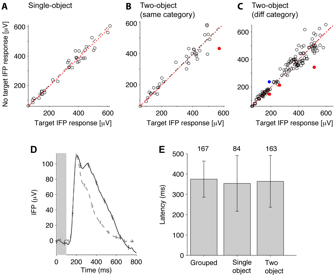 A-C. For each visually selective electrode, we compare
the responses to the preferred object category in images where the preferred
category was the target (x-axis) and images where the target category was
absent. The response is the IFP range from 50 to 300 ms after stimulus onset.
The dotted line is the linear fit to the data and is very close to the diagonal
(dashed line). Red (blue) circles denote cases where the response to target
images was significantly greater (smaller) than the response to non-target
images (two-tailed t-test, p<0.05). A. Single-object images. B. Images containing two objects from the same
category. C.
Images containing two objects from different categories. D. Example electrode showing late
differences between target present and target absent trials. This electrode was
located in the left inferior temporal cortex. The plot shows the average
responses to all images where the target category was present (solid black
line) and all the images where the target category was not present (dashed gray
line). Error bars denote one SEM. Note that the solid and dashed lines start to
separate around 300 ms after stimulus onset. E. Latencies for discriminating images that contained the target
from images that did not contain the target. At each time point, we performed a
t-test between the IFP for target images and non-target images. The latency was
defined as the first time point where n=15 time points yielded p<0.01 in
this analysis. The number of electrodes that passed this criterion is indicated
above each bar. “Grouped” refers to all images. “Single object” refers to
images containing single objects. “Two-object” refers to images containing two
objects from different categories. Error bars denote one SD.
A-C. For each visually selective electrode, we compare
the responses to the preferred object category in images where the preferred
category was the target (x-axis) and images where the target category was
absent. The response is the IFP range from 50 to 300 ms after stimulus onset.
The dotted line is the linear fit to the data and is very close to the diagonal
(dashed line). Red (blue) circles denote cases where the response to target
images was significantly greater (smaller) than the response to non-target
images (two-tailed t-test, p<0.05). A. Single-object images. B. Images containing two objects from the same
category. C.
Images containing two objects from different categories. D. Example electrode showing late
differences between target present and target absent trials. This electrode was
located in the left inferior temporal cortex. The plot shows the average
responses to all images where the target category was present (solid black
line) and all the images where the target category was not present (dashed gray
line). Error bars denote one SEM. Note that the solid and dashed lines start to
separate around 300 ms after stimulus onset. E. Latencies for discriminating images that contained the target
from images that did not contain the target. At each time point, we performed a
t-test between the IFP for target images and non-target images. The latency was
defined as the first time point where n=15 time points yielded p<0.01 in
this analysis. The number of electrodes that passed this criterion is indicated
above each bar. “Grouped” refers to all images. “Single object” refers to
images containing single objects. “Two-object” refers to images containing two
objects from different categories. Error bars denote one SD.
Last updated: 1/15/10