Click on Figure to enlarge
The results described in the main text compare the distribution of order/pattern
patterns against the null hypothesis of a uniform distribution using a
chi square test (Keeping ES: Introduction to Statistical Inference. New York:
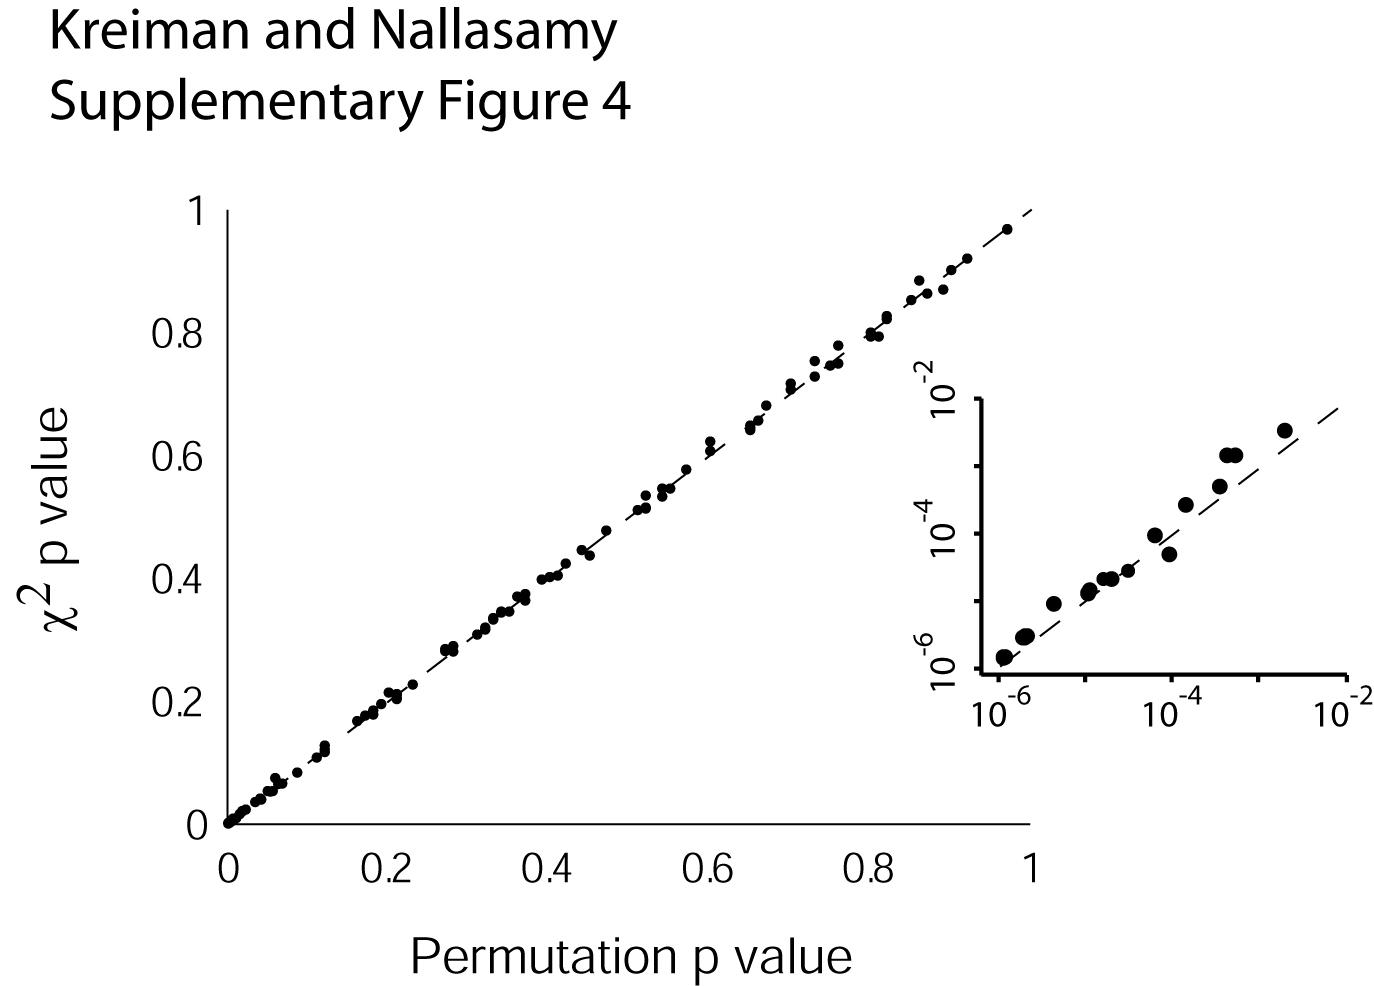
Dover; 1995). In one every 100 tests, we compared the p values
obtained from the chi square test against a randomization test where the labels
of the patterns present in each gene were assigned randomly
(Efron B, Tibshirani RJ: An Introduction to the Bootstrap. London: Chapman &
Hall/CRC; 1993). This figure directly compares the two statistical
tests showing that there was a very strong agreement between the two. The inset
zooms in to show the p values between 10^-6 and 0.01 (in log scale).
.