Supplementary Figure 5
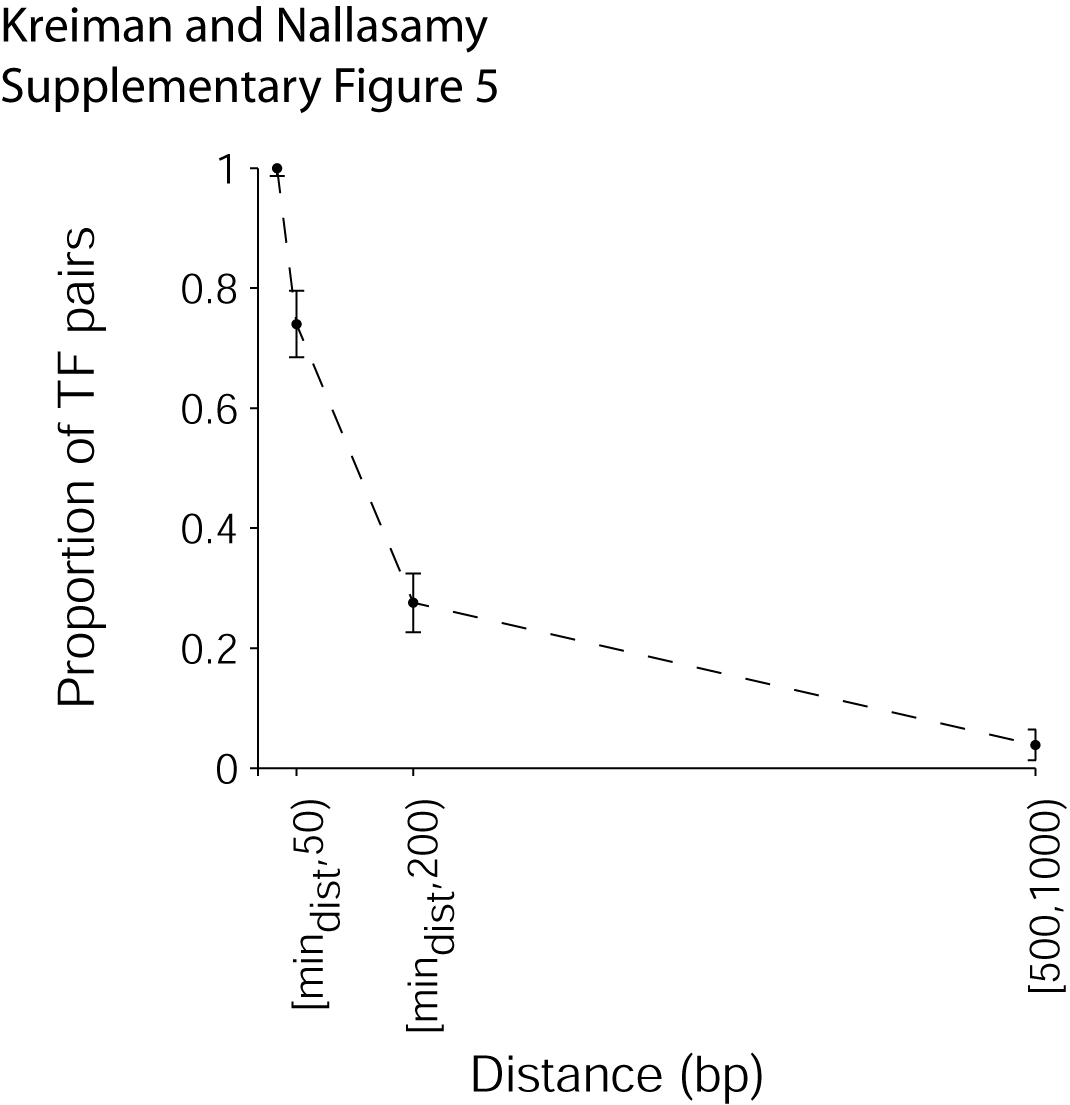
Relative proportion of the number of motif pairs that showed significant order/orientation
pattern biases as a function of the maximum distance between motifs
(max_d, see Methods in the main text). The number of pairs was normalized
with respect to the number of pairs for max_d = 25 bp. The values shown
in this
figure correspond to the average over Hs and Mm and the different
threshold values, the error bars correspond to one standard deviation.