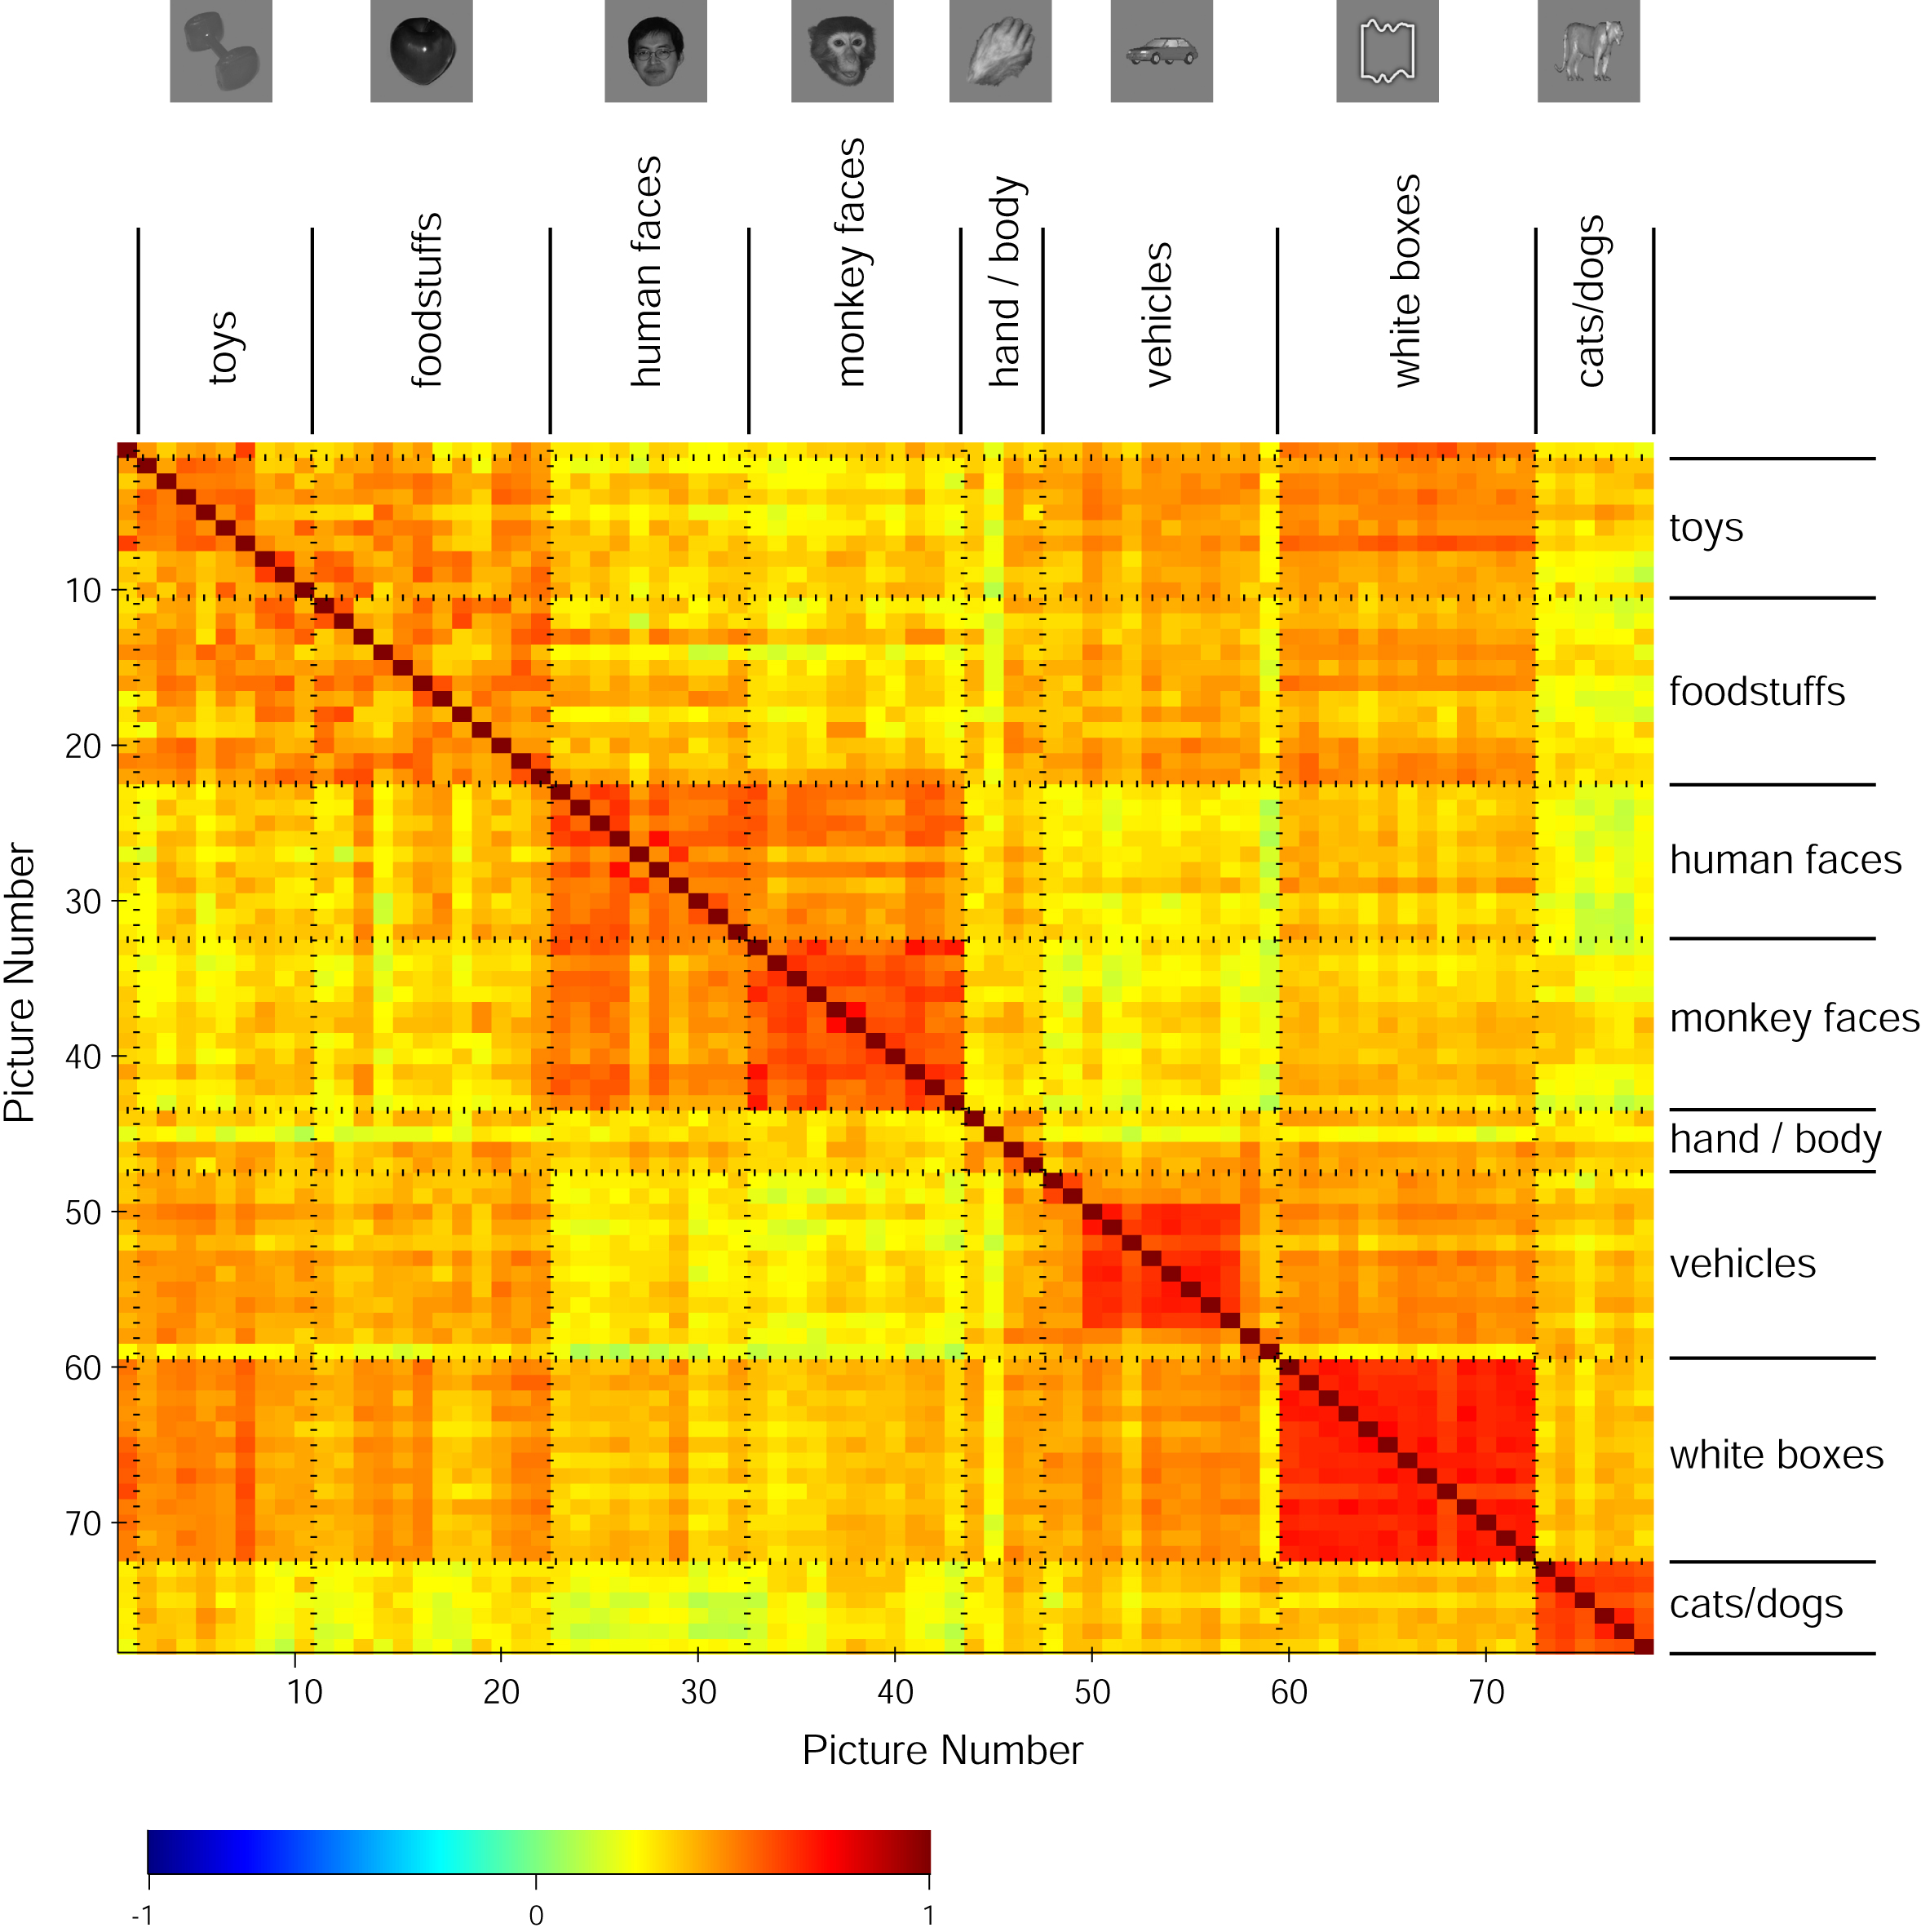
Similarity between pictures based on the spiking population activity. Each entry (i,j) in the matrix shows the Pearson correlation coefficient between the vectors containing responses of all sites (n=340) to picture i and picture j. The responses consisted of the spike count in the 100 to 300 ms window after stimulus onset (using multi-unit spiking activity). The scale of the correlation coefficients is color coded (see scale at the bottom of the figure). The diagonal is 1 by definition. The dimensions of the matrix are 78 x 78 (picture 1 is a blank image). The dashed lines divide the groups of pictures used in the classification task (see text for details). A representative example from each group is shown above the matrix.