 If you don't see the image click here
If you don't see the image click here
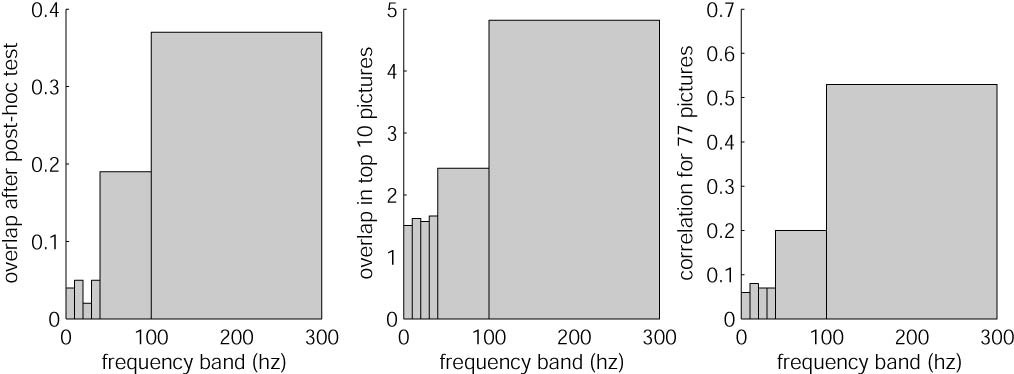
A) Overlap between the selective pictures (after post-hoc t test) between MUA and LFP responses
B) Overlap in the top 10 pictures between MUA and LFP responses
C) Correlation coefficient for 77 pictures between MUA and LFP responses
Here the different comparison measures between MUA and LFP were computed separately for the following frequency bands:
i) 0 to 10 Hz
ii) 10 to 20 Hz
iii) 20 to 30 Hz
iv) 30 to 40 Hz
v) 40 to 100 Hz
vi) 100 to 300 Hz