selectivity = ANOVA p < 0.001
n_lfp_only = number of sites where the LFP was selective and the MUA was not
n_mua_only = number of sites where the MUA was selective and the LFP was not
n_mualfp = number of sites where both LFP and MUA were selective
n_ind_identical = number of sites where the MUA and LFP selectivity for individual stimuli was identical
n_grp_identical = number of sites where the MUA and LFP selectivity was within the same groups
n_overlap_ind = number of sites where the MUA and LFP selectivity showed some overlap for individual images
n_overlap_grp = number of sites where the MUA and LFP selectivity showed some overlap for the image groups
n_sites_mualfp=356 (total number of sites with appropriate MUA and LFP data)
| n_lfp_only | n_mua_only | n_mualfp | n_ind_identical | n_grp_identical | n_overlap_ind | n_overlap_grp | |
|---|---|---|---|---|---|---|---|
| max(LFP)-min(LFP) | 17 | 133 | 143 | 0 | 3 | 30 | 66 |
| msa power | 16 | 154 | 122 | 0 | 3 | 18 | 50 |
| [0;10) Hz | 19 | 151 | 125 | 0 | 1 | 10 | 43 |
| [10;20) Hz | 16 | 173 | 103 | 0 | 3 | 10 | 46 |
| [20;30) Hz | 1 | 256 | 20 | 0 | 0 | 0 | 5 |
| [30;40) Hz | 1 | 262 | 14 | 0 | 0 | 1 | 6 |
| [40;100) Hz | 1 | 236 | 40 | 1 | 8 | 17 | 21 |
| [100;300) Hz | 2 | 116 | 160 | 6 | 29 | 108 | 124 |
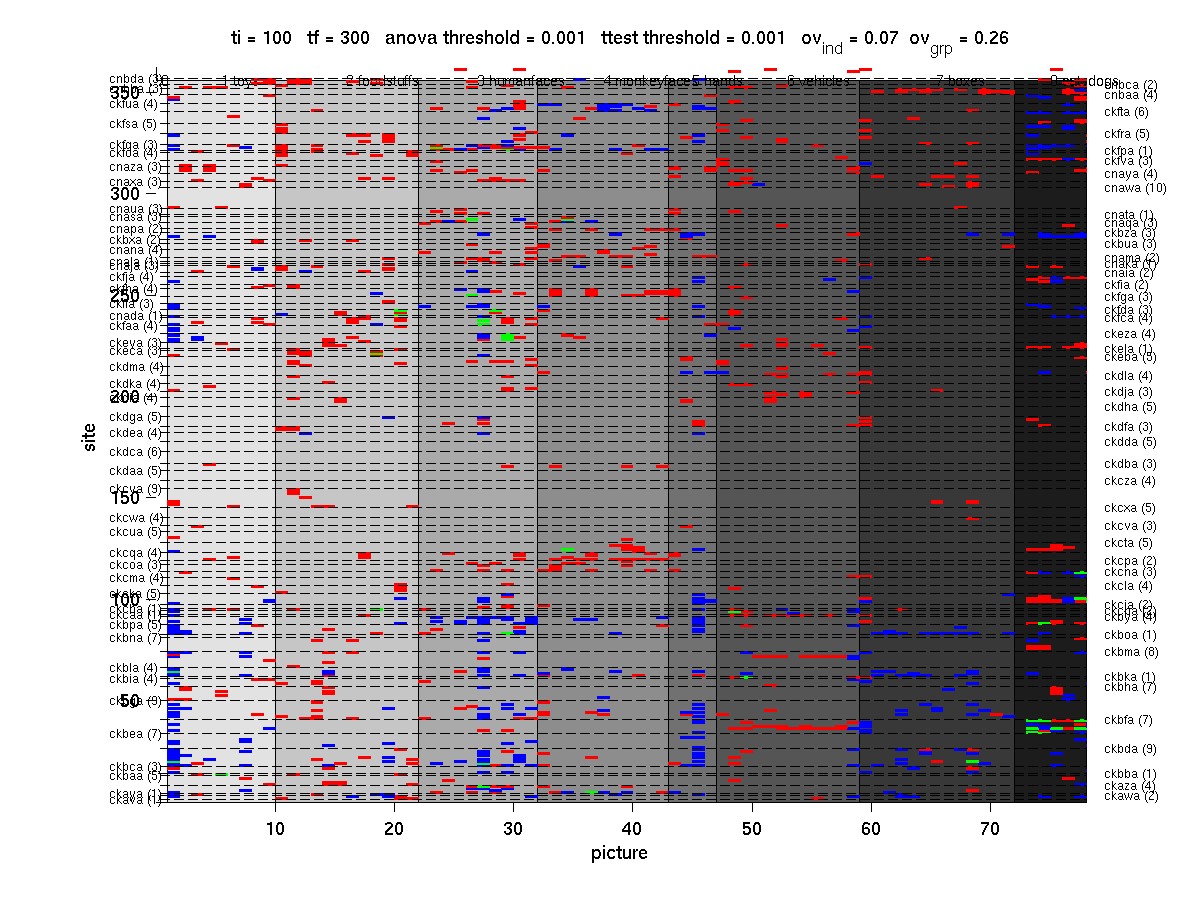
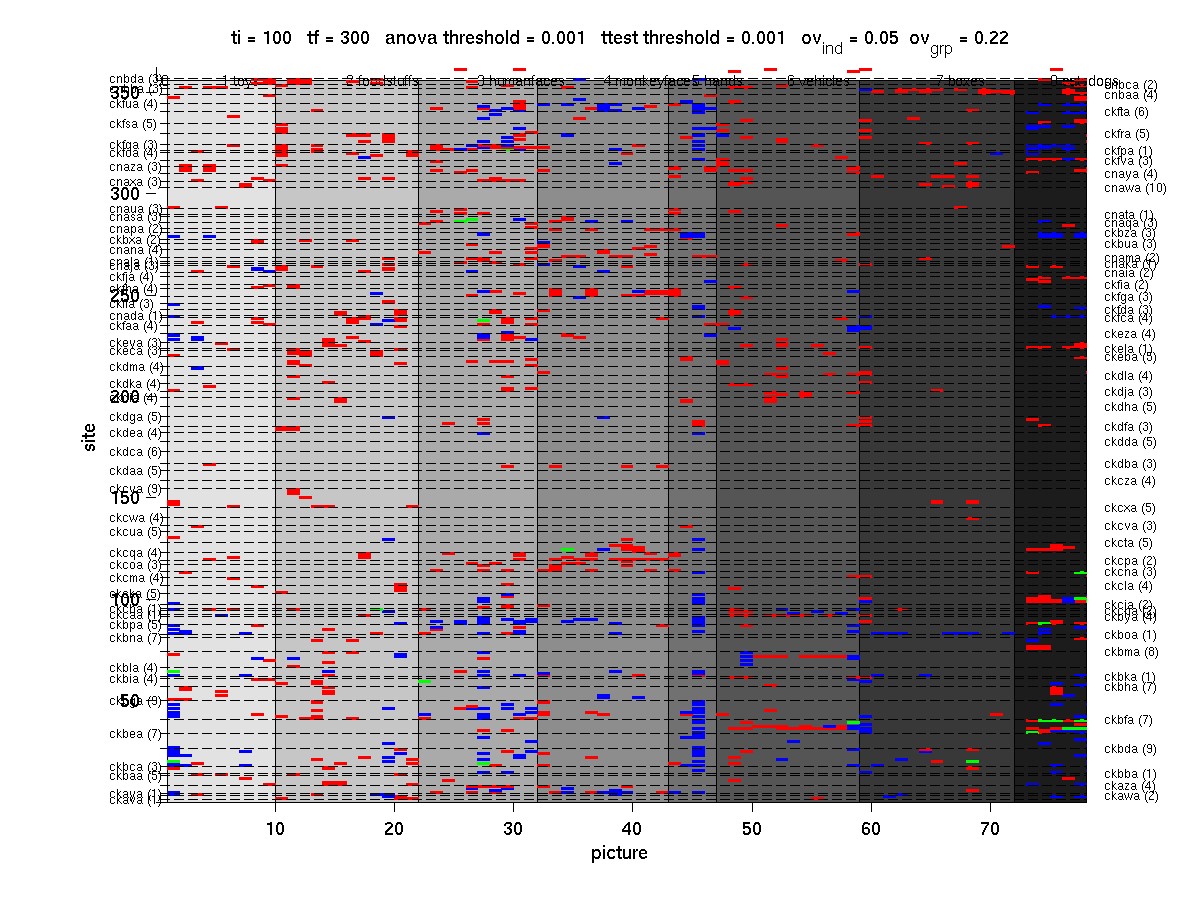
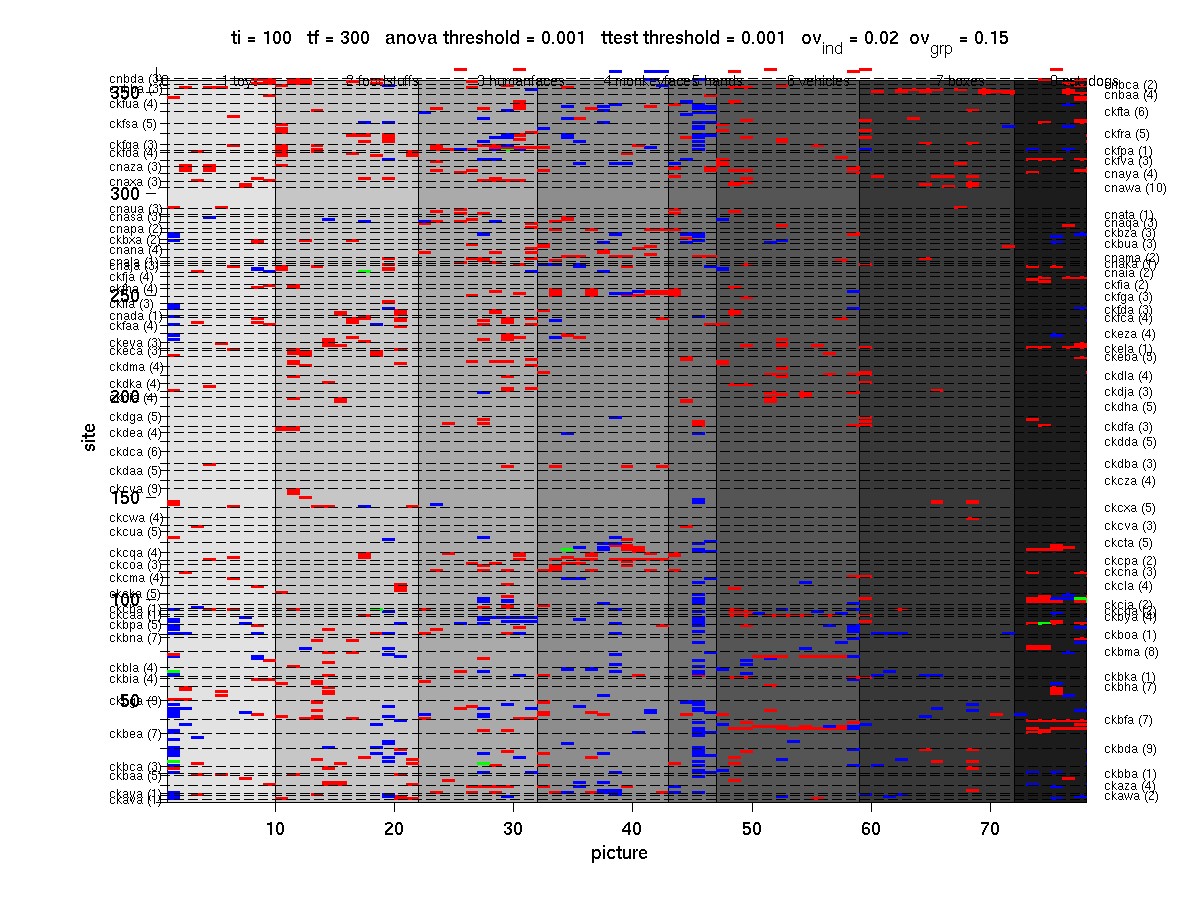
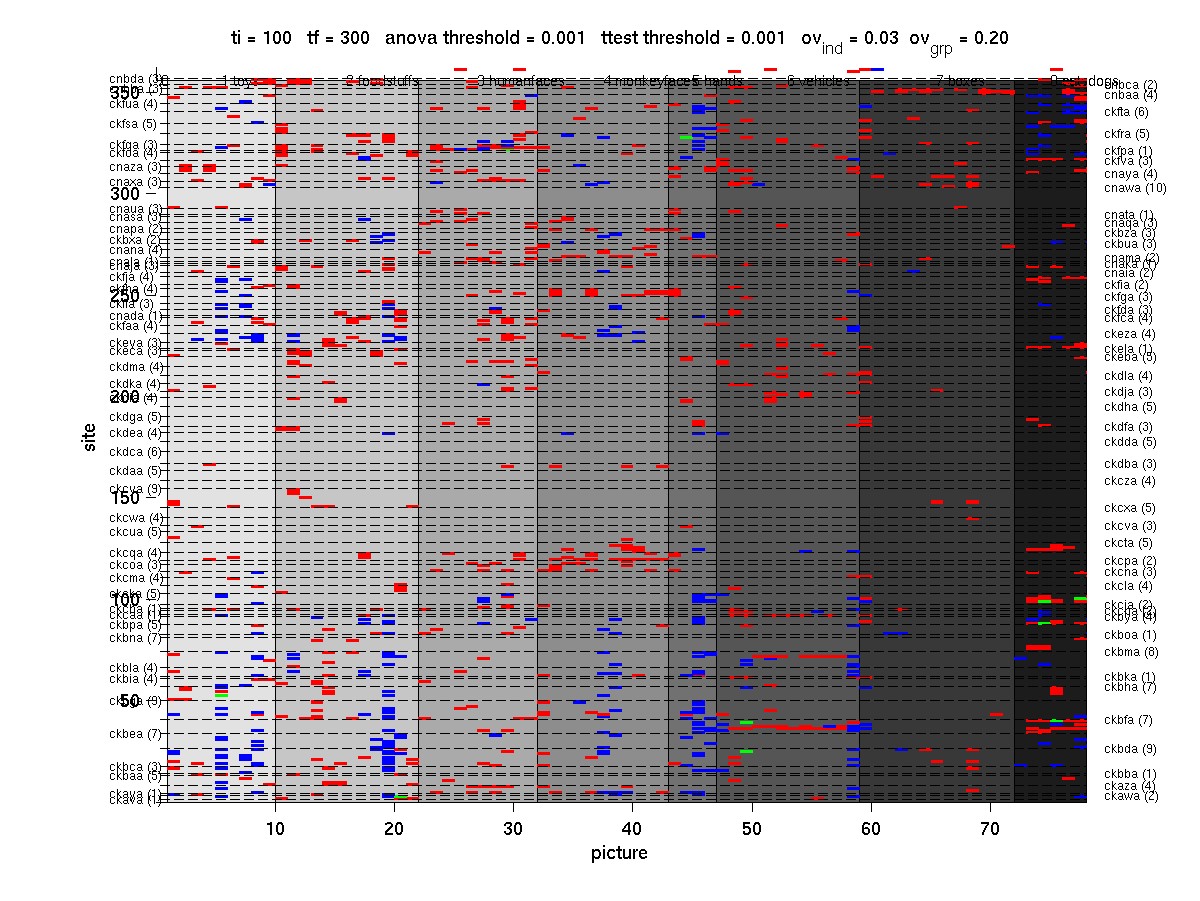
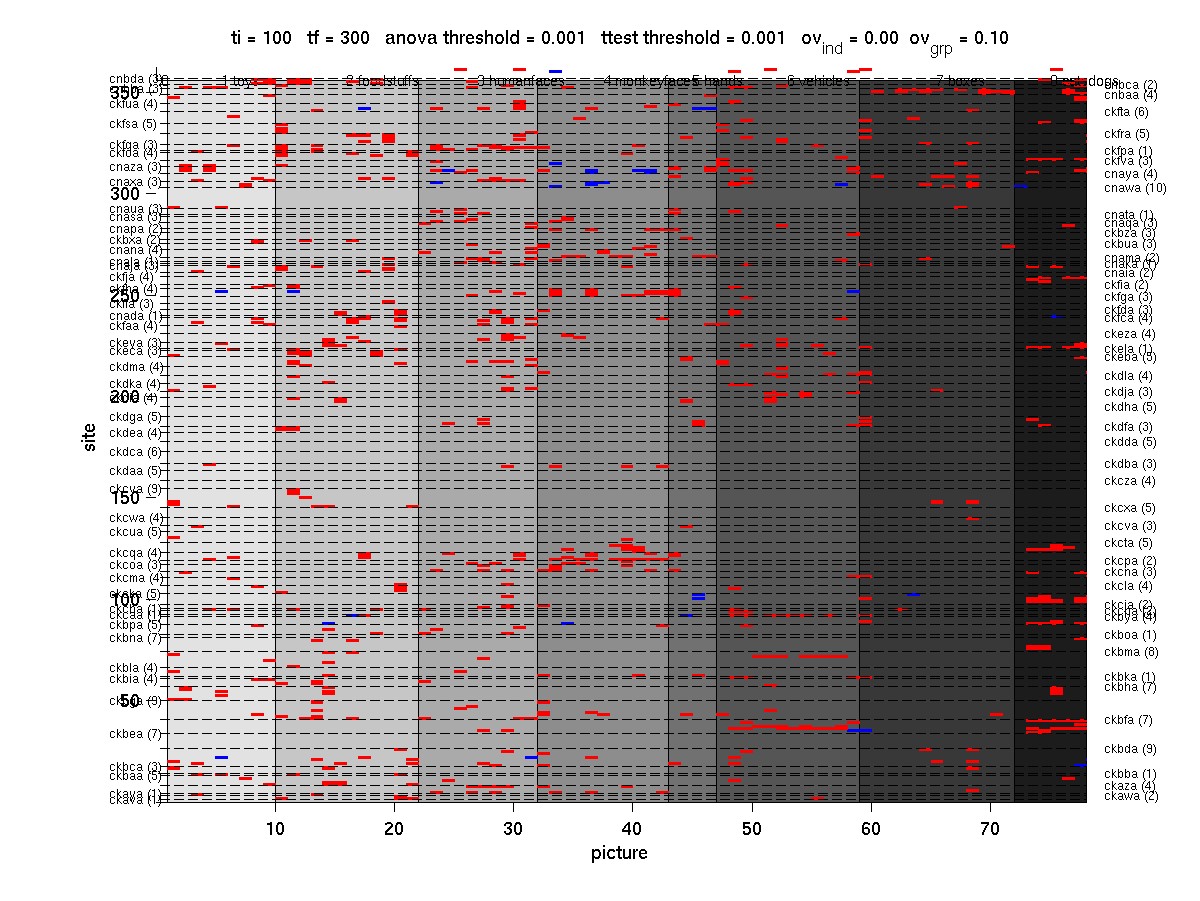
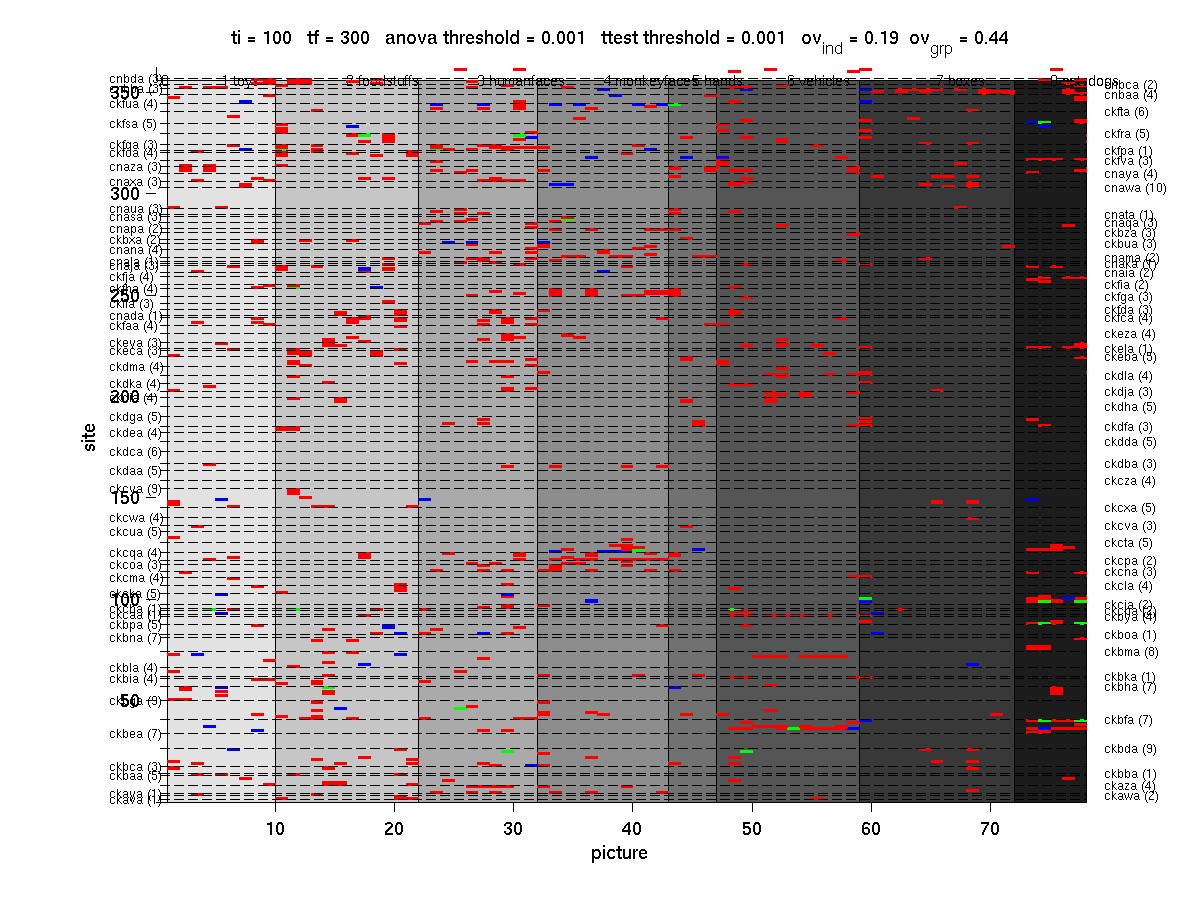
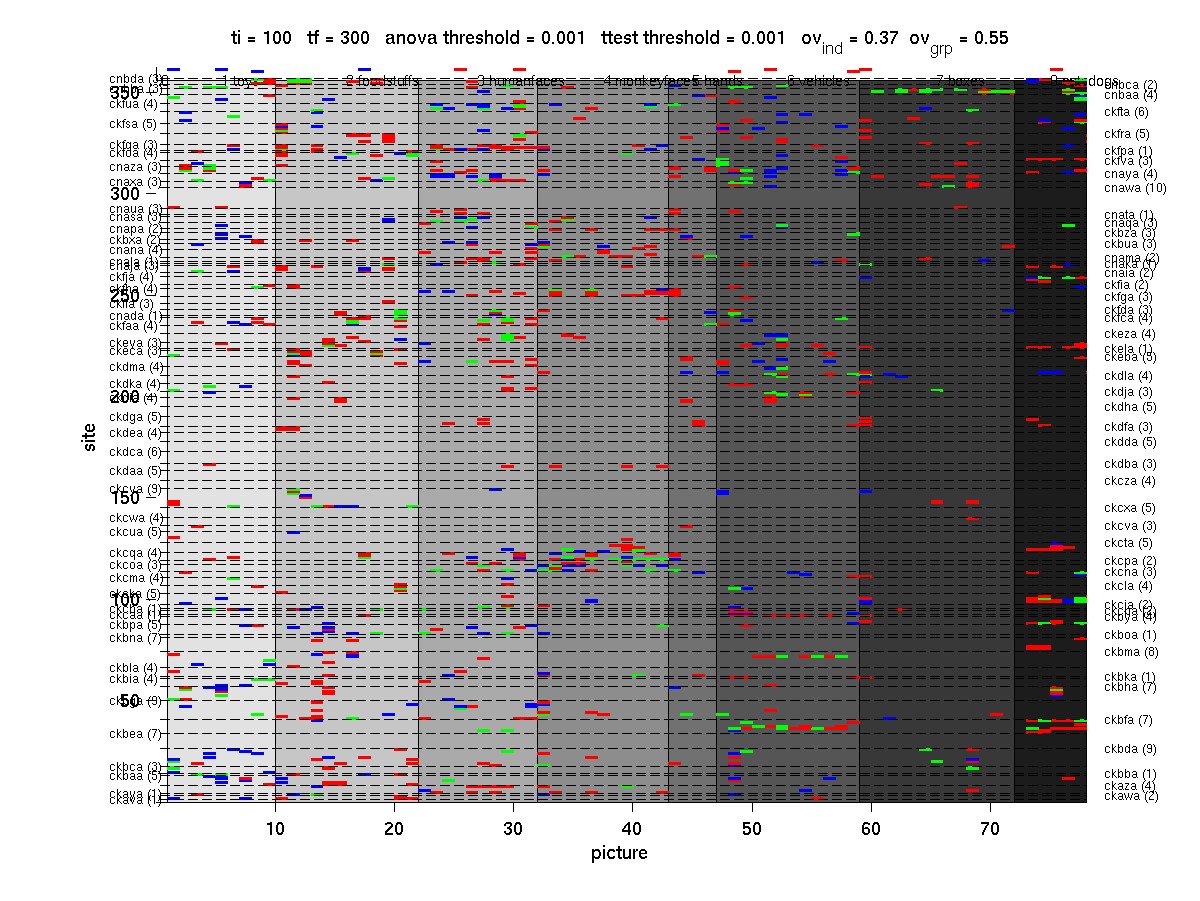
For those sites that showed ANOVA p < 0.001 and those images that passed the t test (p<0.001), we show the degree of overlap between the LFP and MUA
ov_ind = overlap in the individual images
ov_grp = overlap in the image groups
| ov_ind | ov_grp | |||||||||||
|---|---|---|---|---|---|---|---|---|---|---|---|---|
| mean | s.d. | min | max | median | n | mean | s.d. | min | max | median | n | |
| max(LFP)-min(LFP) | 0.07 | 0.14 | 0.00 | 0.67 | 0.00 | 106 | 0.26 | 0.25 | 0.00 | 1.00 | 0.25 | 106 |
| msa power | 0.05 | 0.13 | 0.00 | 0.60 | 0.00 | 97 | 0.22 | 0.26 | 0.00 | 1.00 | 0.20 | 97 |
| [0;10) Hz | 0.02 | 0.06 | 0.00 | 0.33 | 0.00 | 104 | 0.15 | 0.21 | 0.00 | 1.00 | 0.00 | 104 |
| [10;20) Hz | 0.03 | 0.08 | 0.00 | 0.50 | 0.00 | 91 | 0.20 | 0.24 | 0.00 | 1.00 | 0.20 | 91 |
| [20;30) Hz | 0.00 | 0.00 | 0.00 | 0.00 | 0.00 | 18 | 0.10 | 0.18 | 0.00 | 0.50 | 0.00 | 18 |
| [30;40) Hz | 0.03 | 0.09 | 0.00 | 0.33 | 0.00 | 13 | 0.20 | 0.24 | 0.00 | 0.67 | 0.00 | 13 |
| [40;100) Hz | 0.19 | 0.24 | 0.00 | 1.00 | 0.04 | 34 | 0.44 | 0.40 | 0.00 | 1.00 | 0.50 | 34 |
| [100;300) Hz | 0.37 | 0.27 | 0.00 | 1.00 | 0.40 | 140 | 0.55 | 0.30 | 0.00 | 1.00 | 0.50 | 140 |
| p threshold | |
|---|---|
| 1 | 0.010000 |
| 2 | 0.001000 |
| 3 | 0.000100 |
| 4 | 0.000010 |