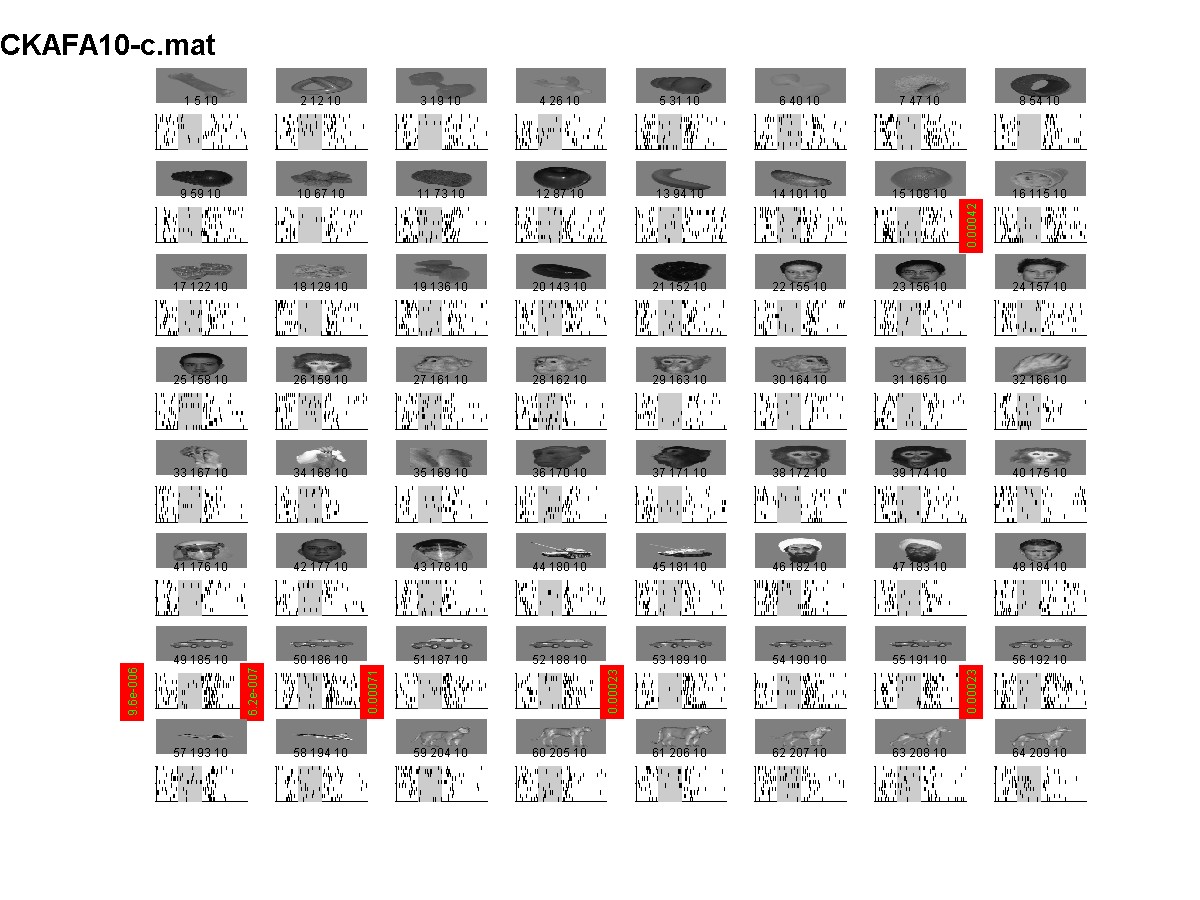
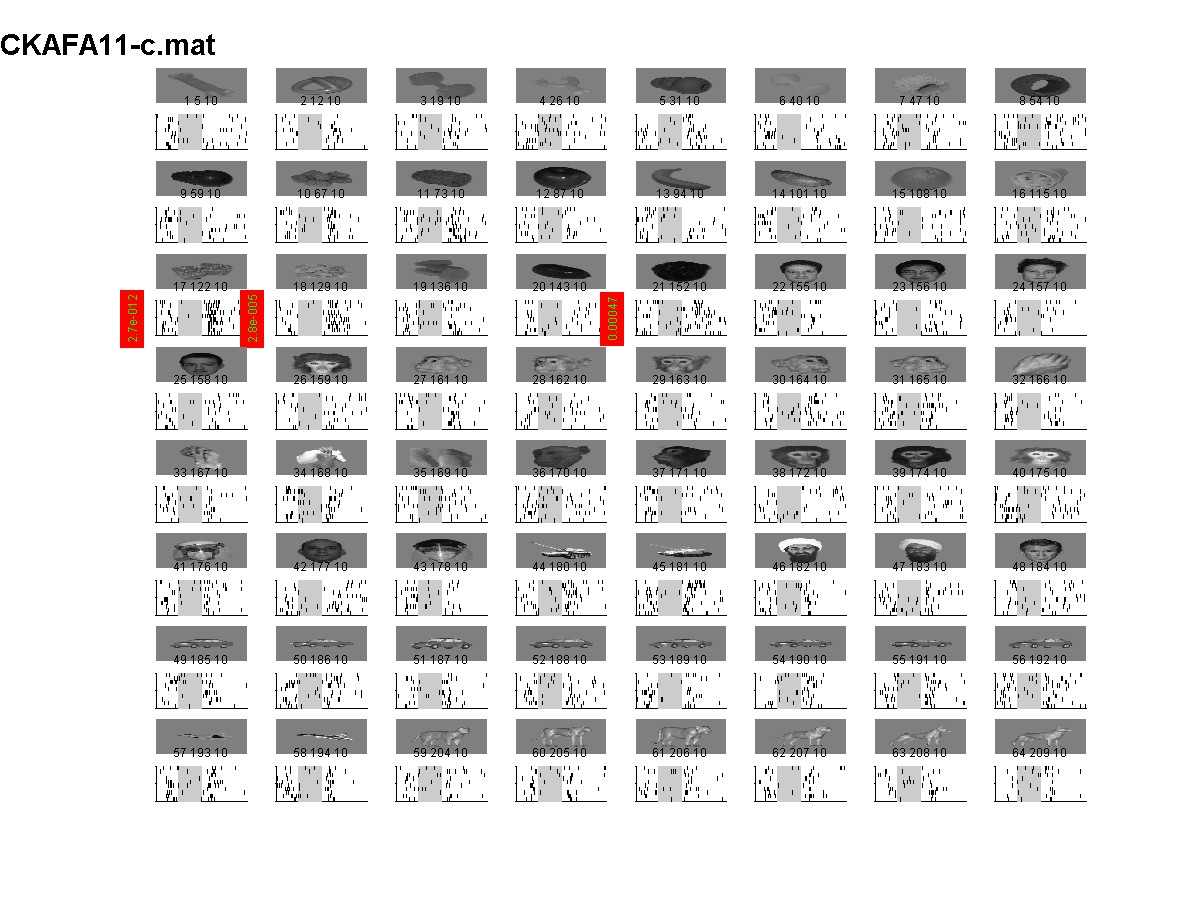
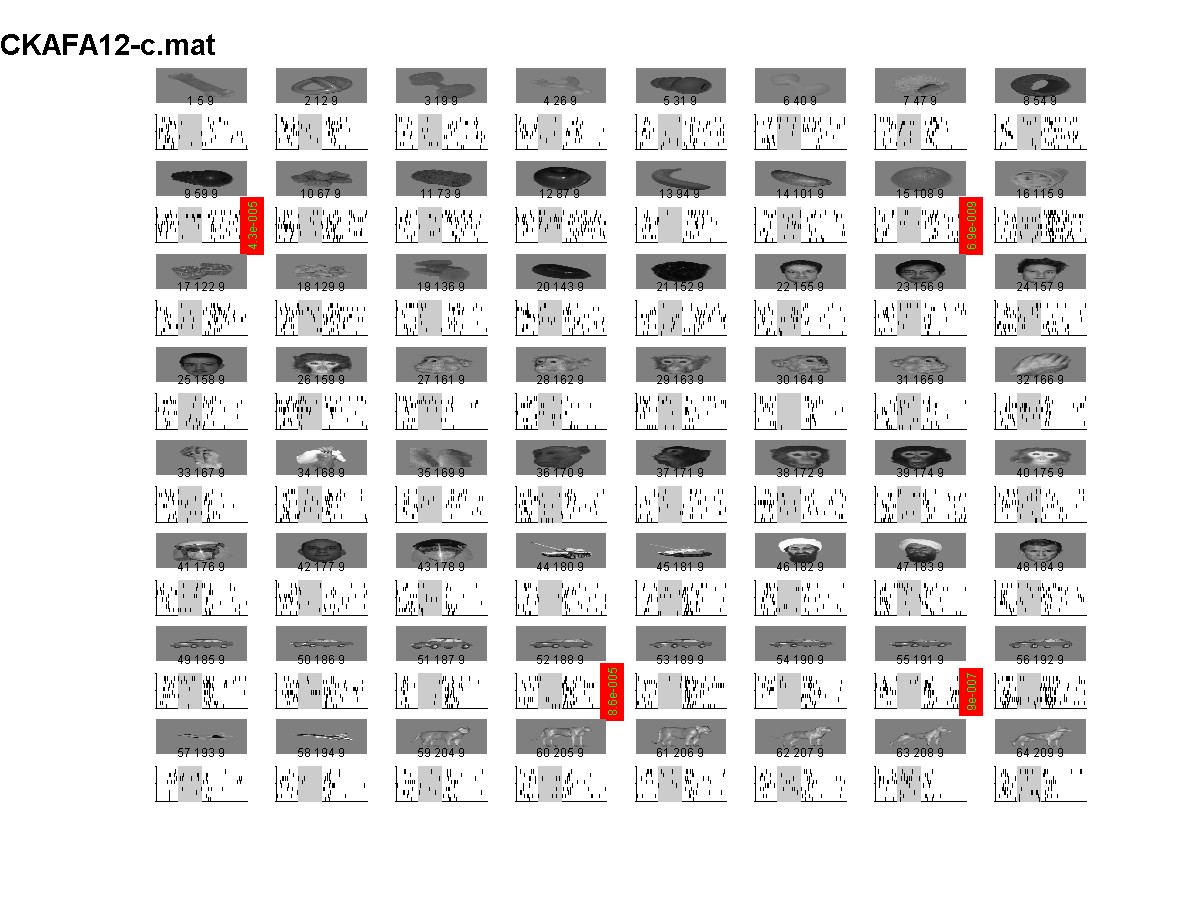
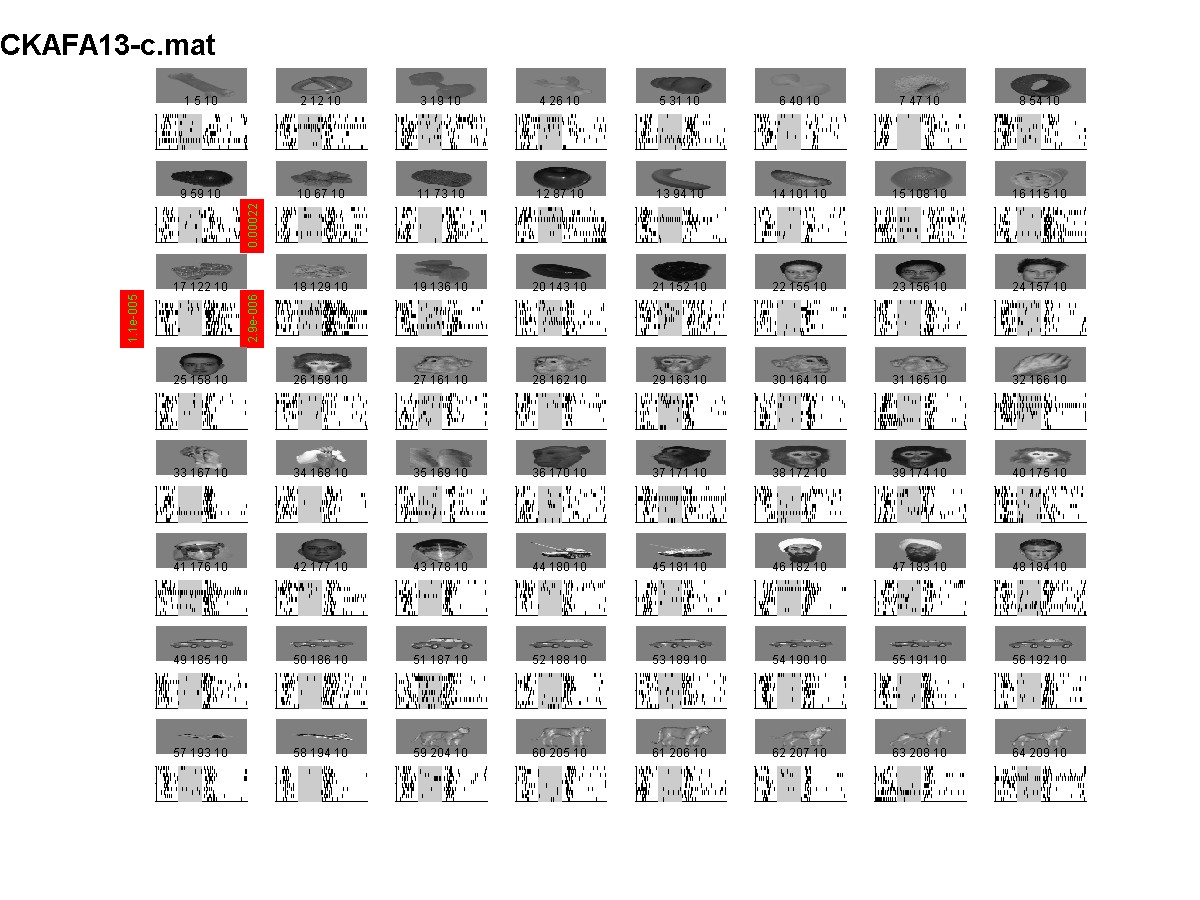
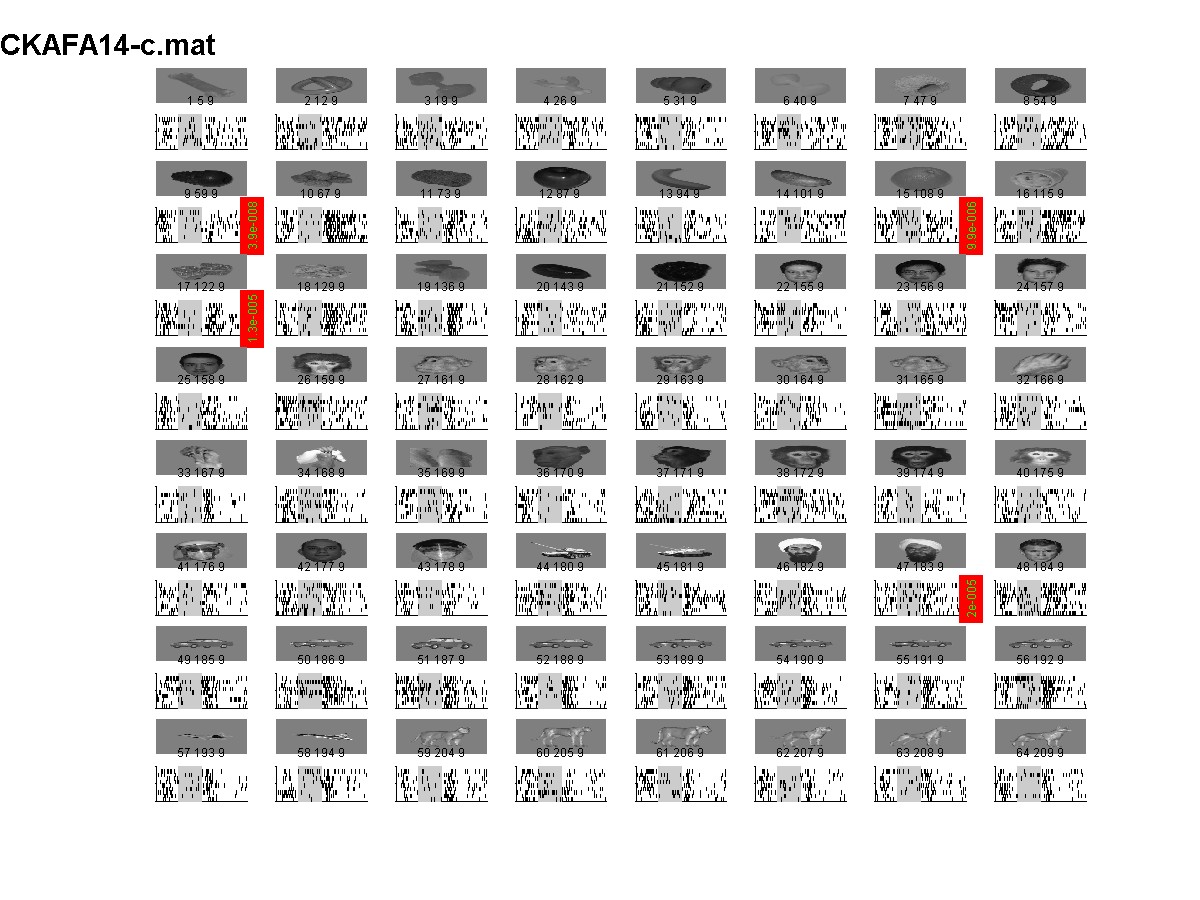
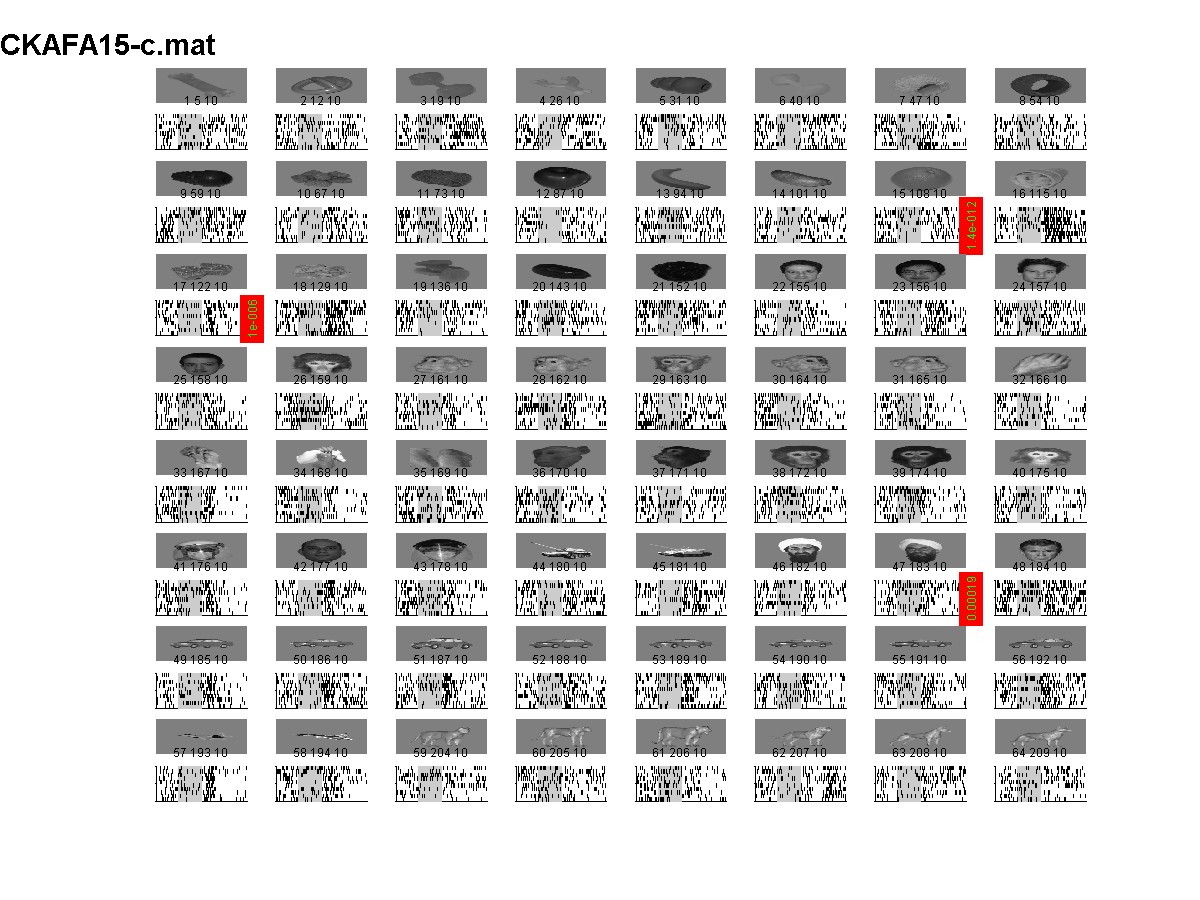
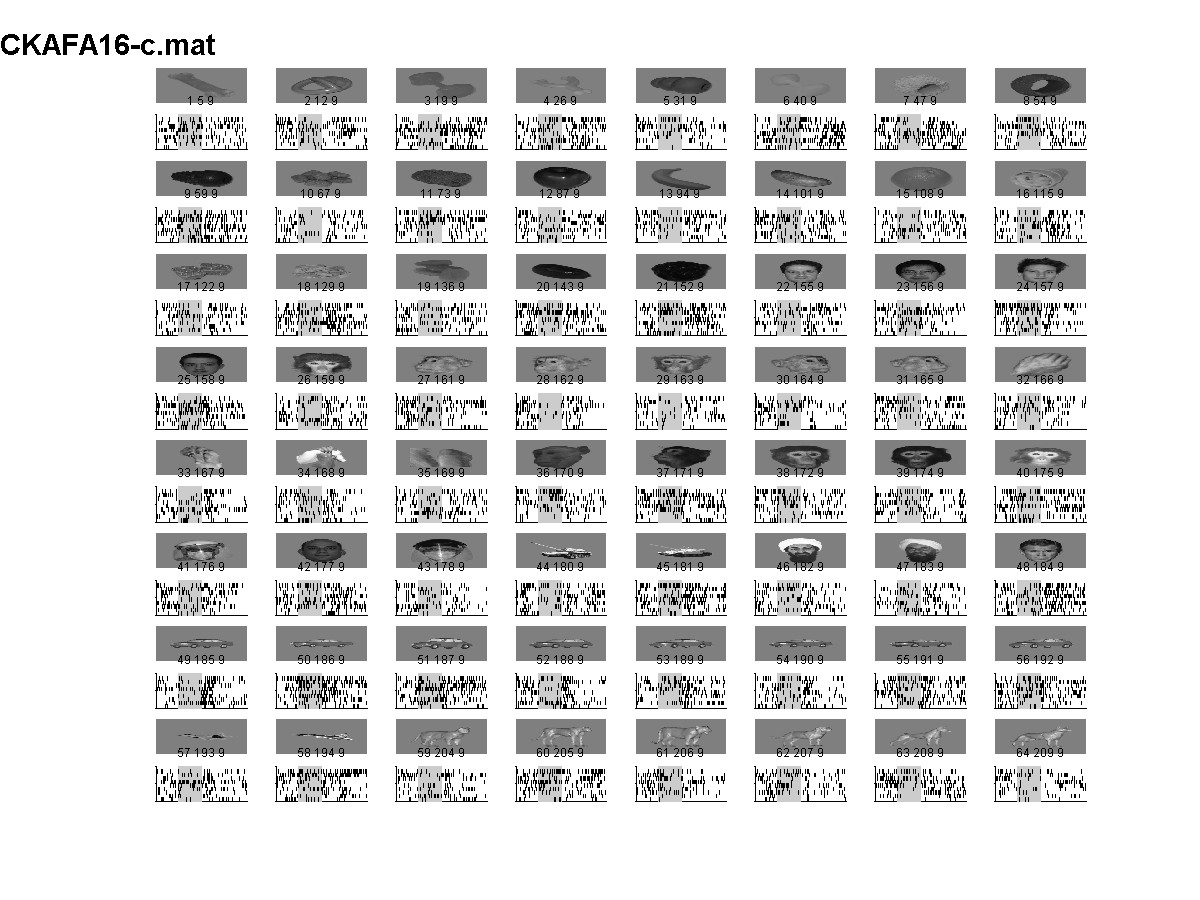
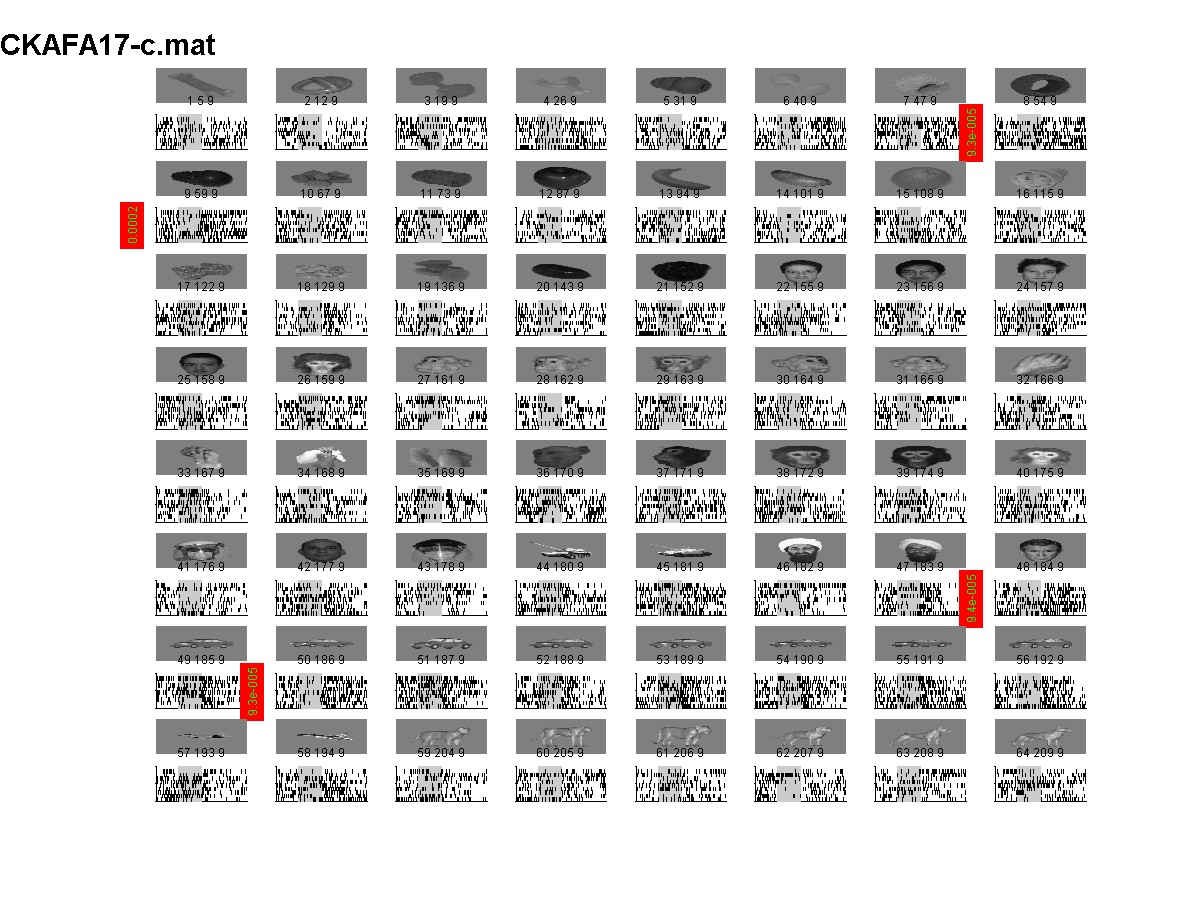
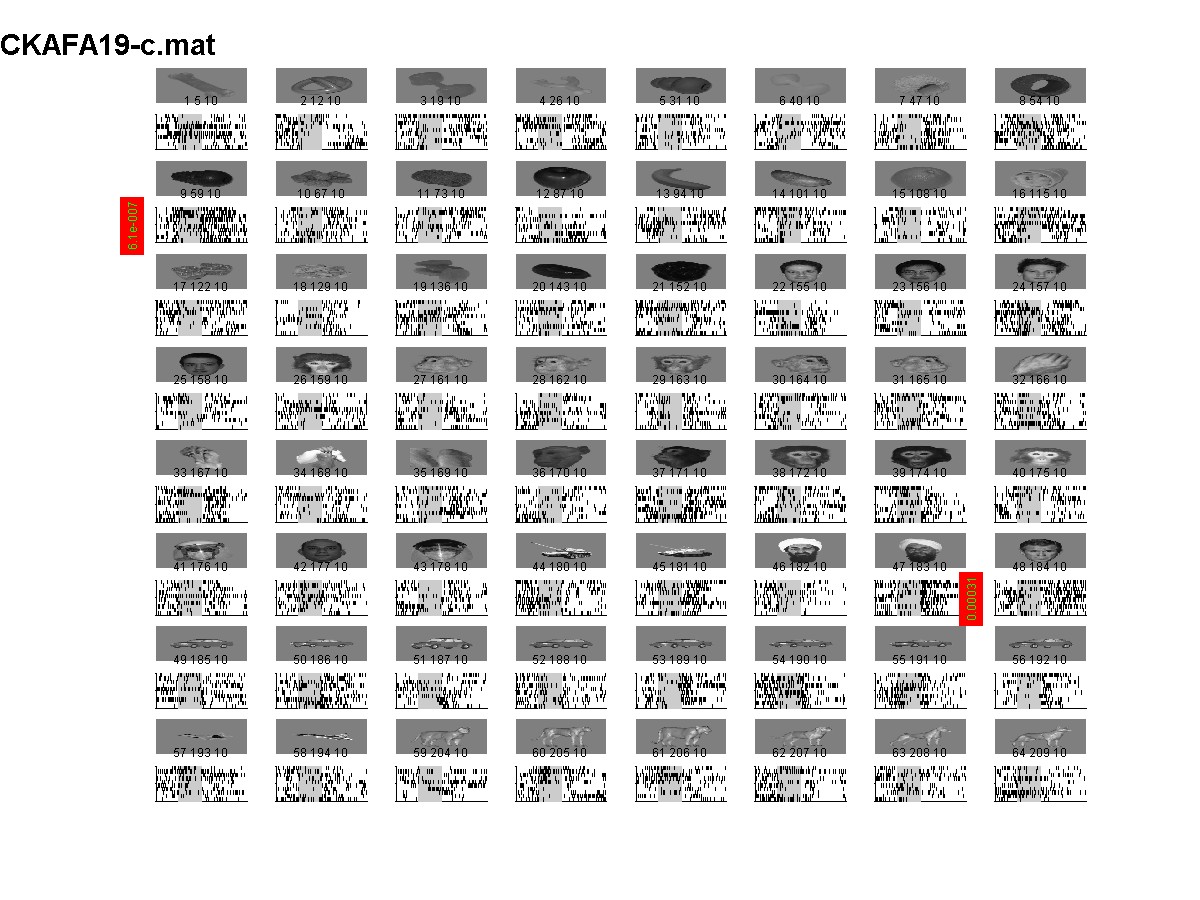
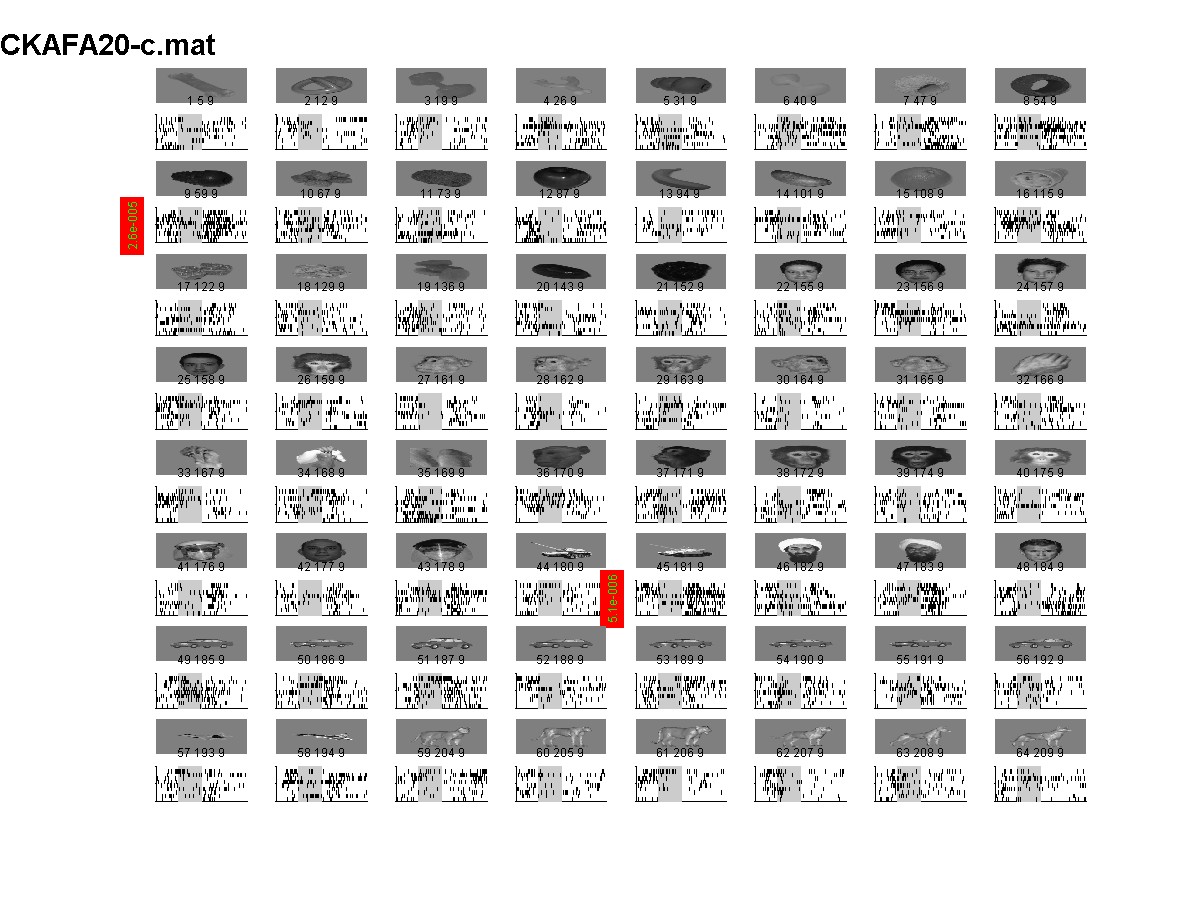
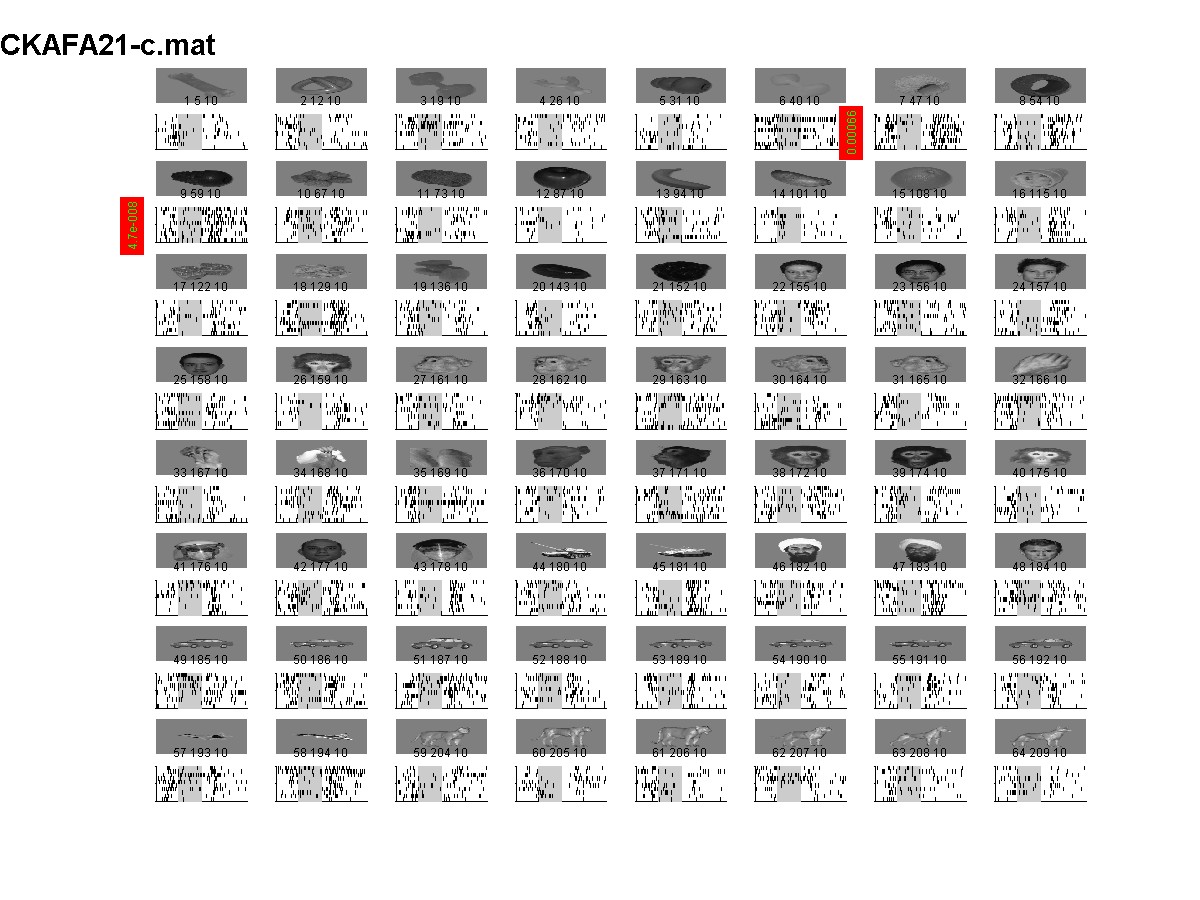
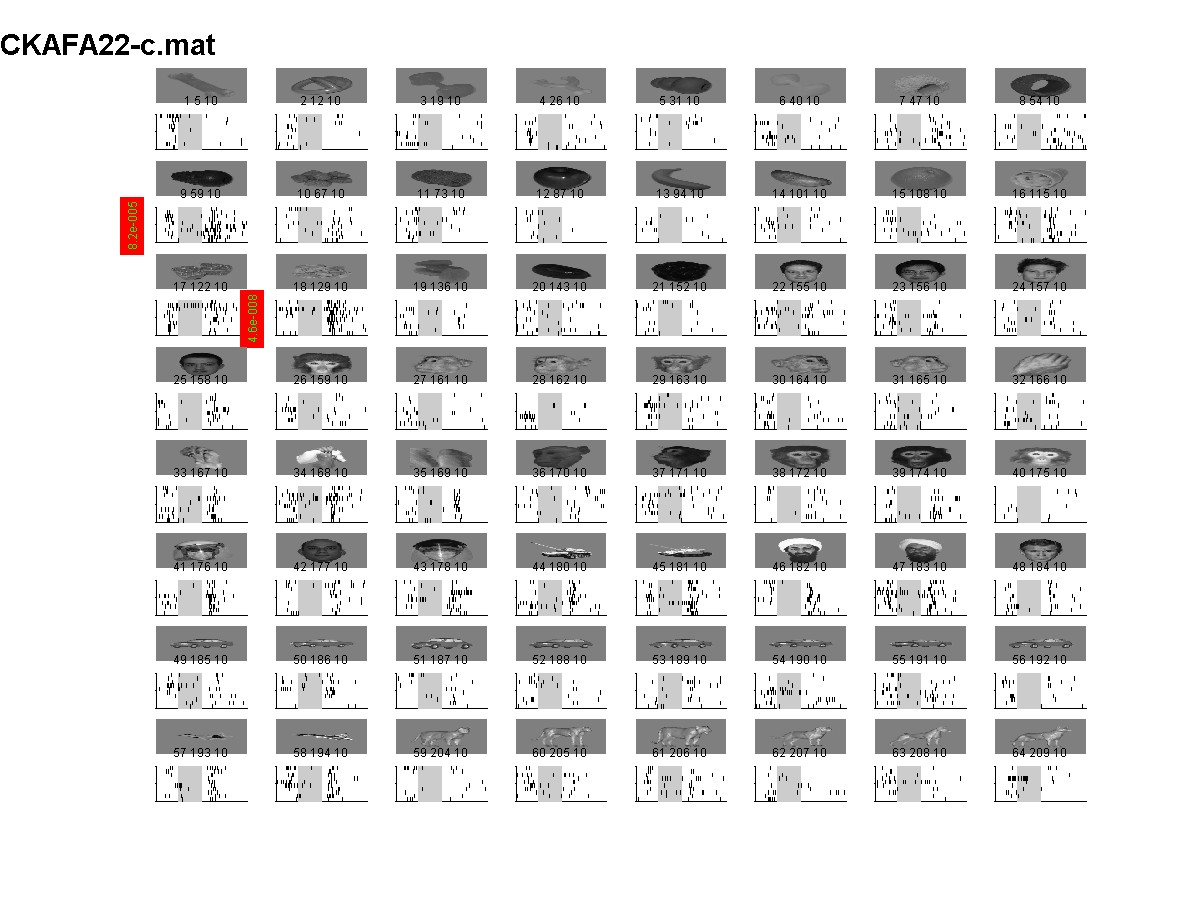
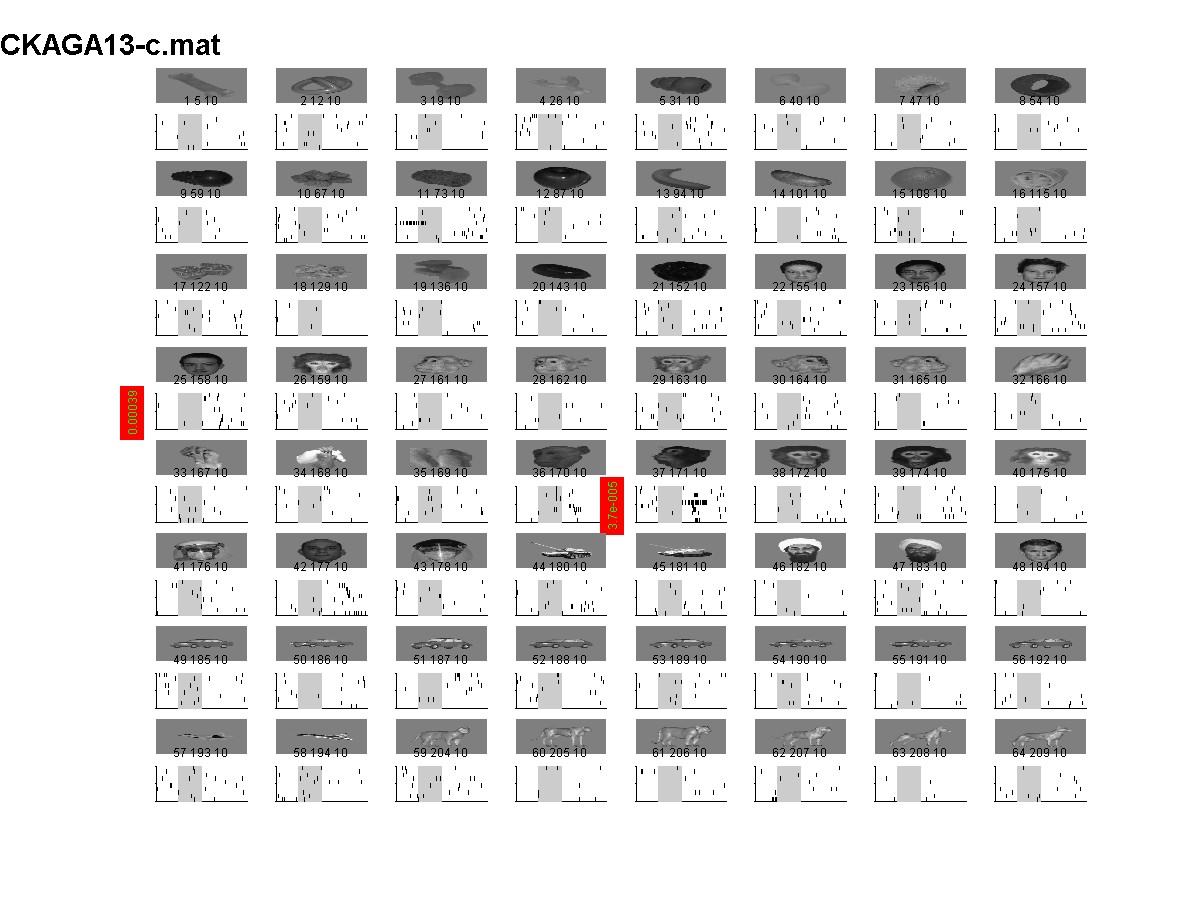
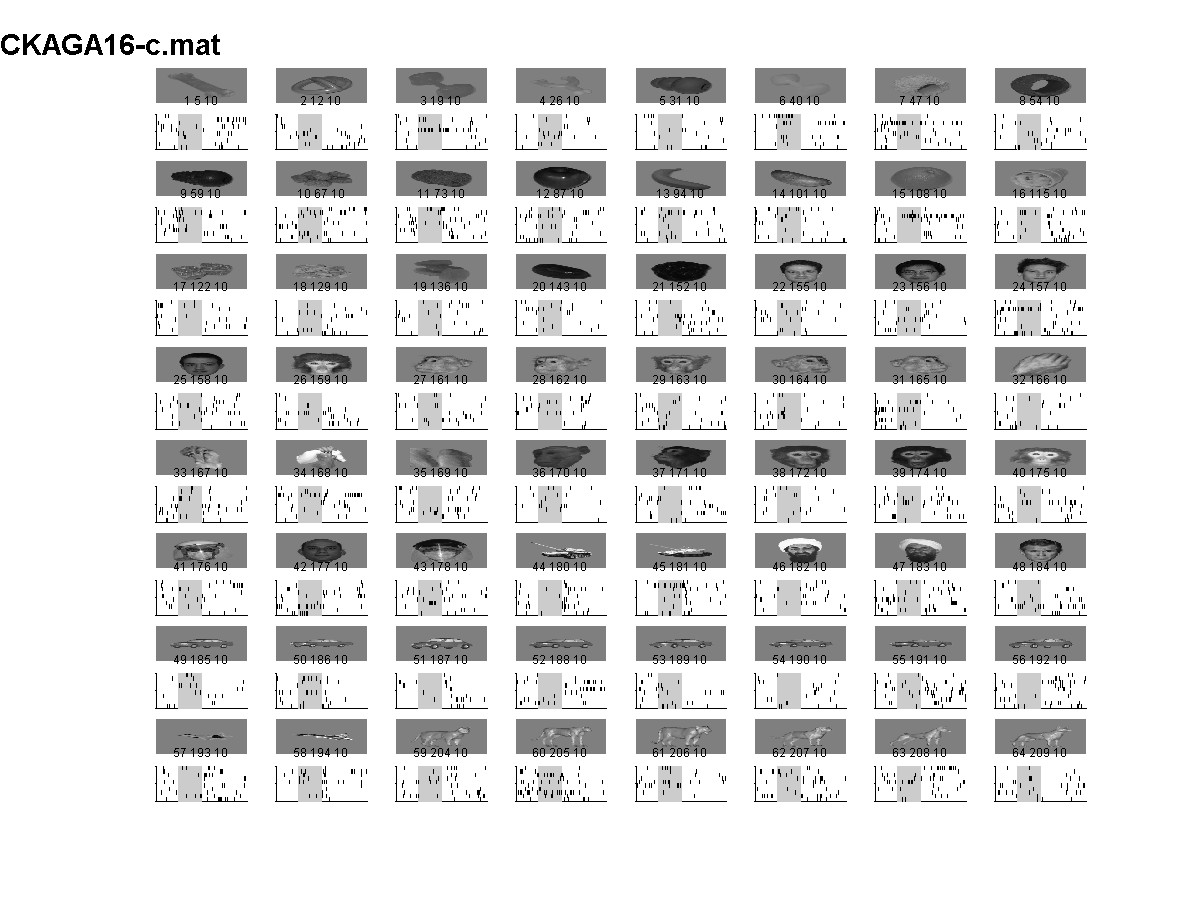
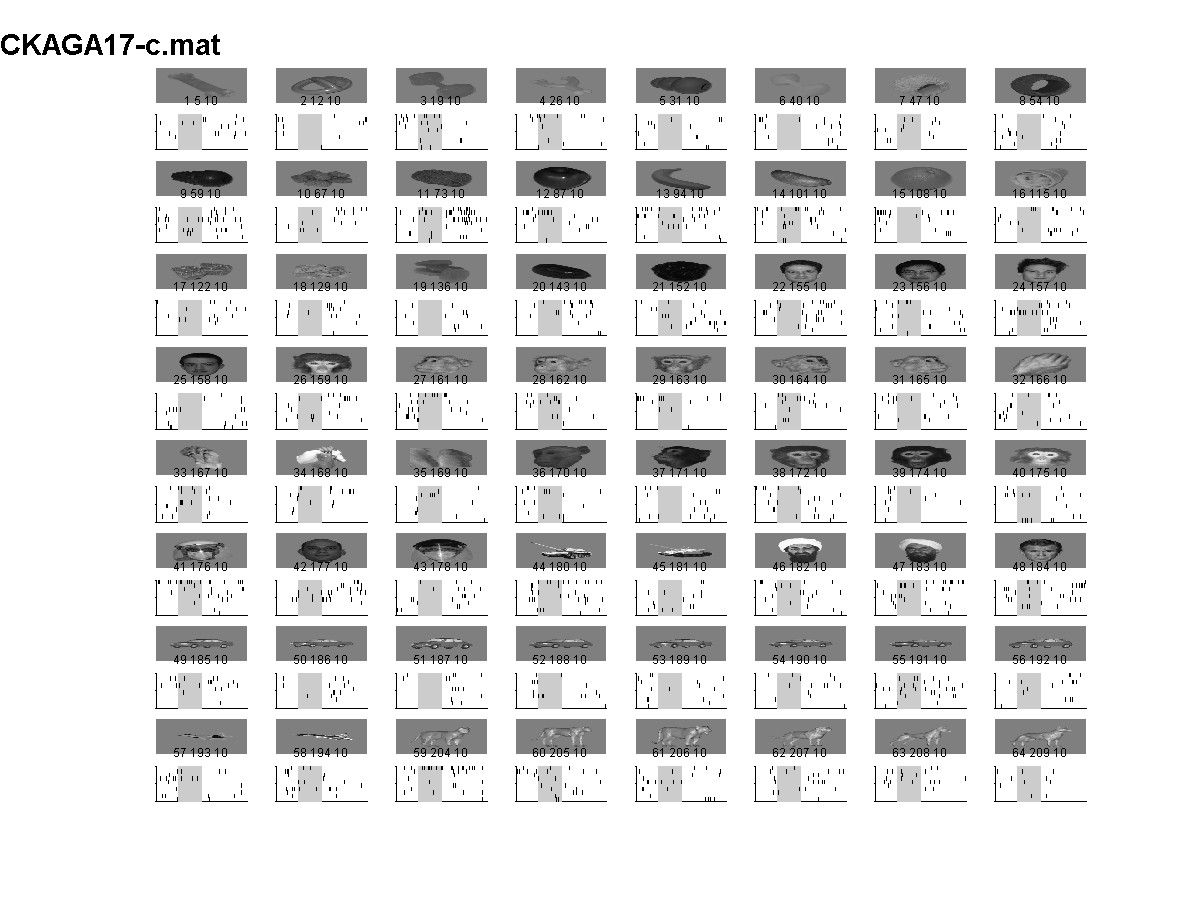
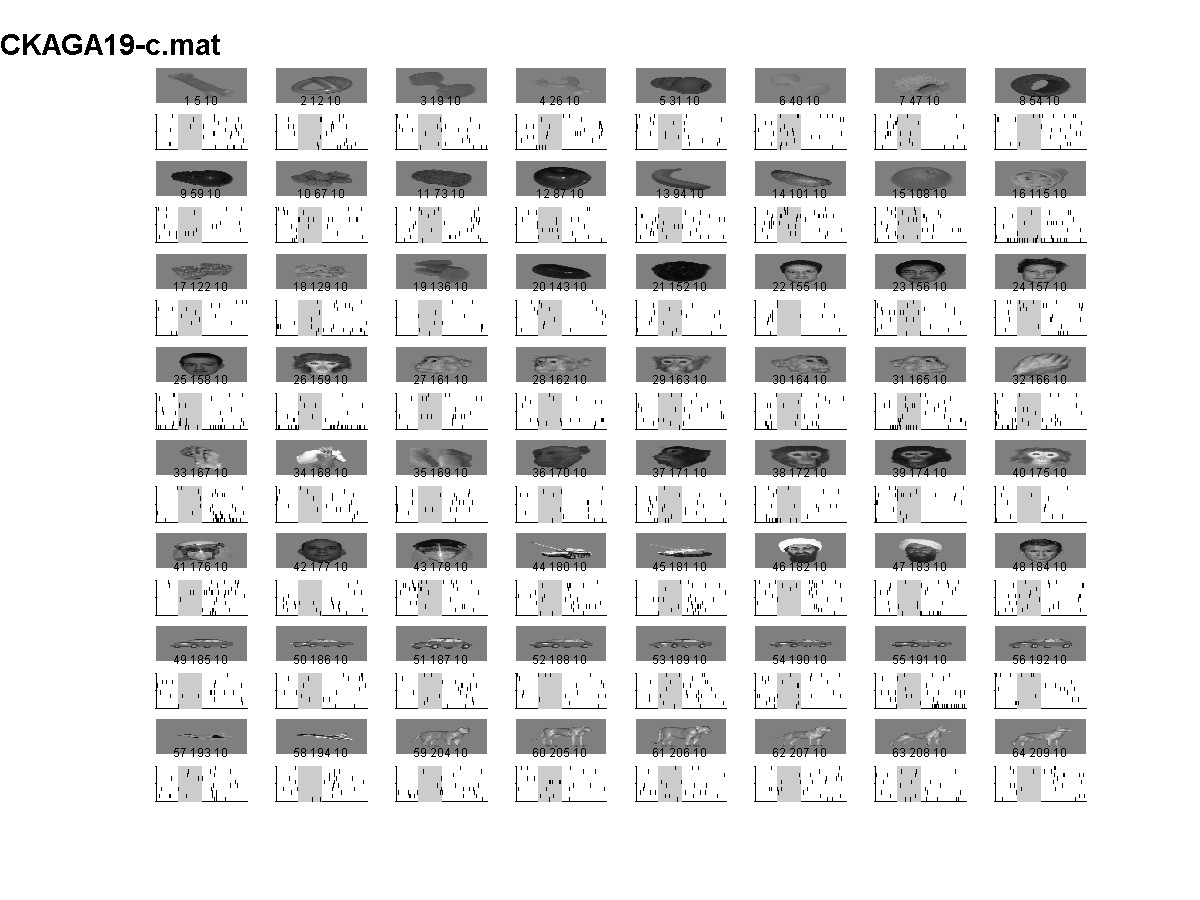
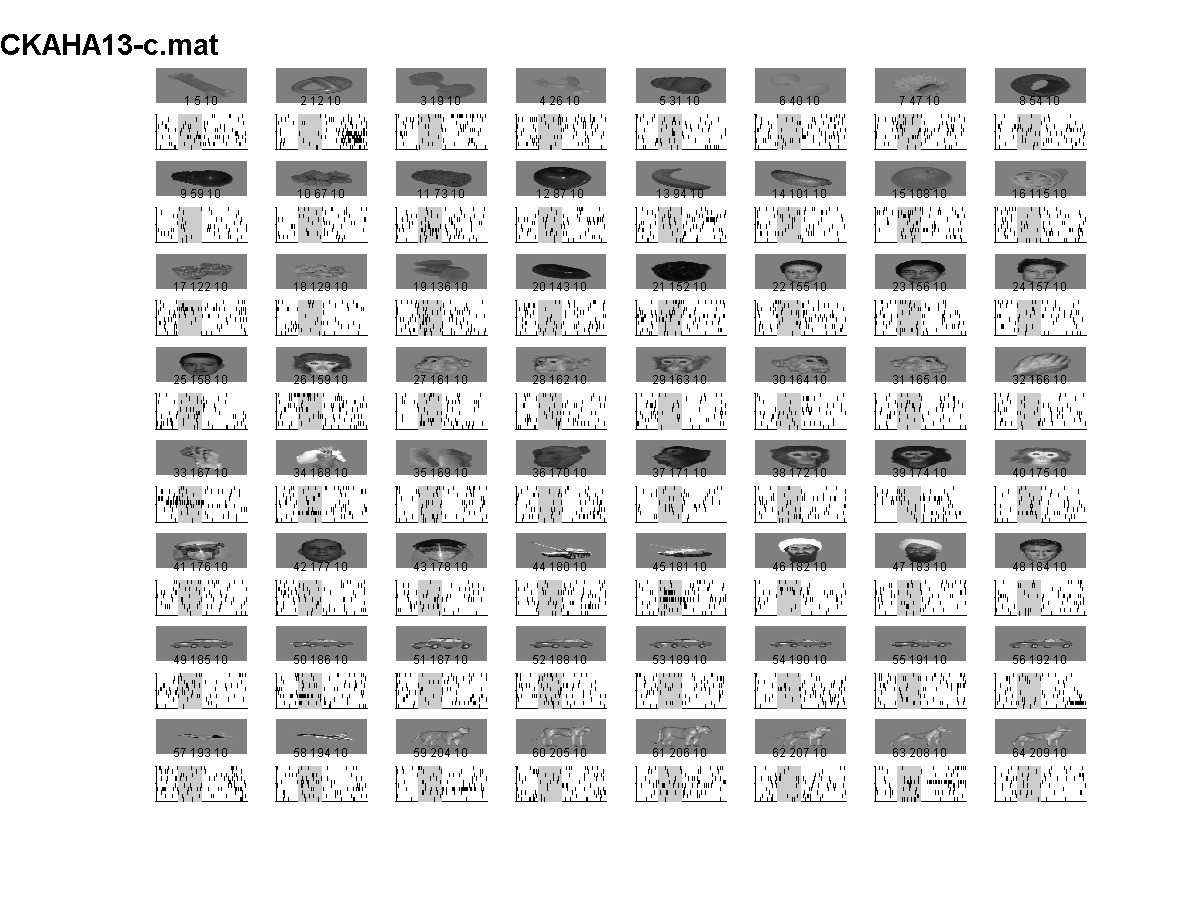
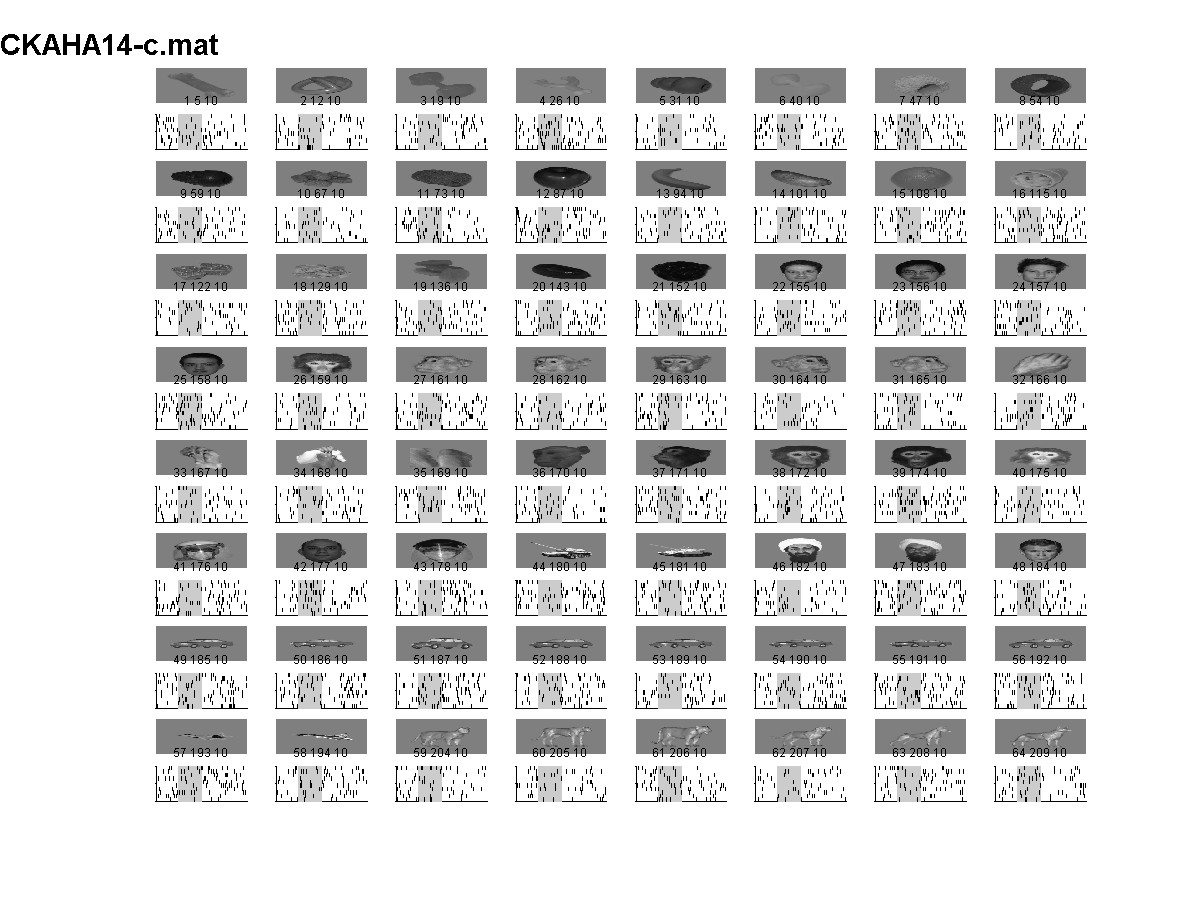
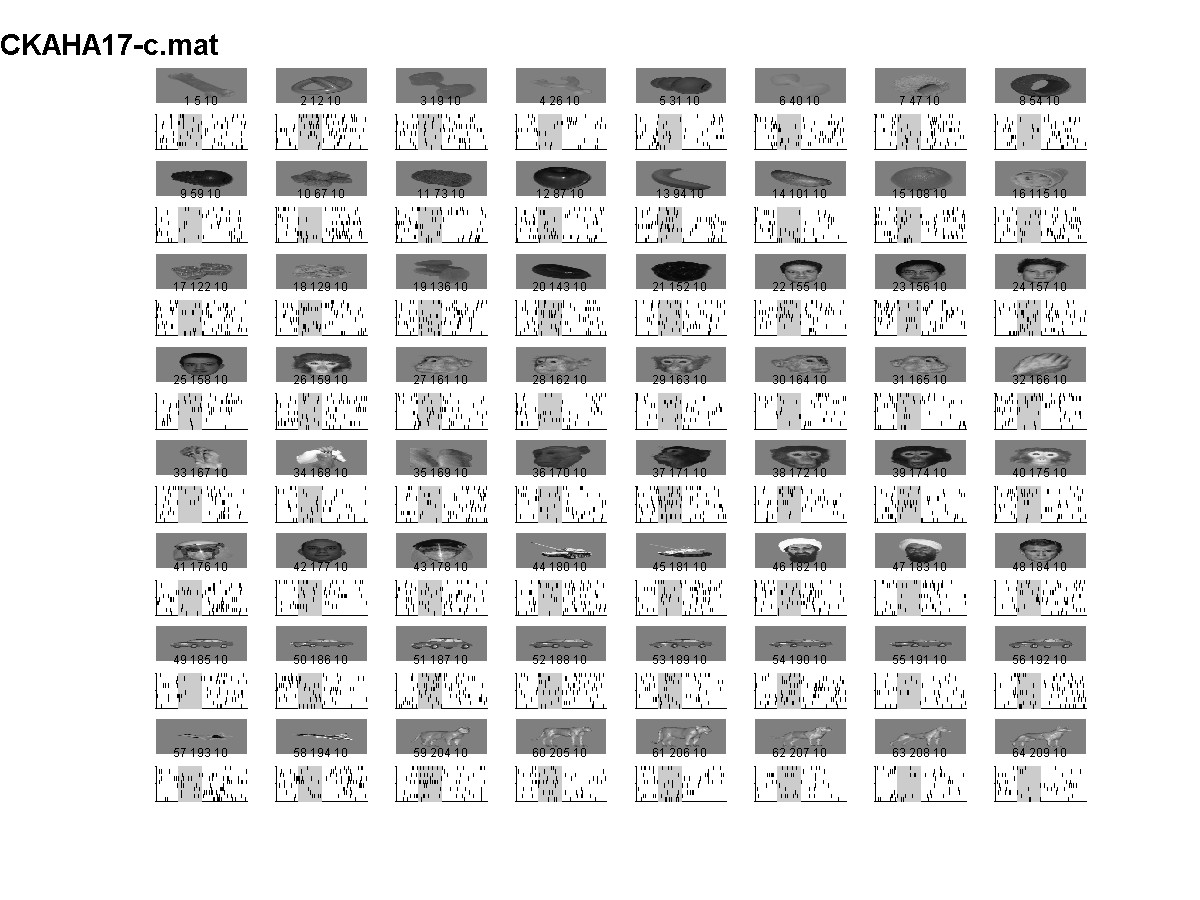
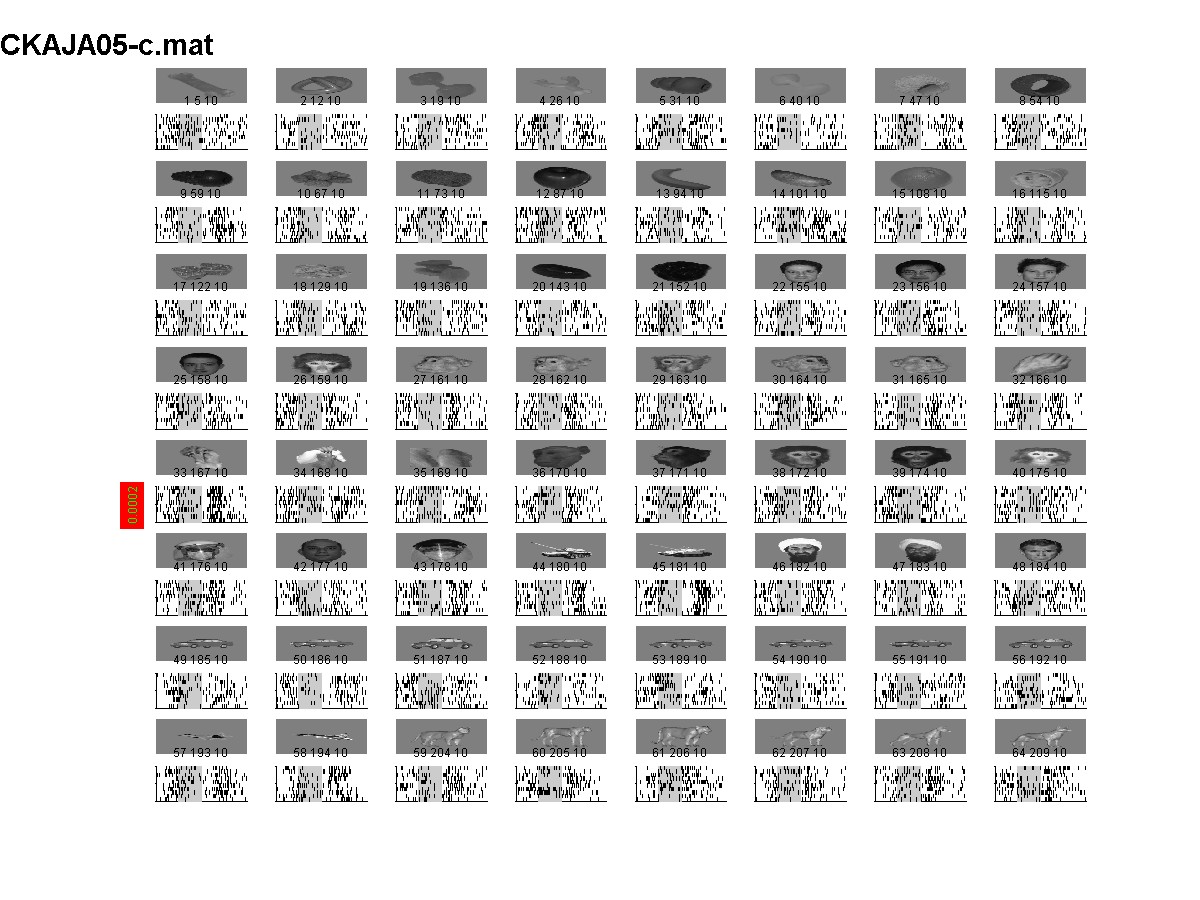
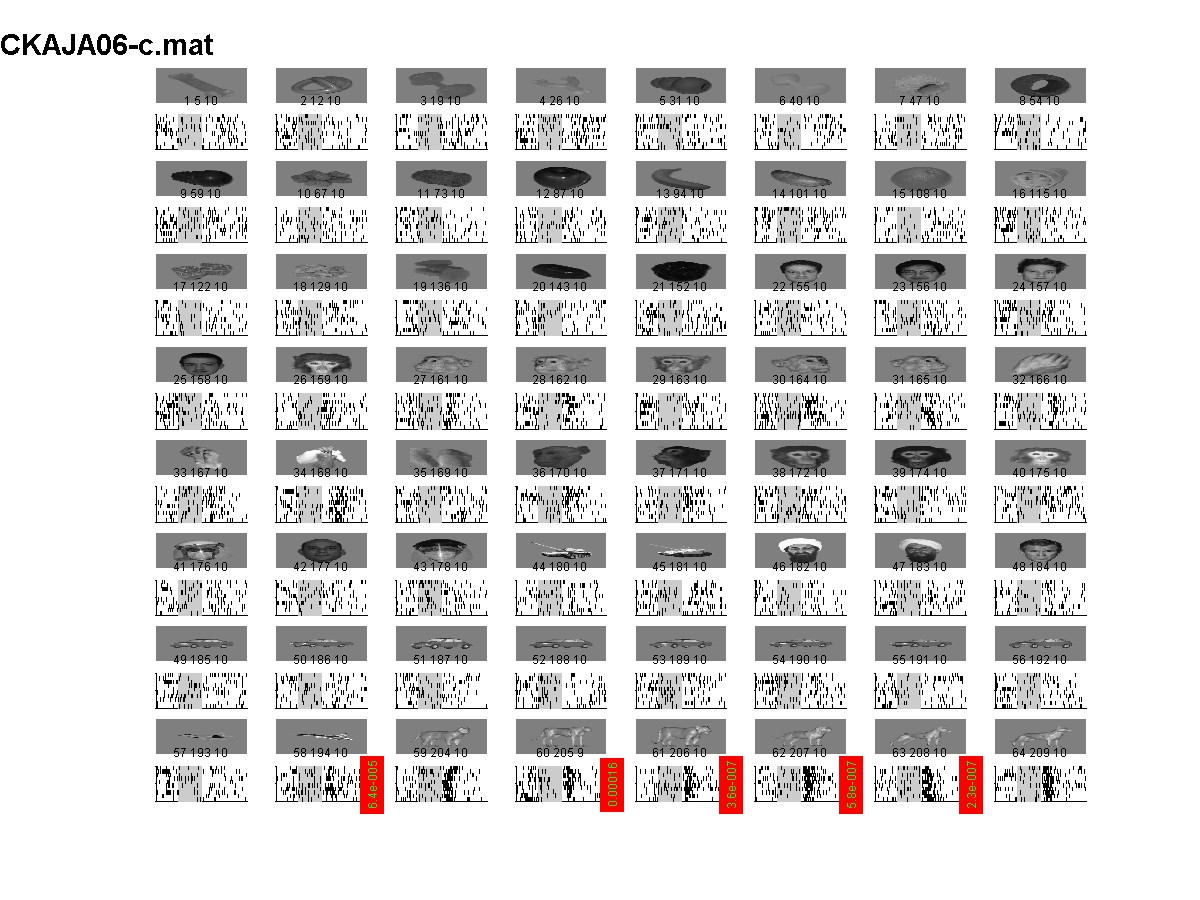
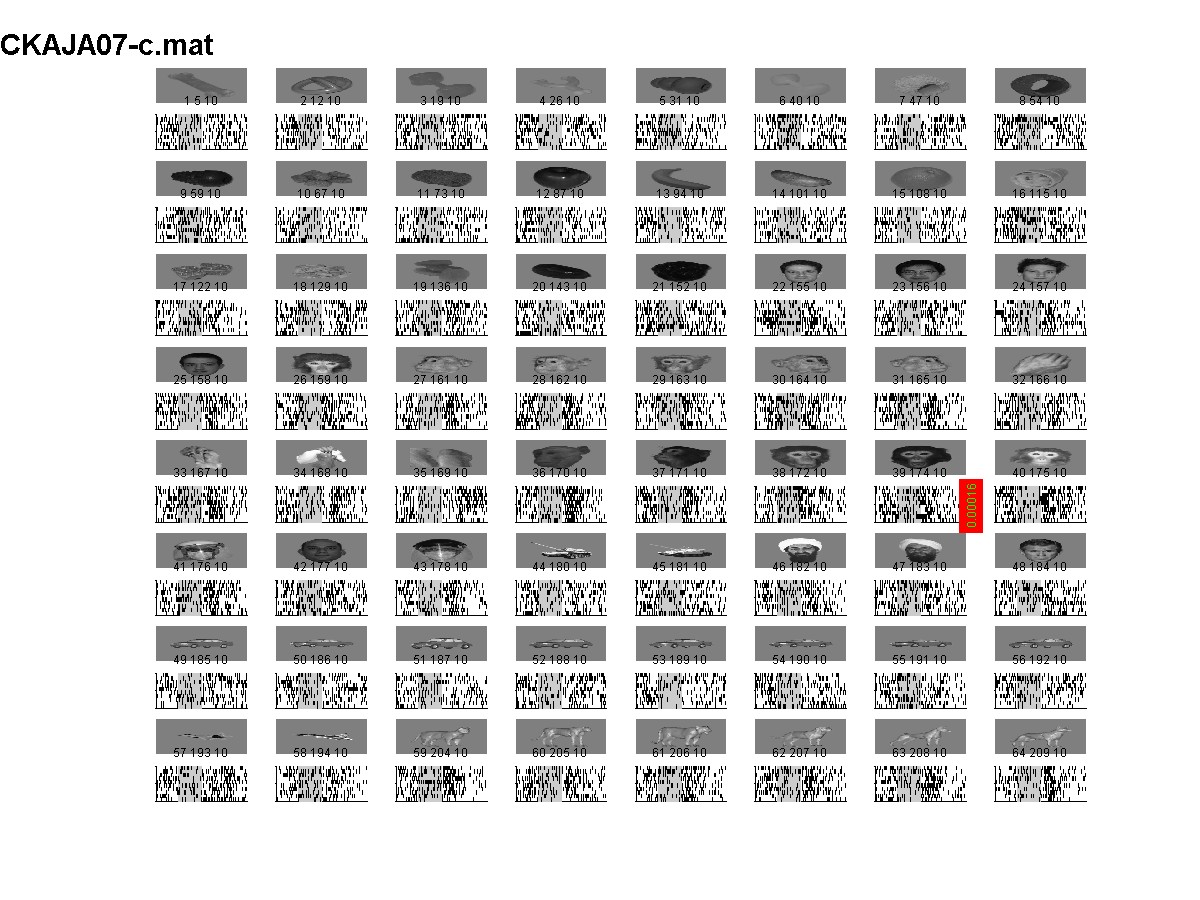
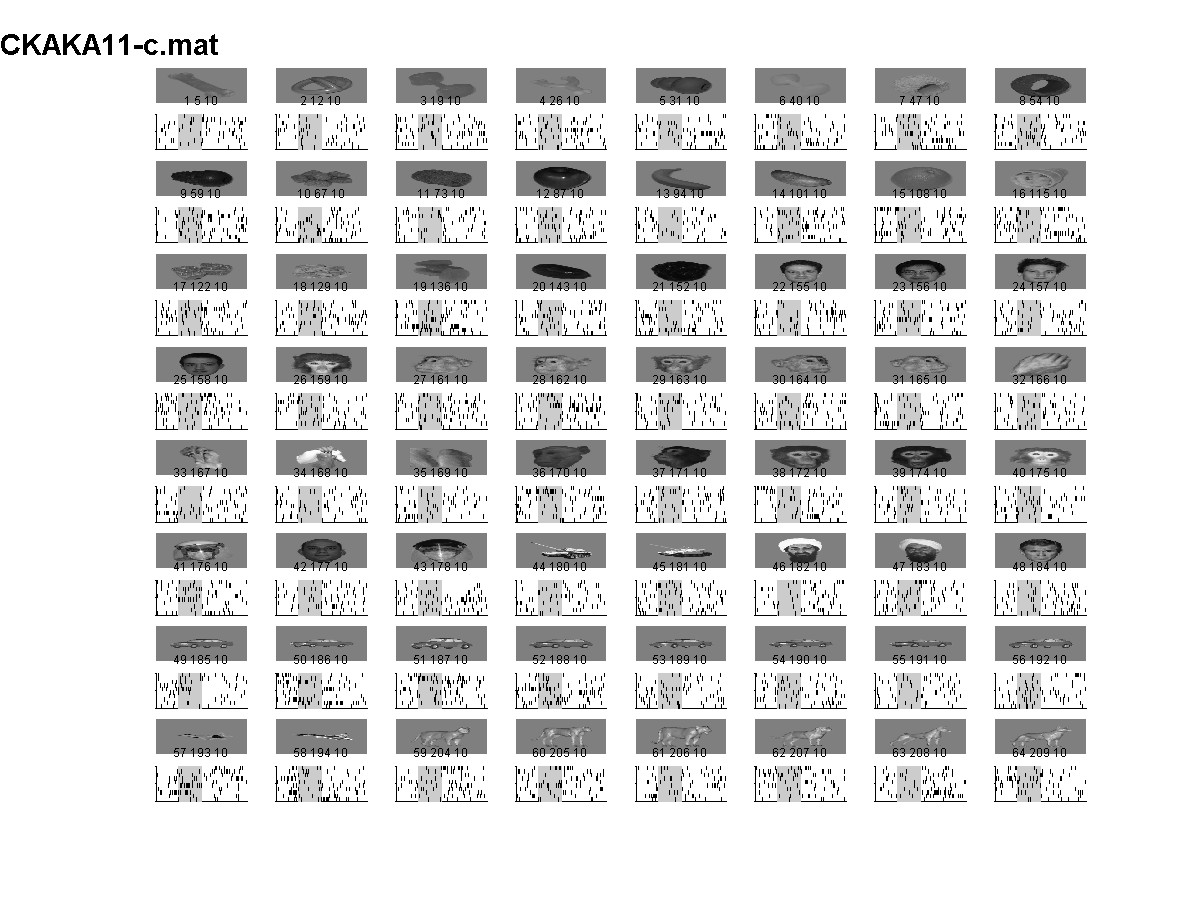
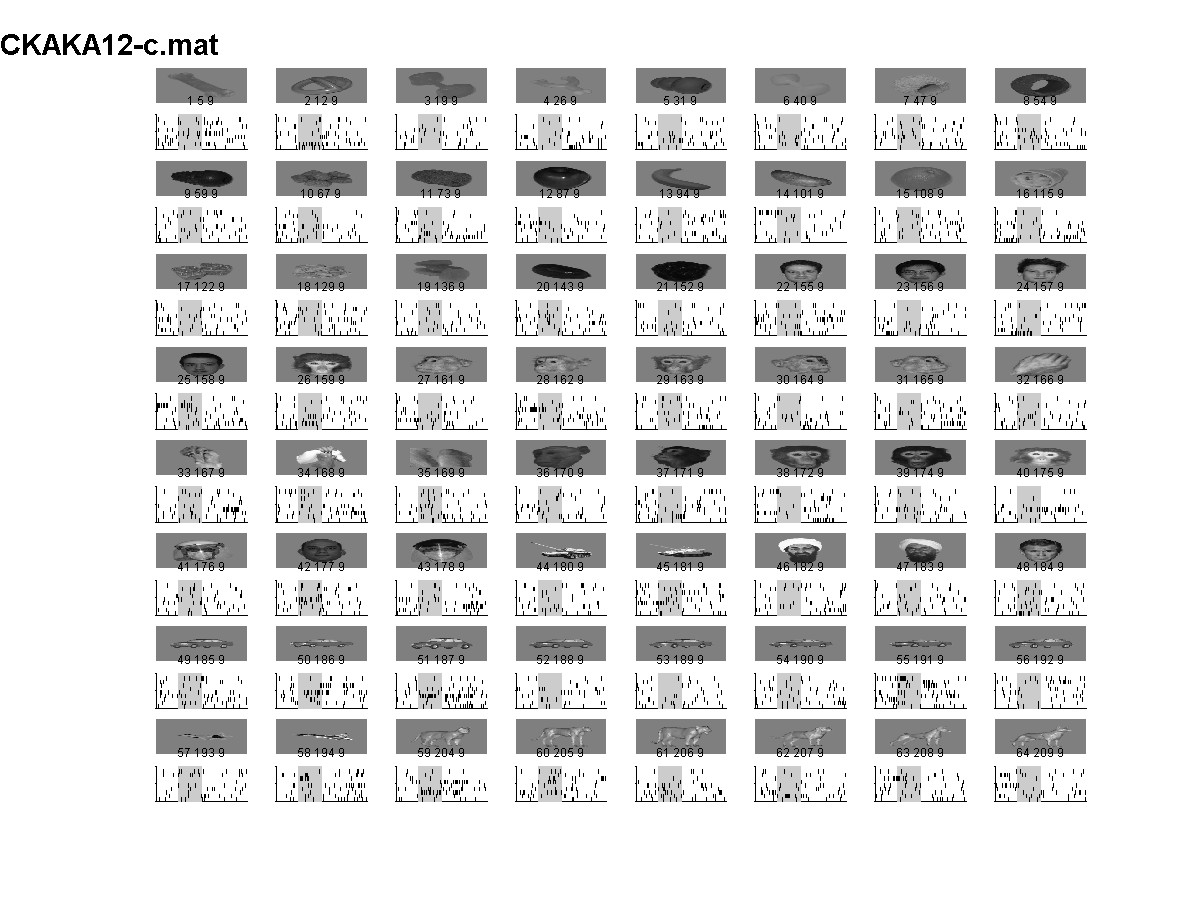
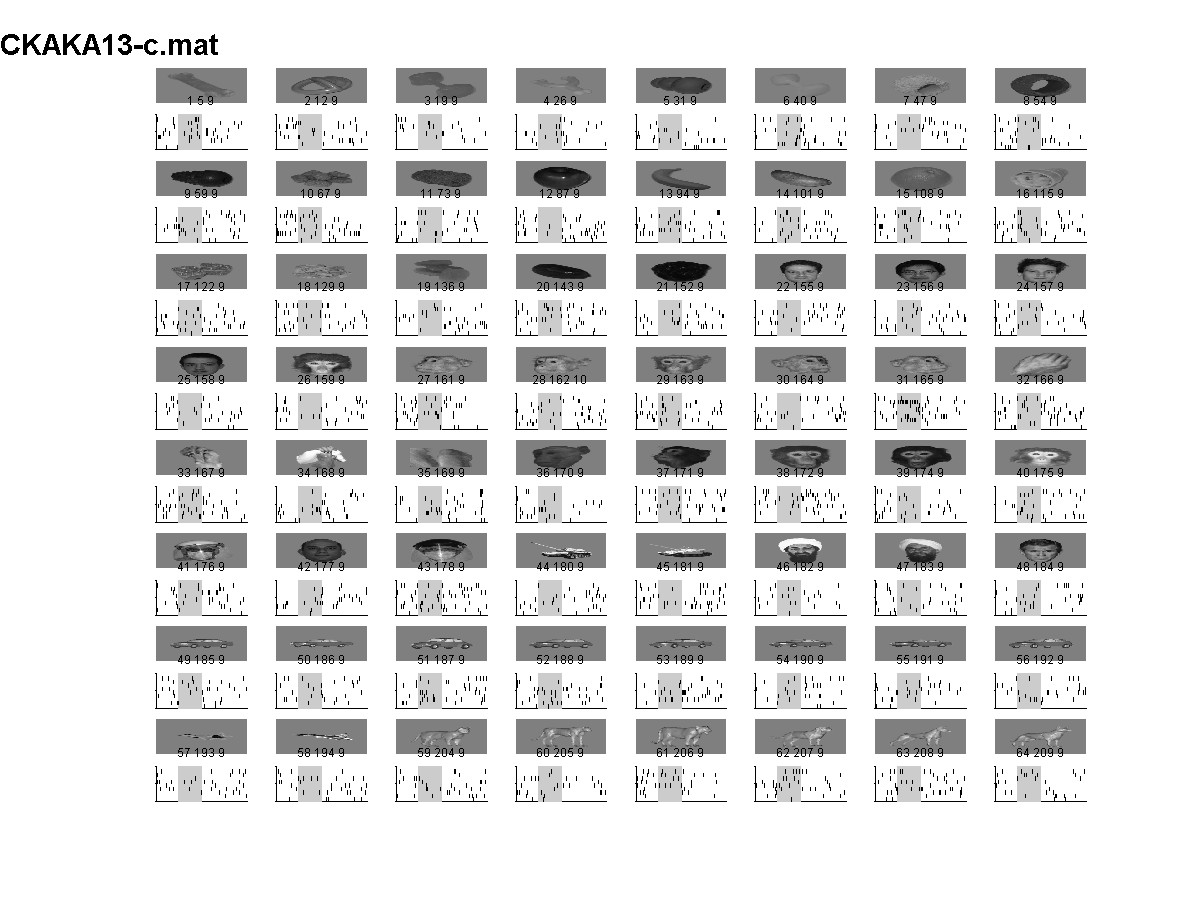
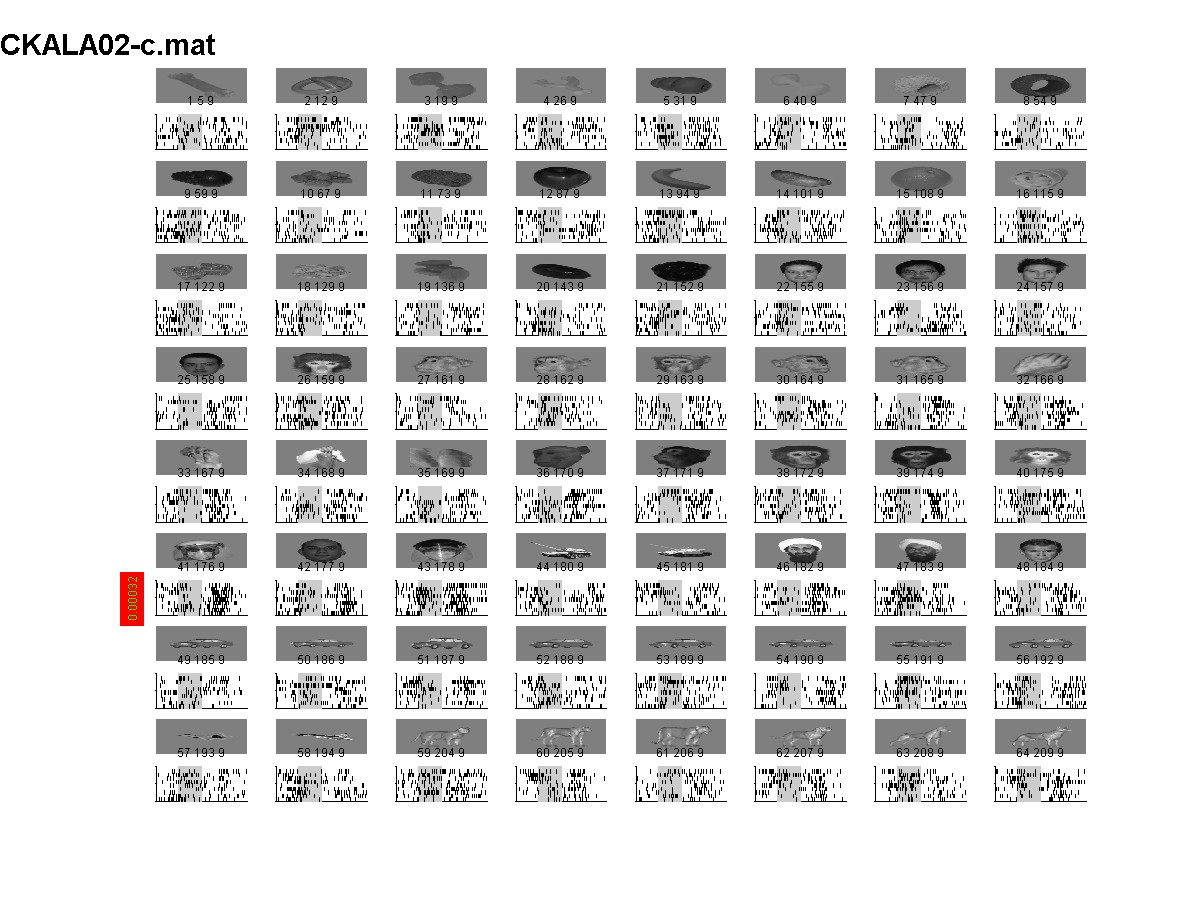
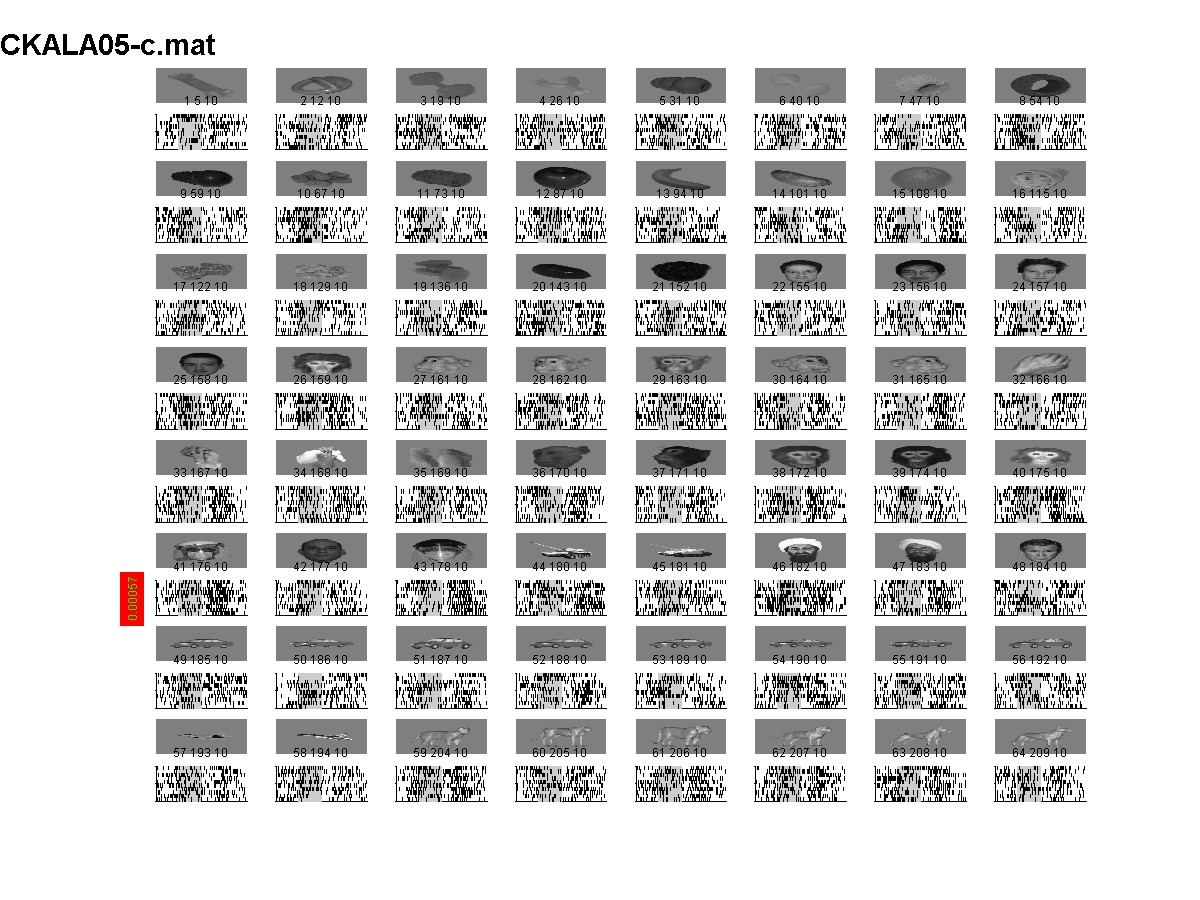
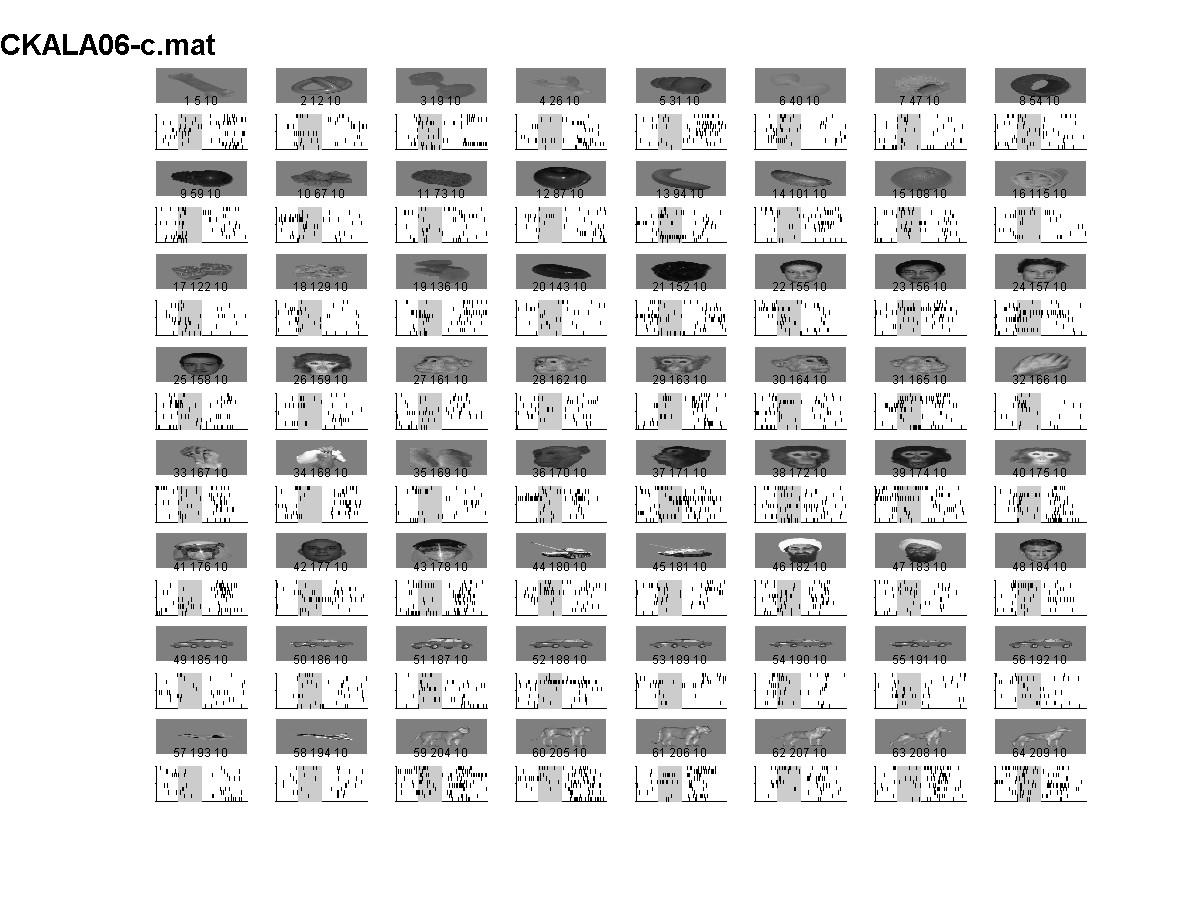
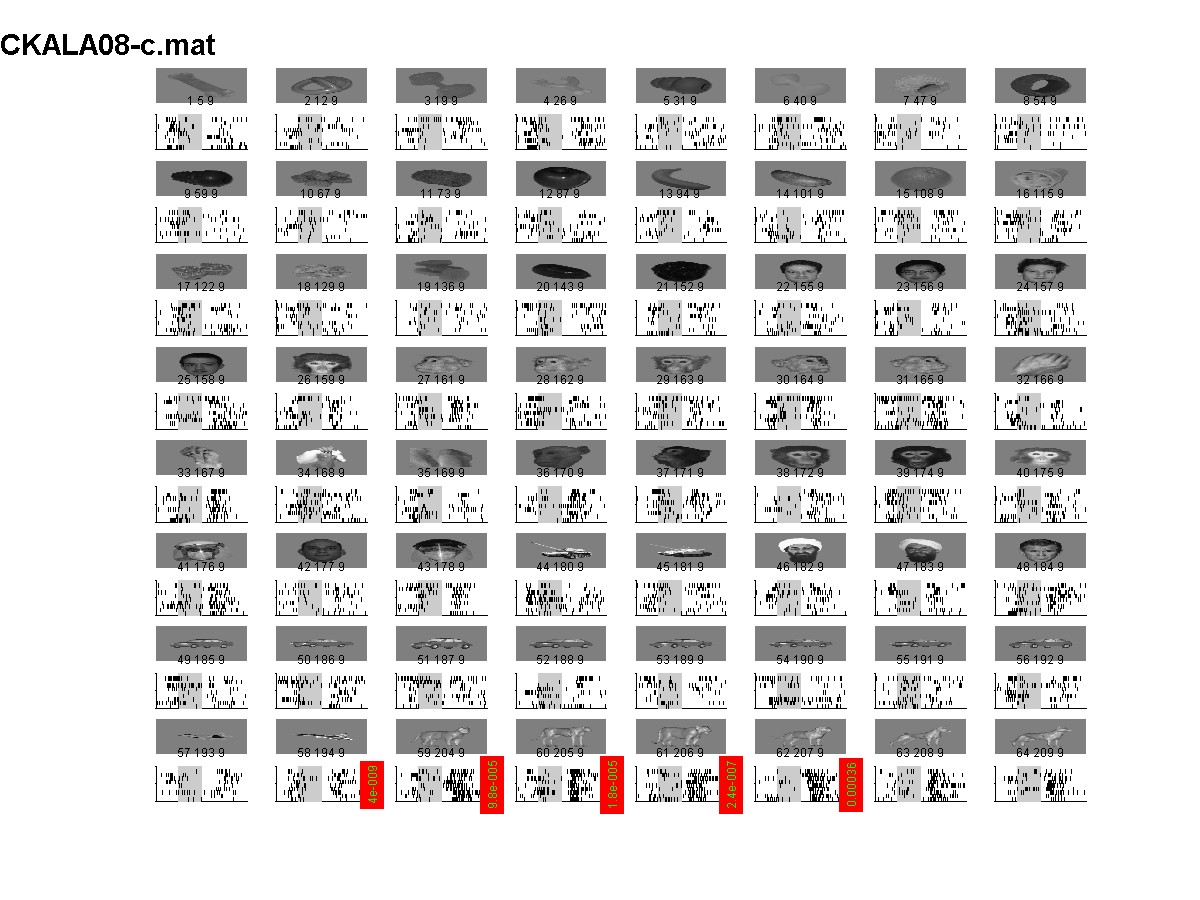
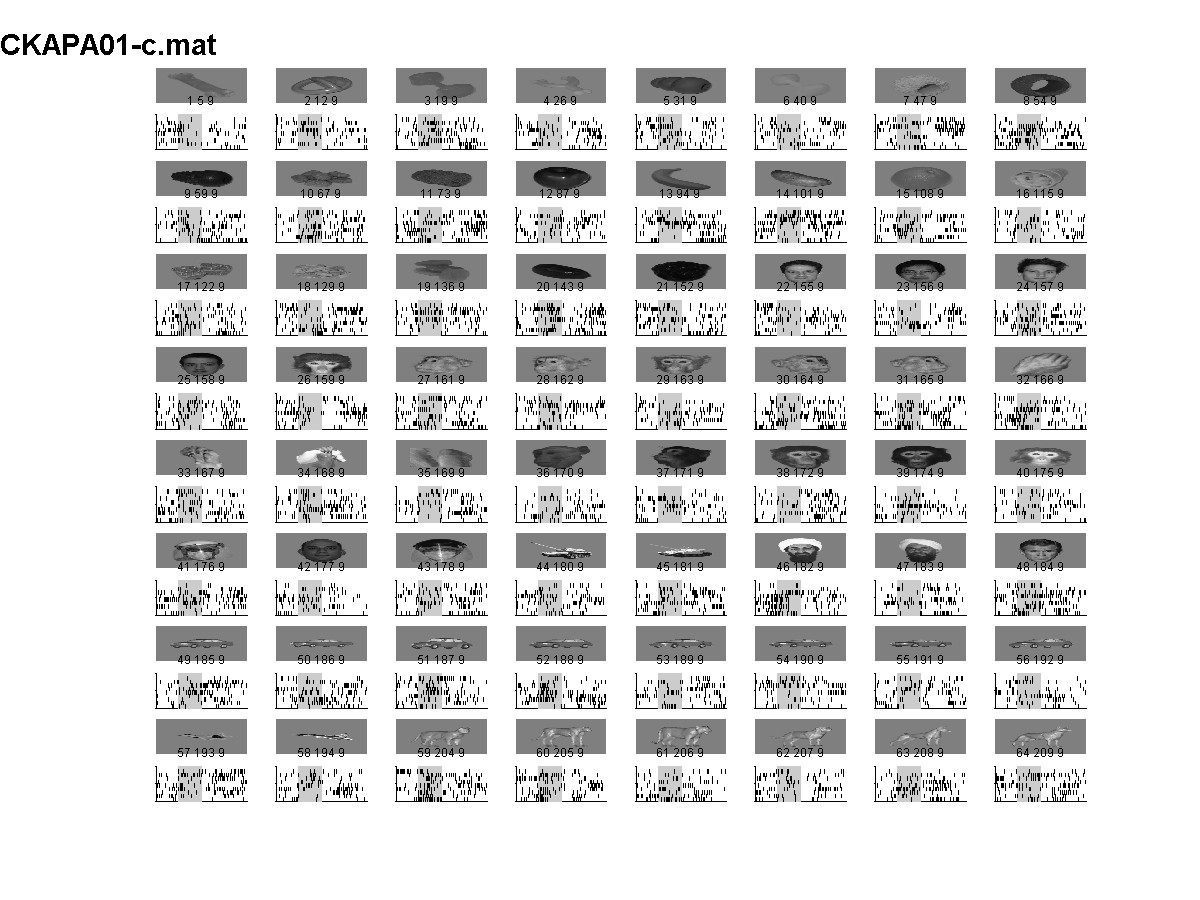
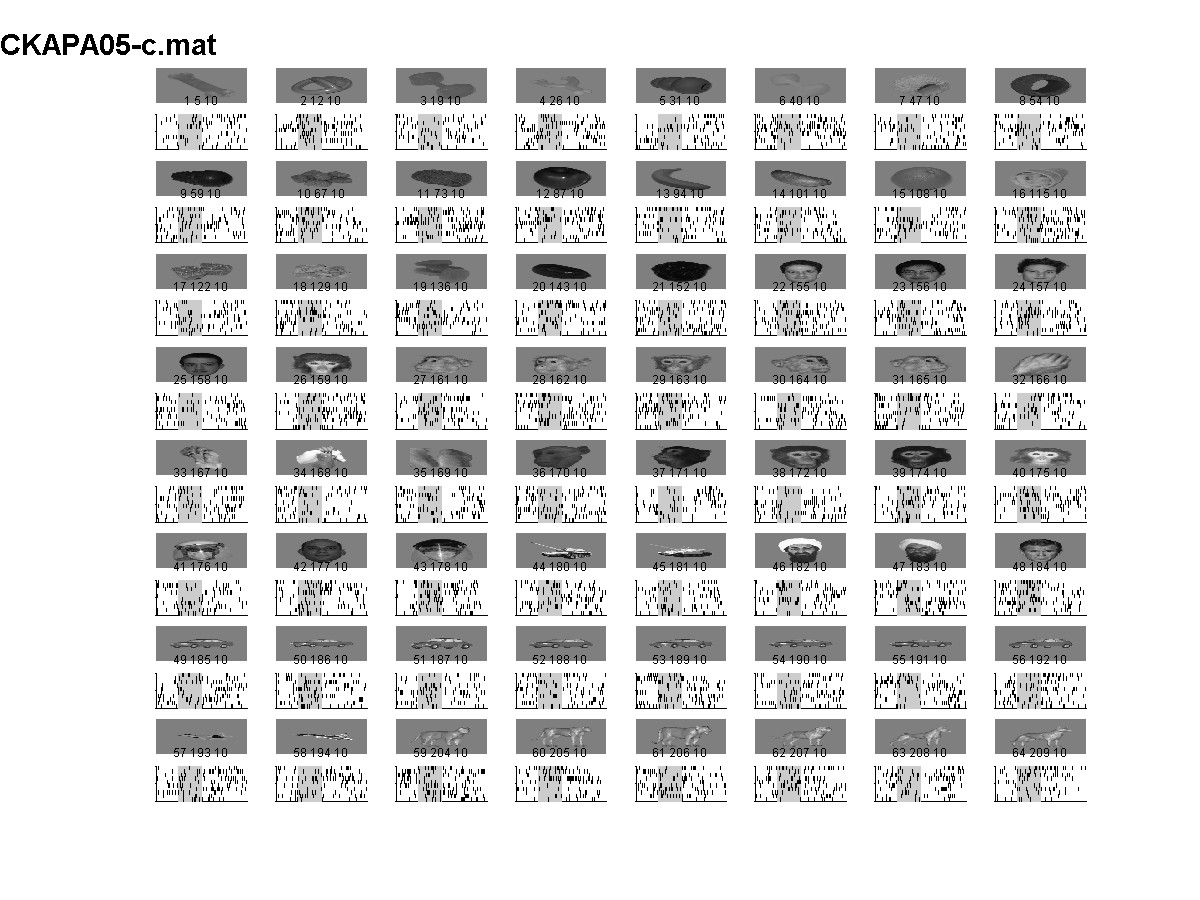
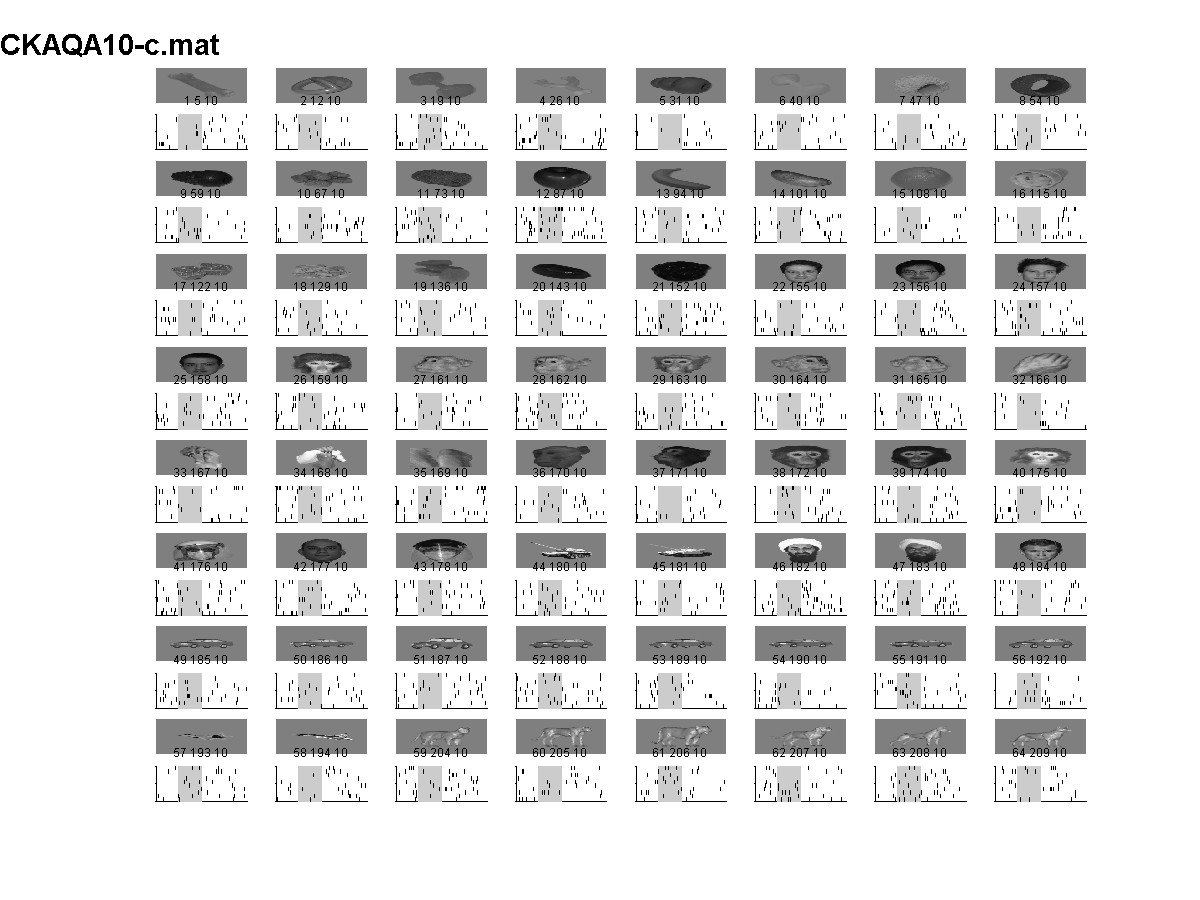
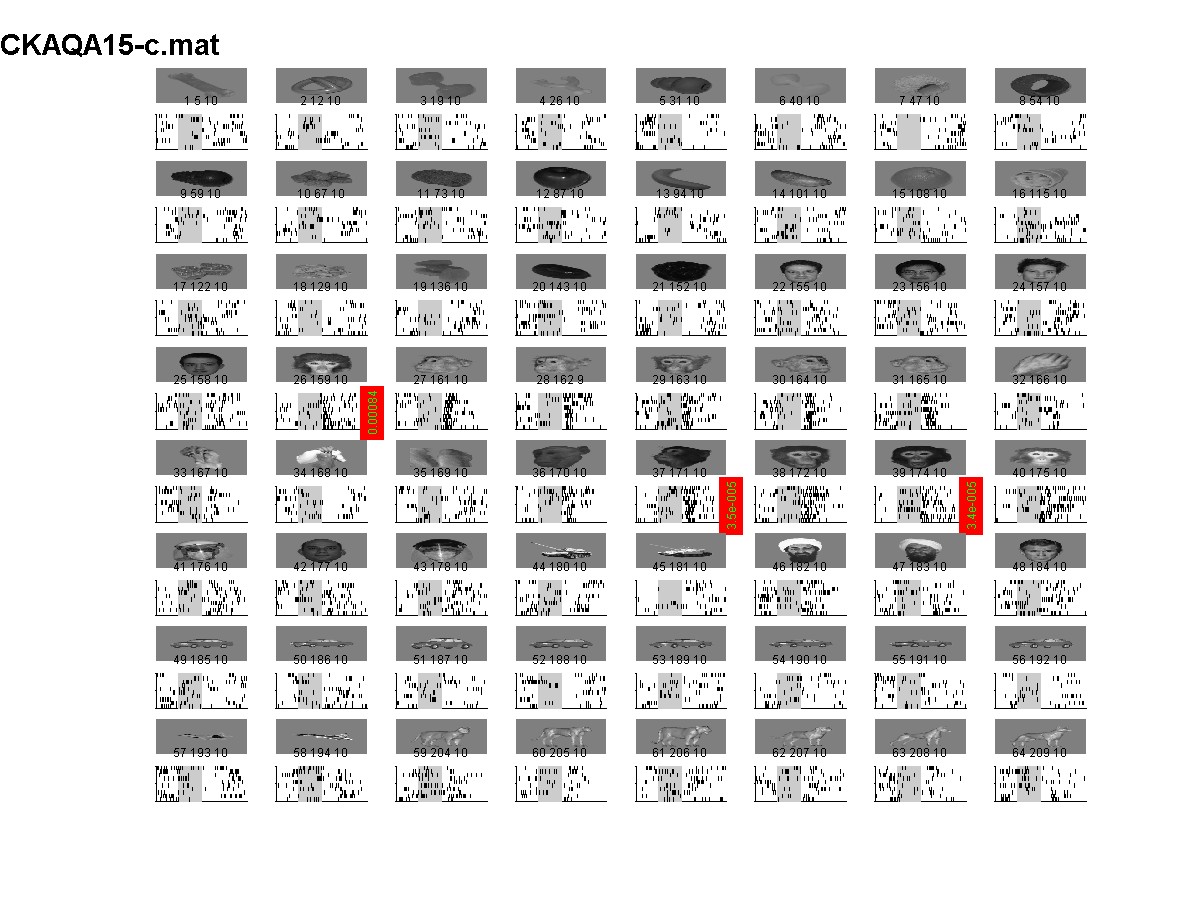
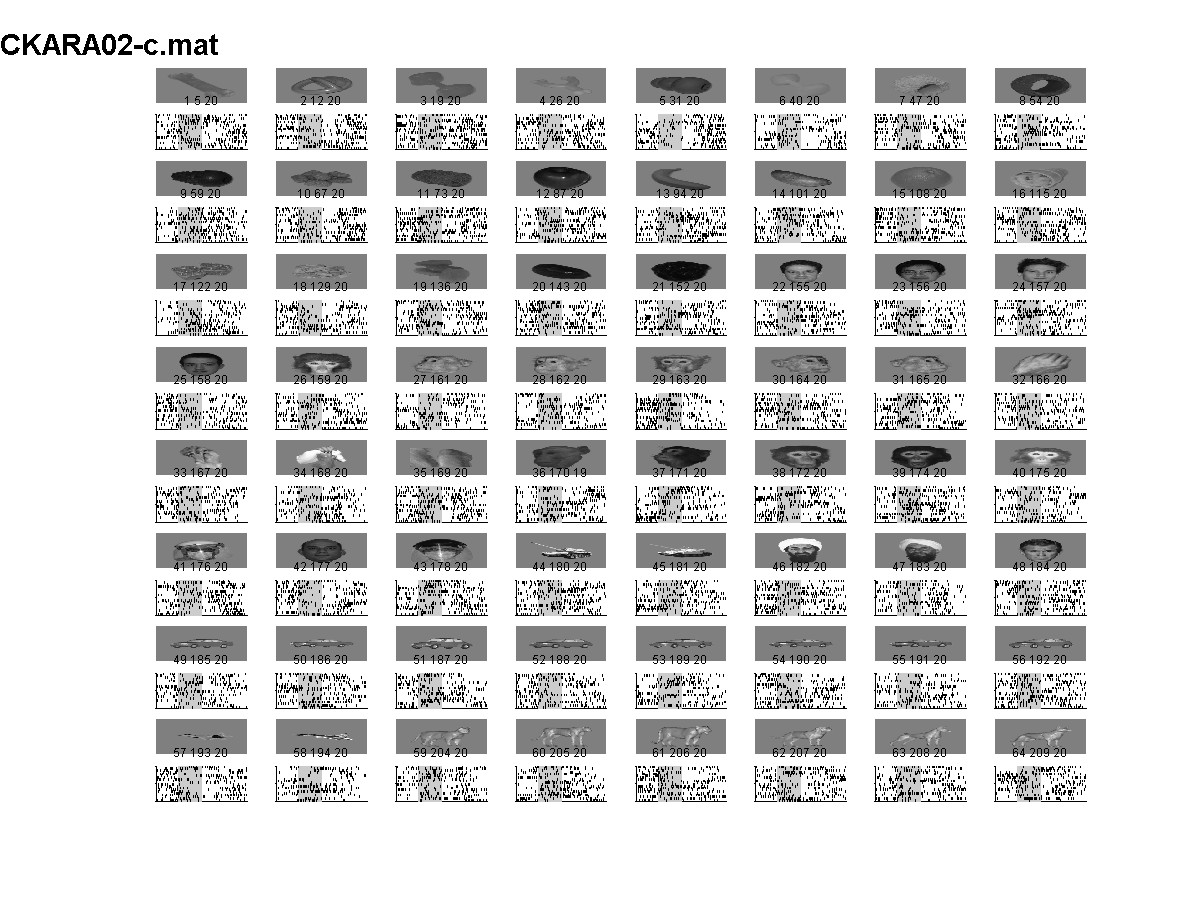
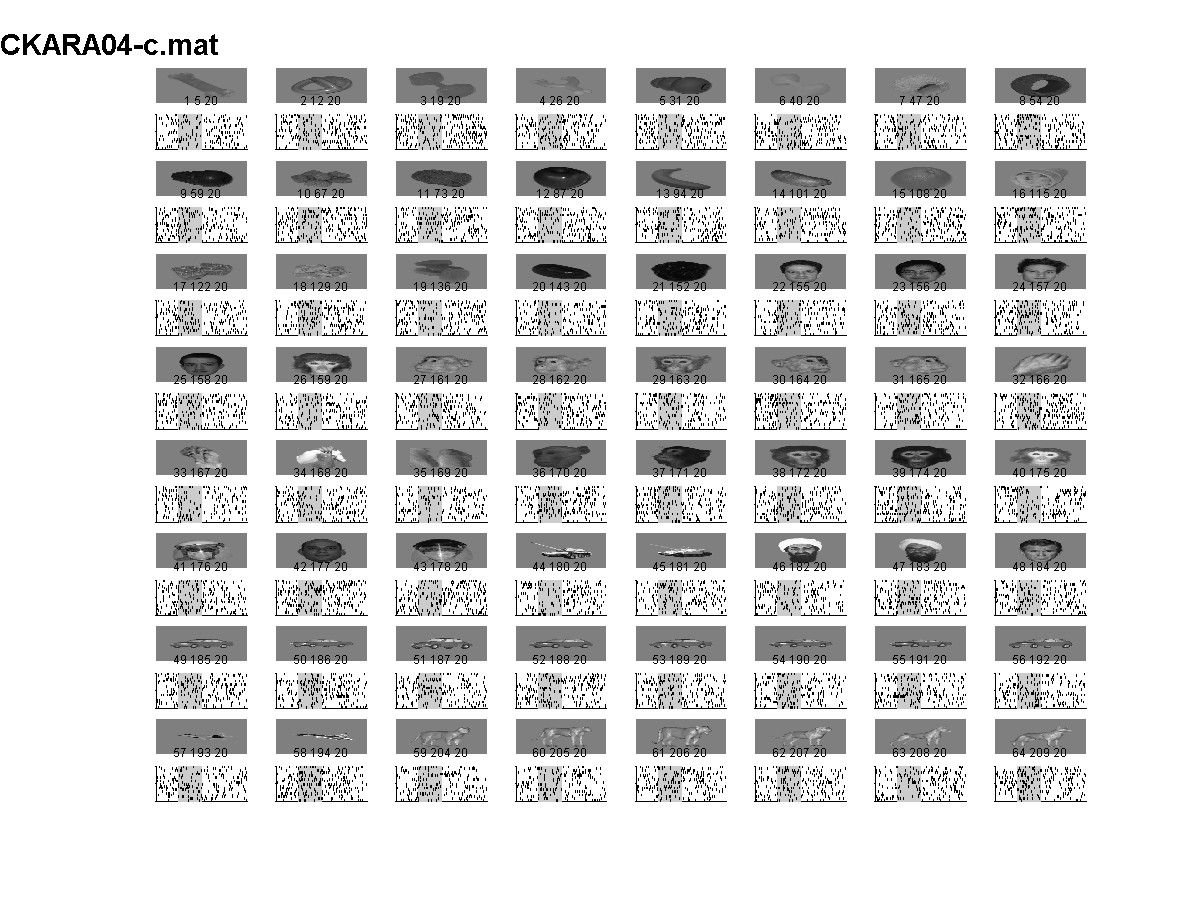
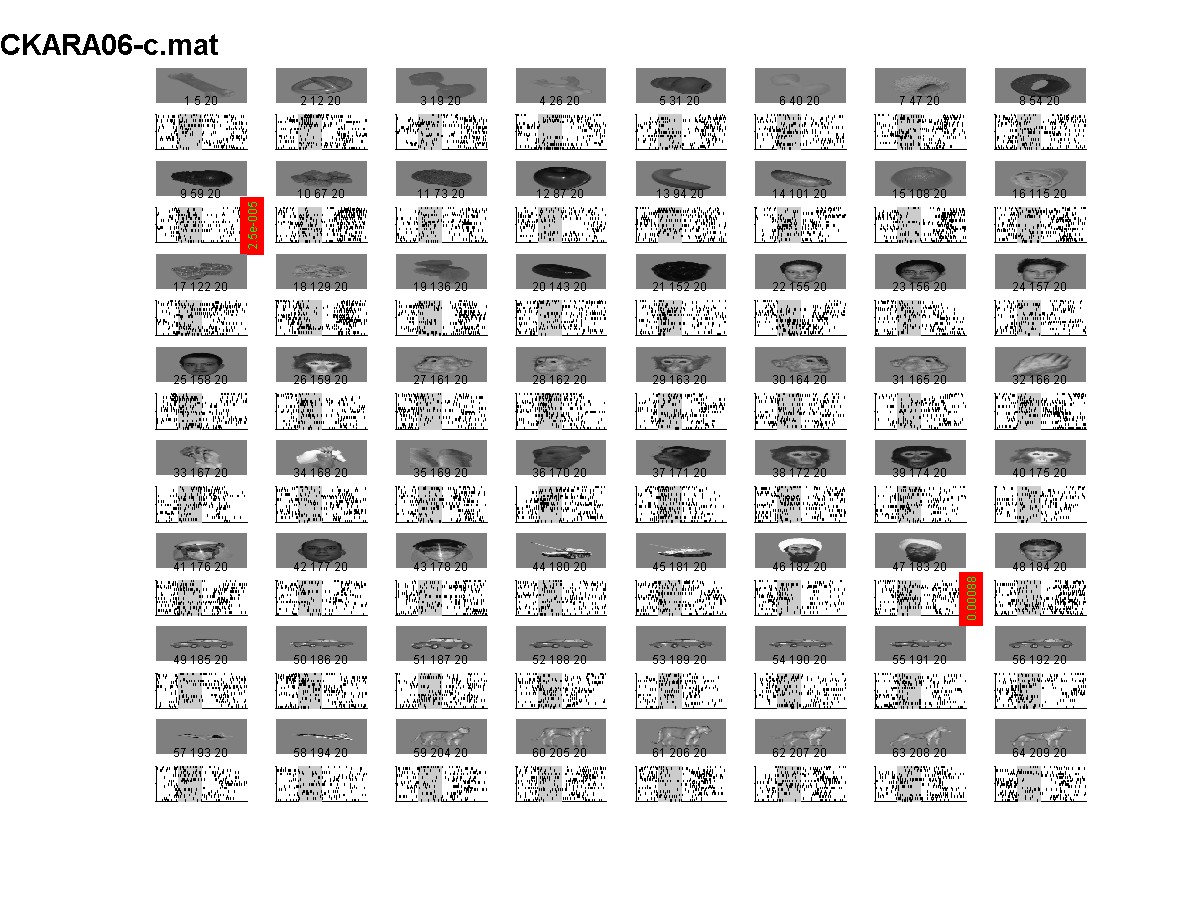
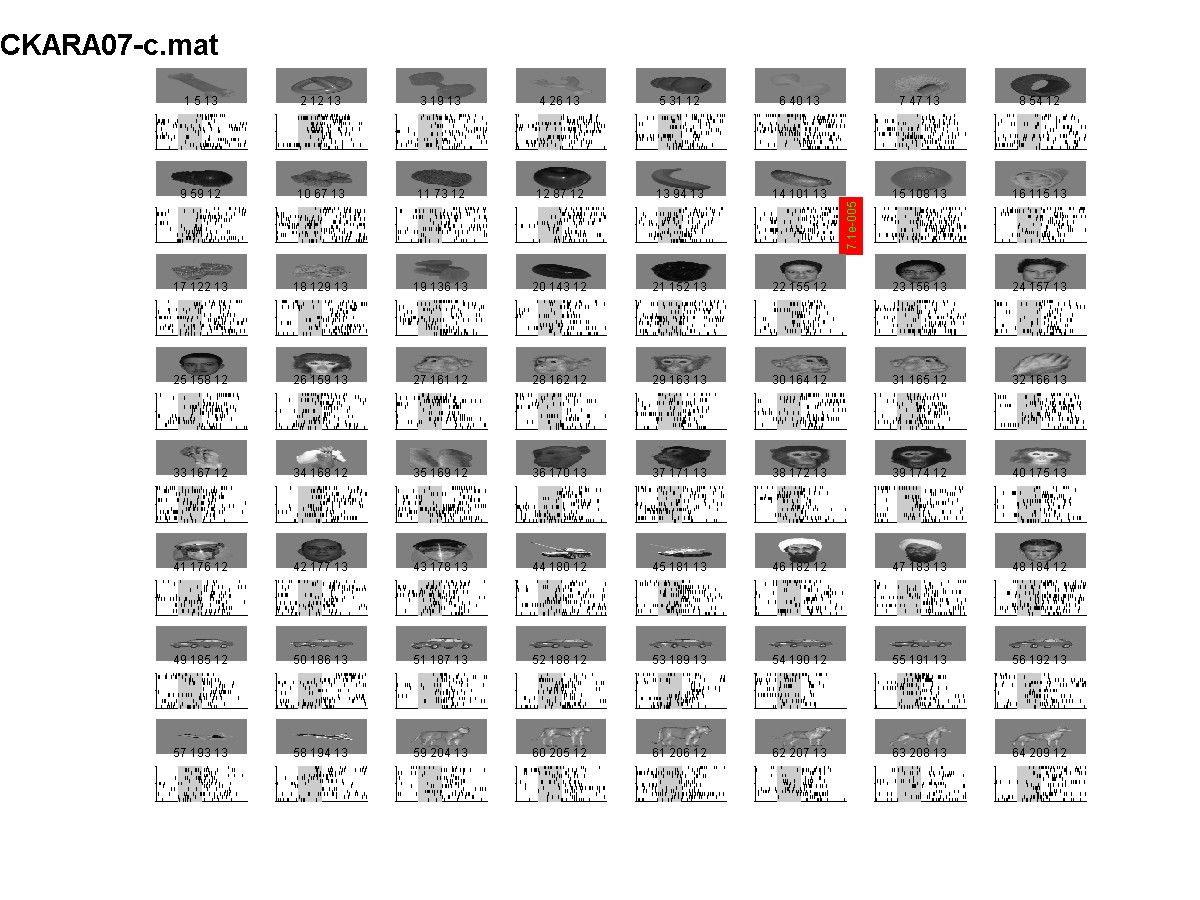
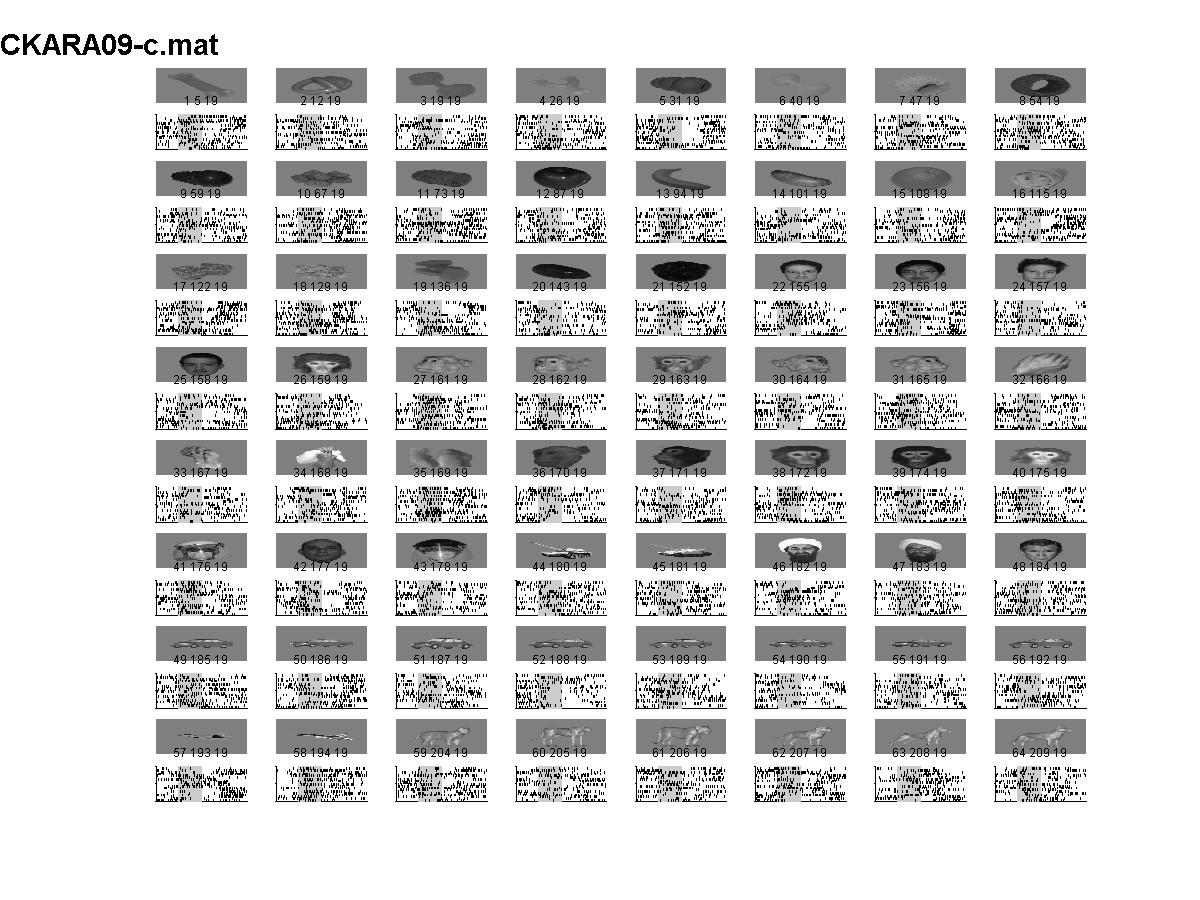
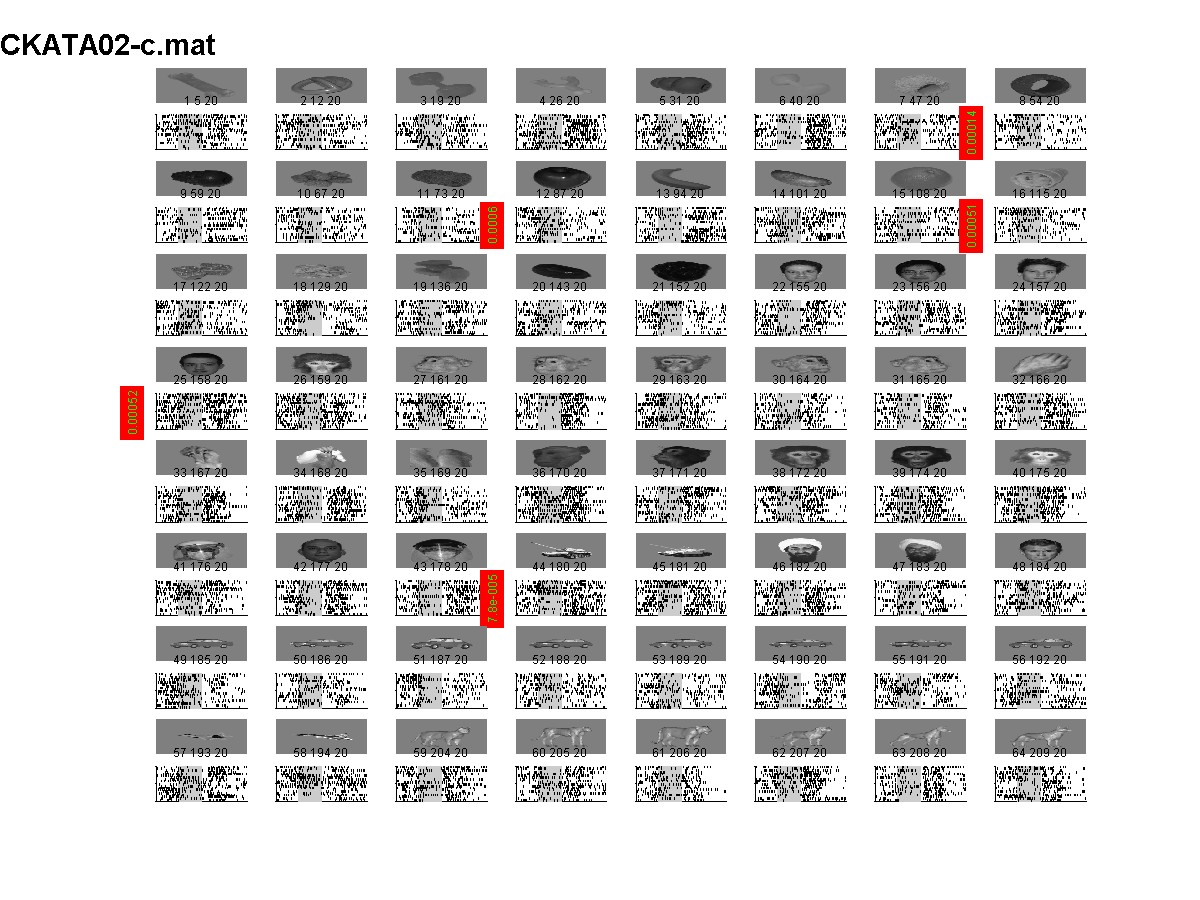
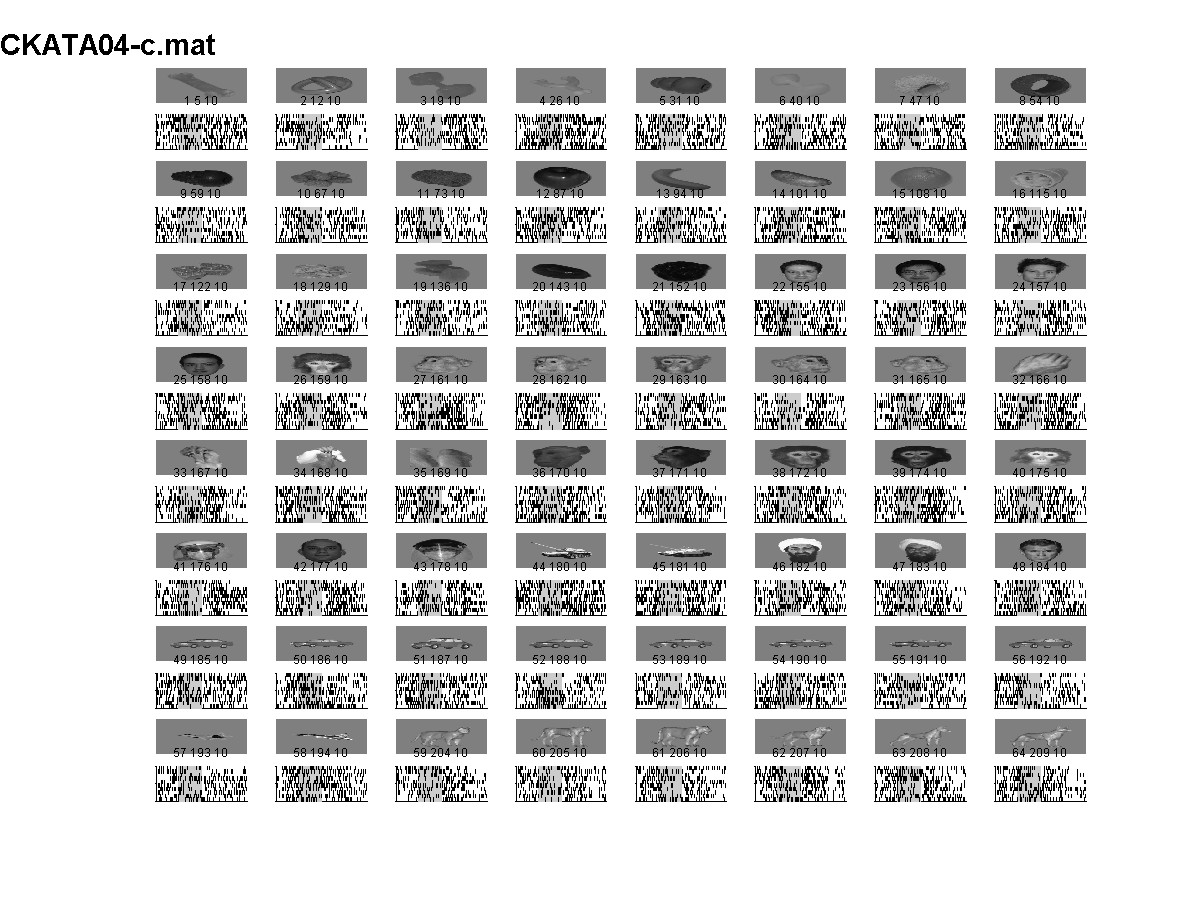
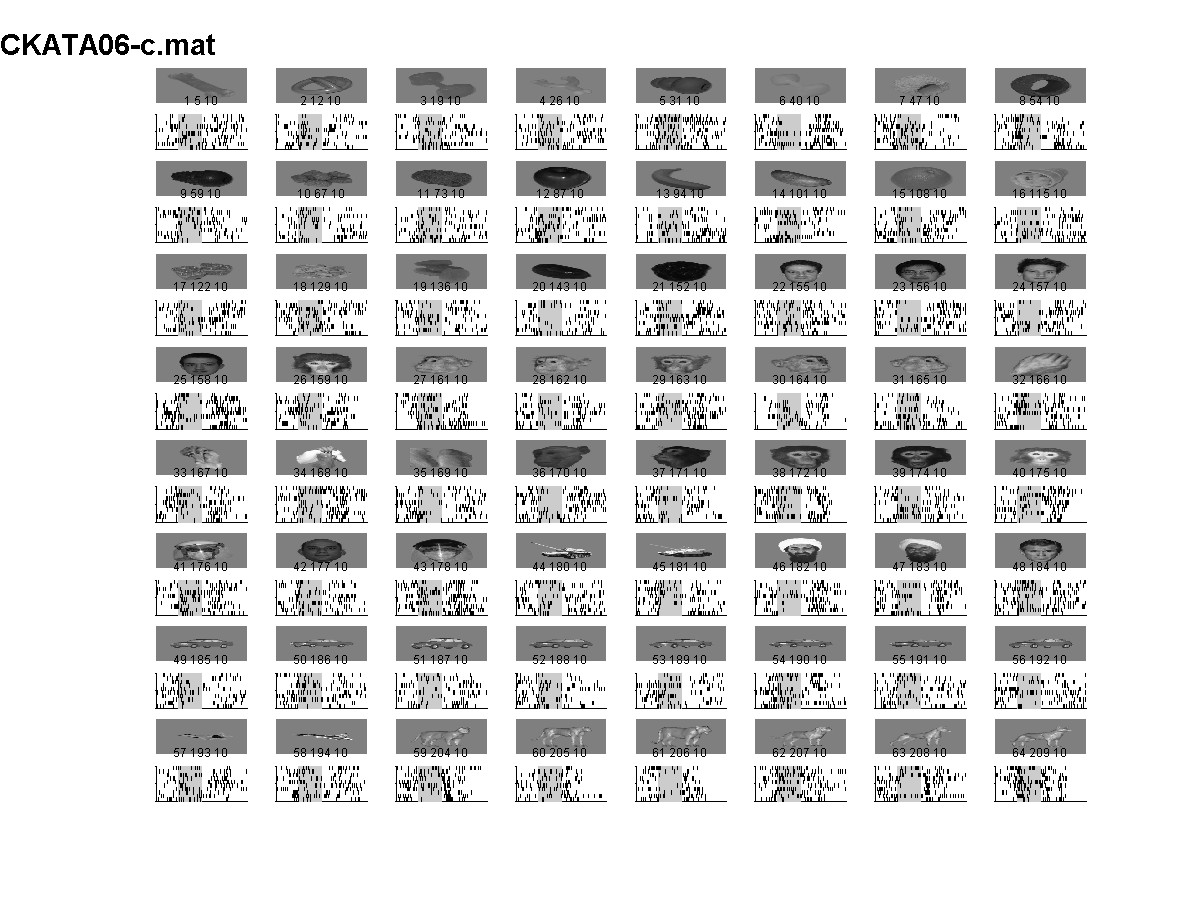
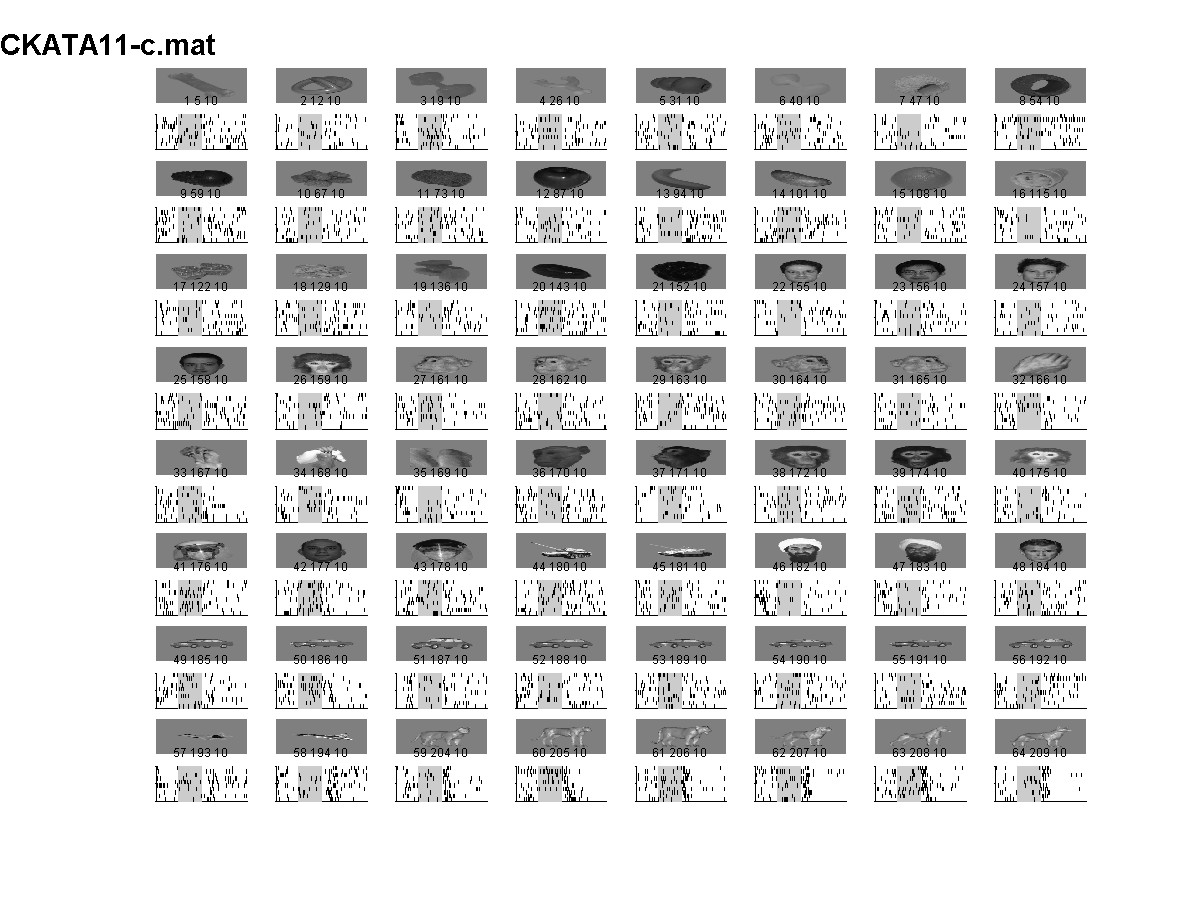
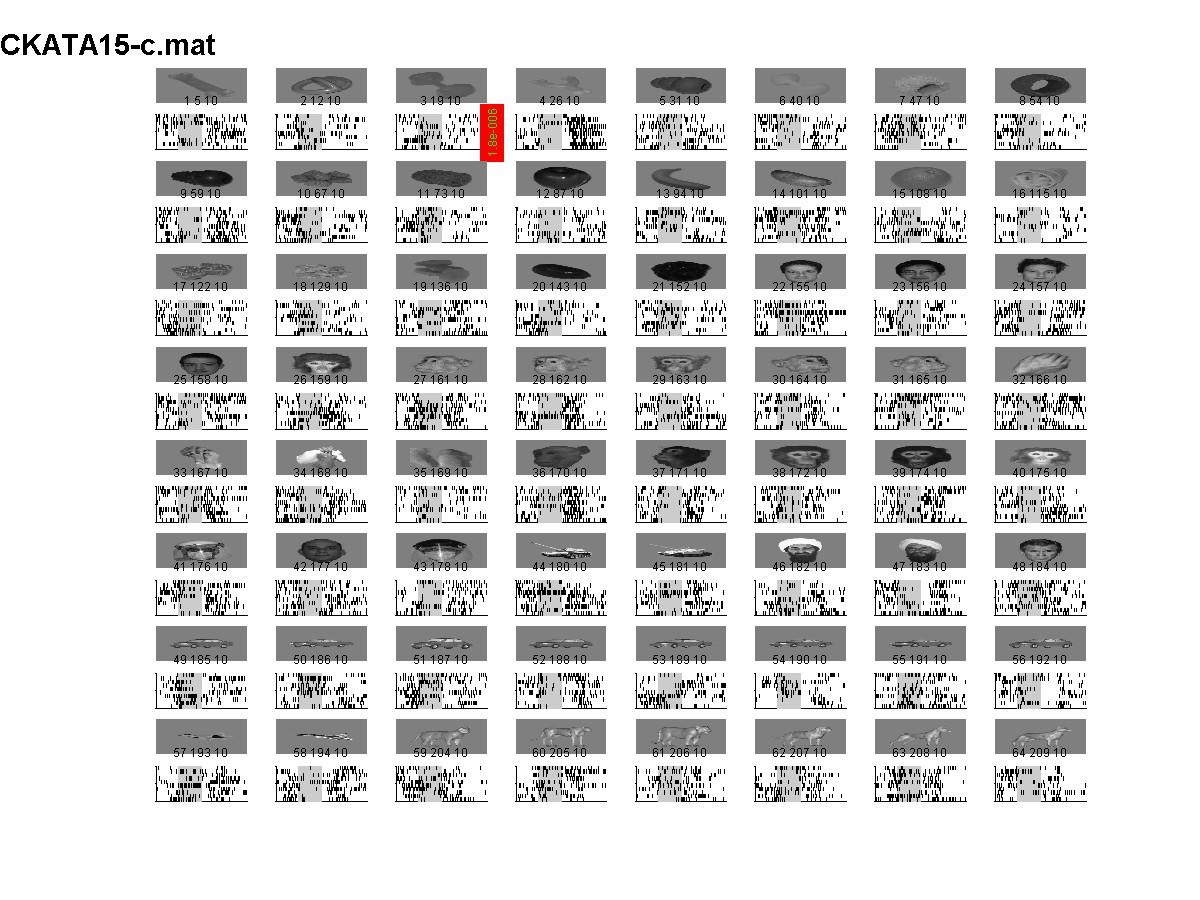
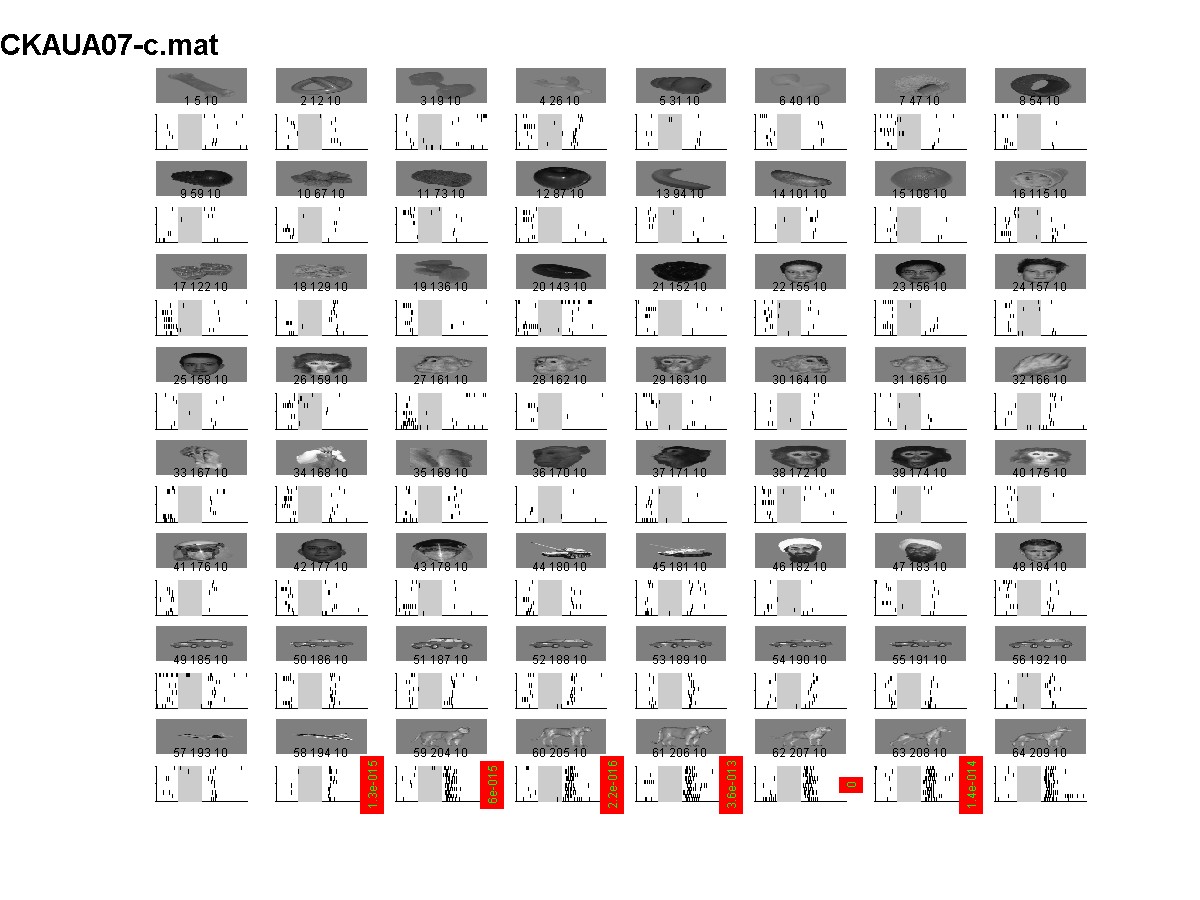
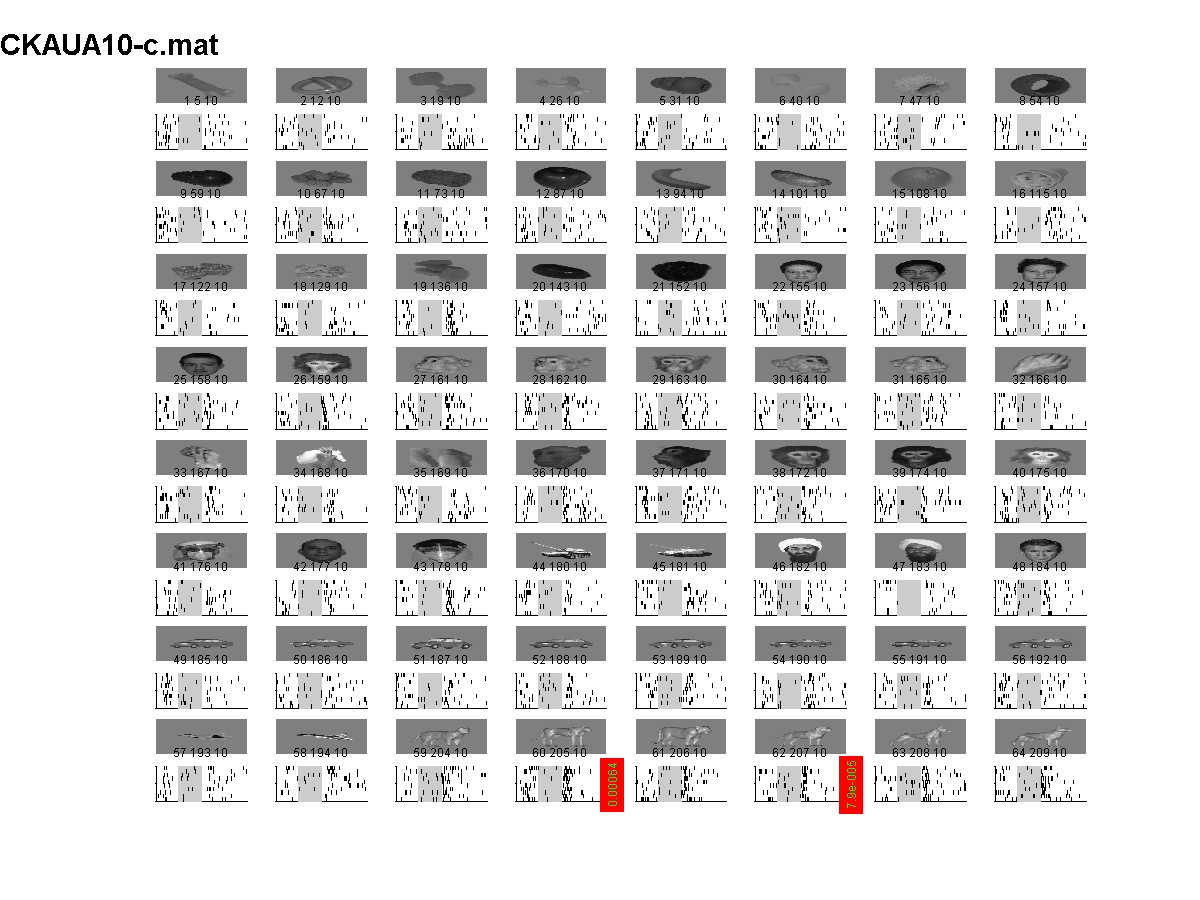
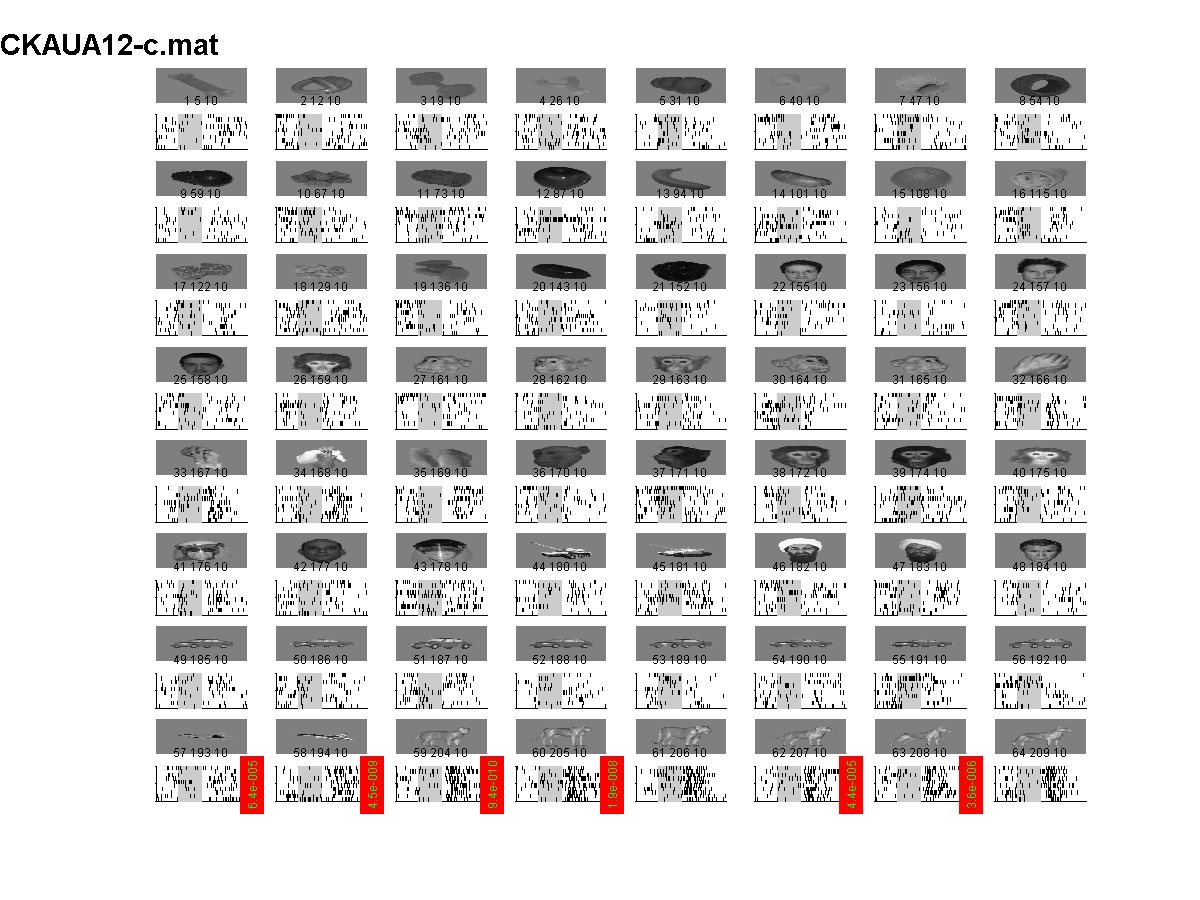
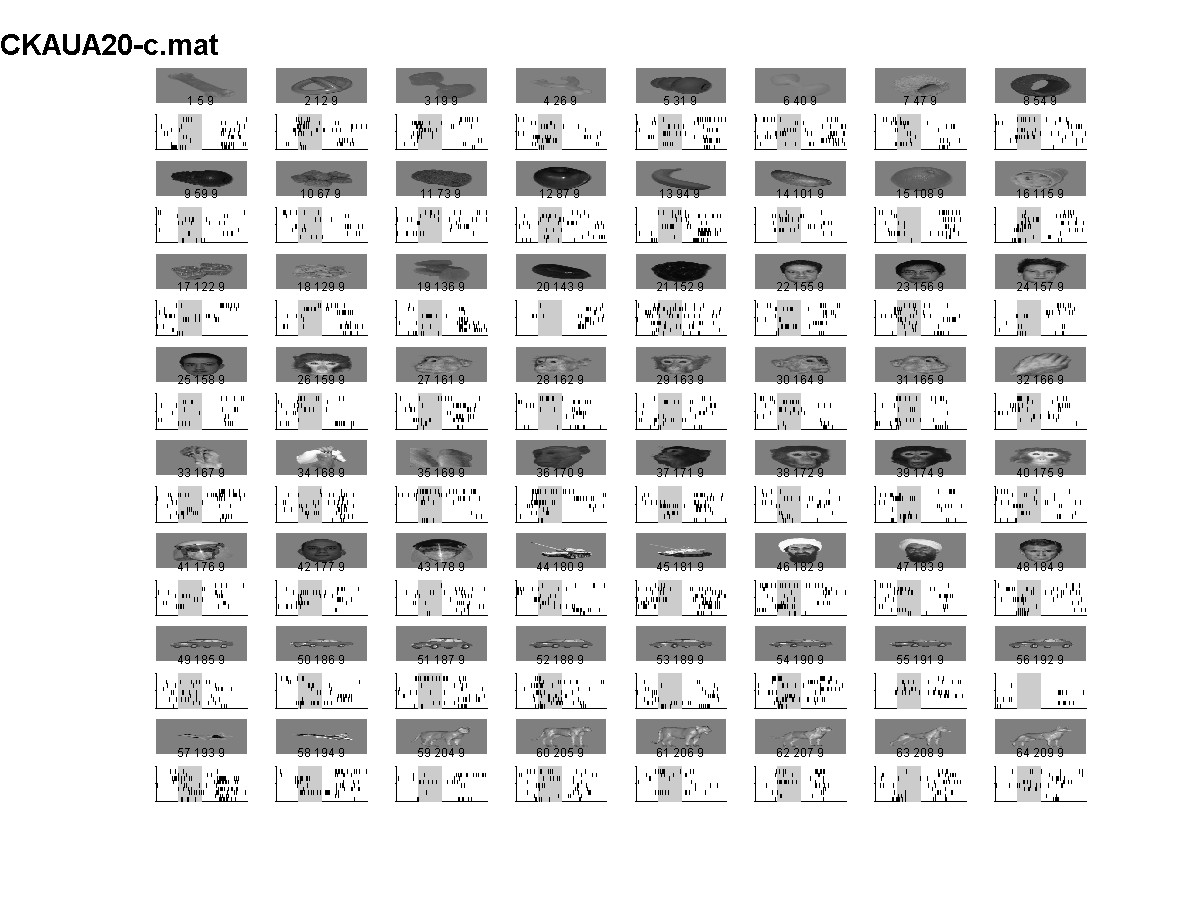
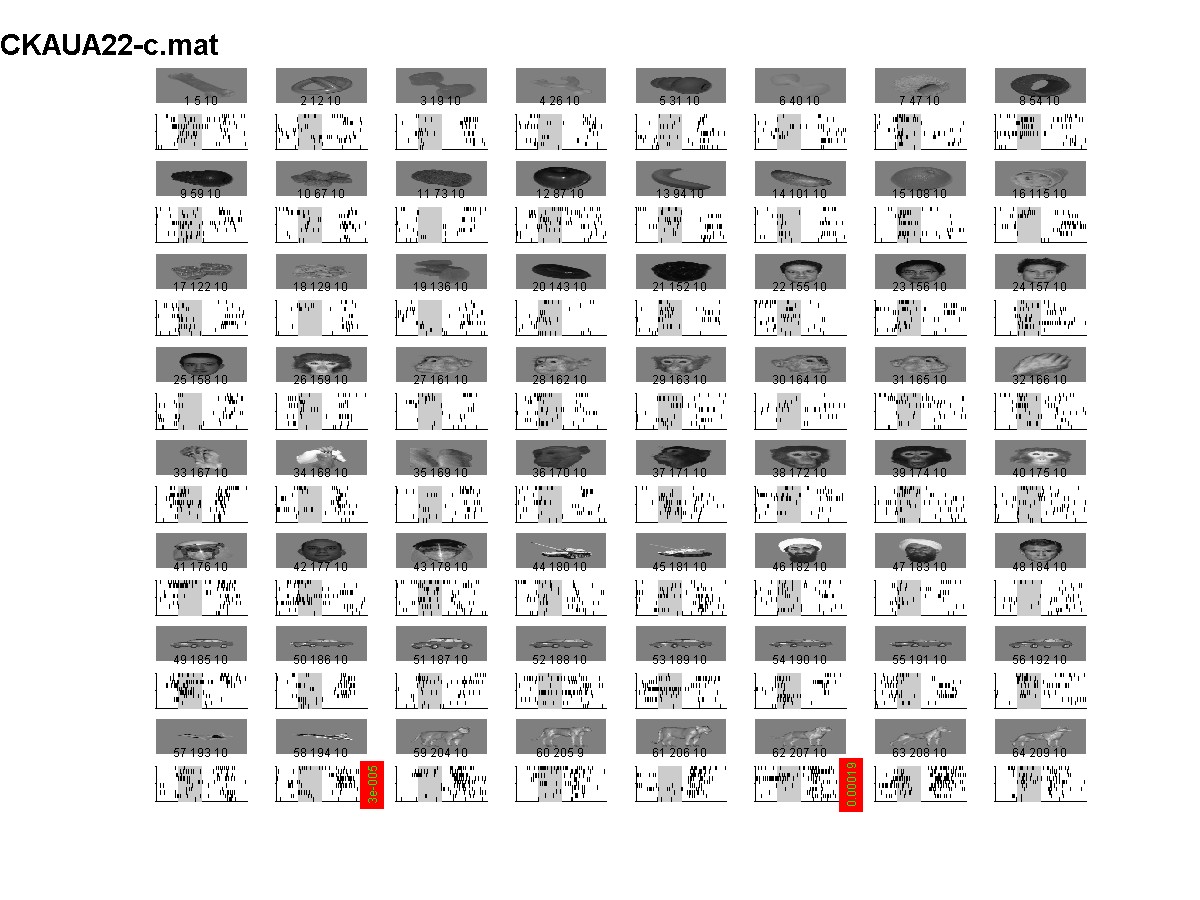
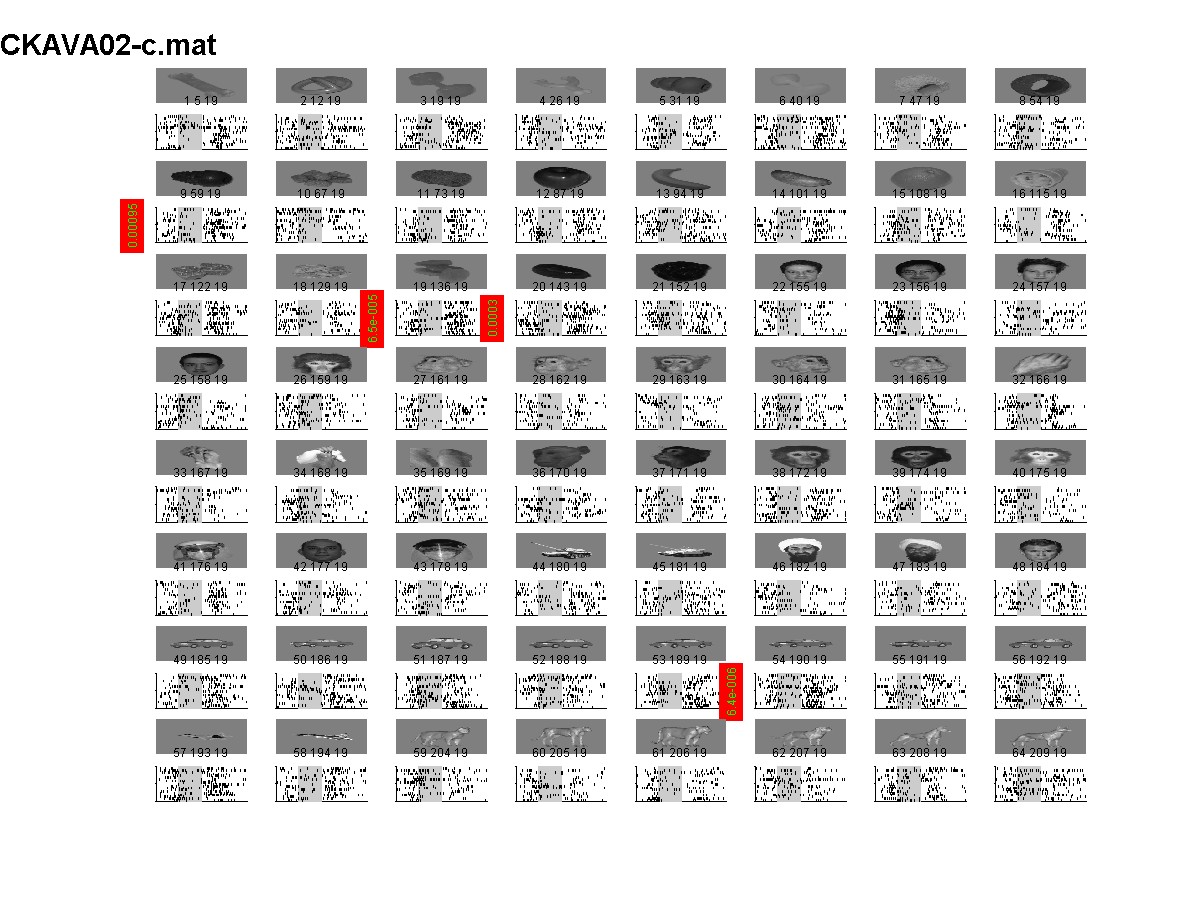
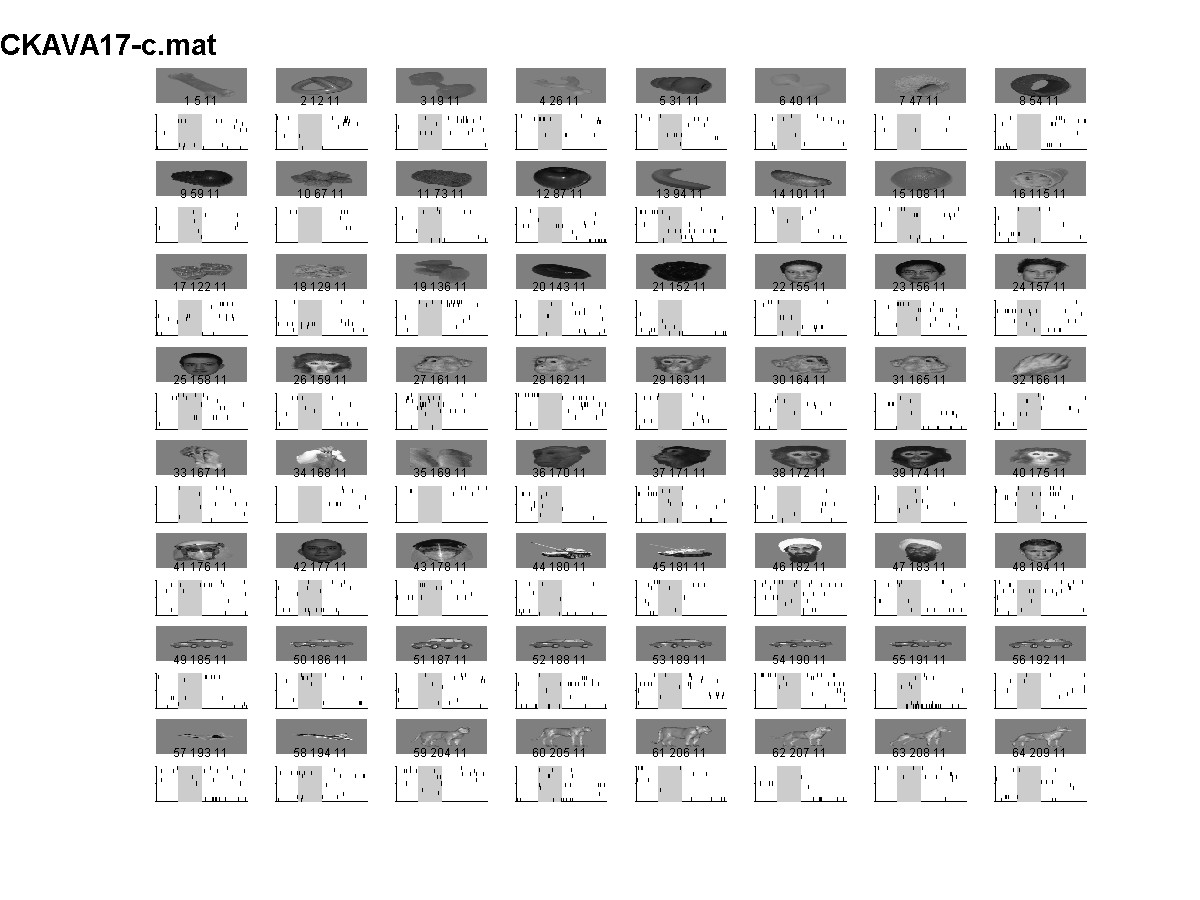
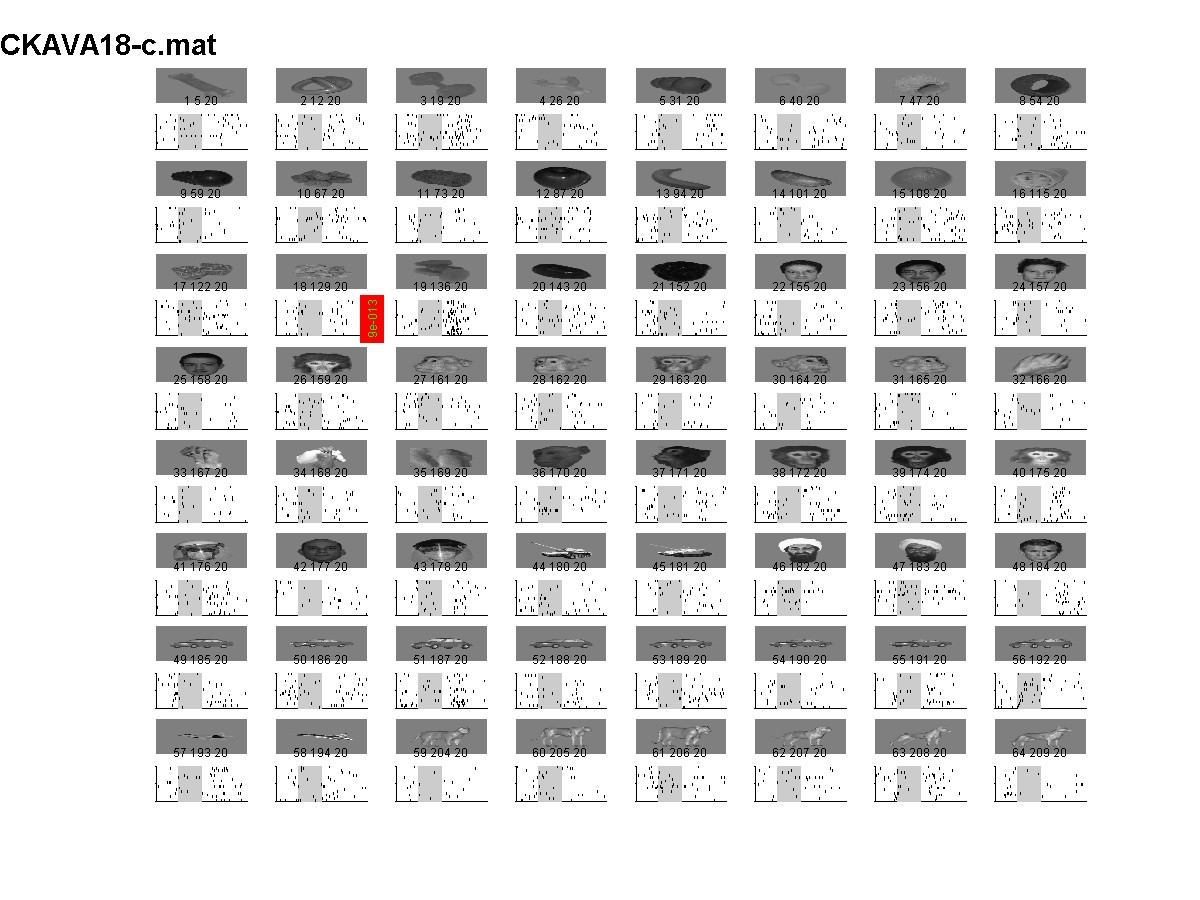
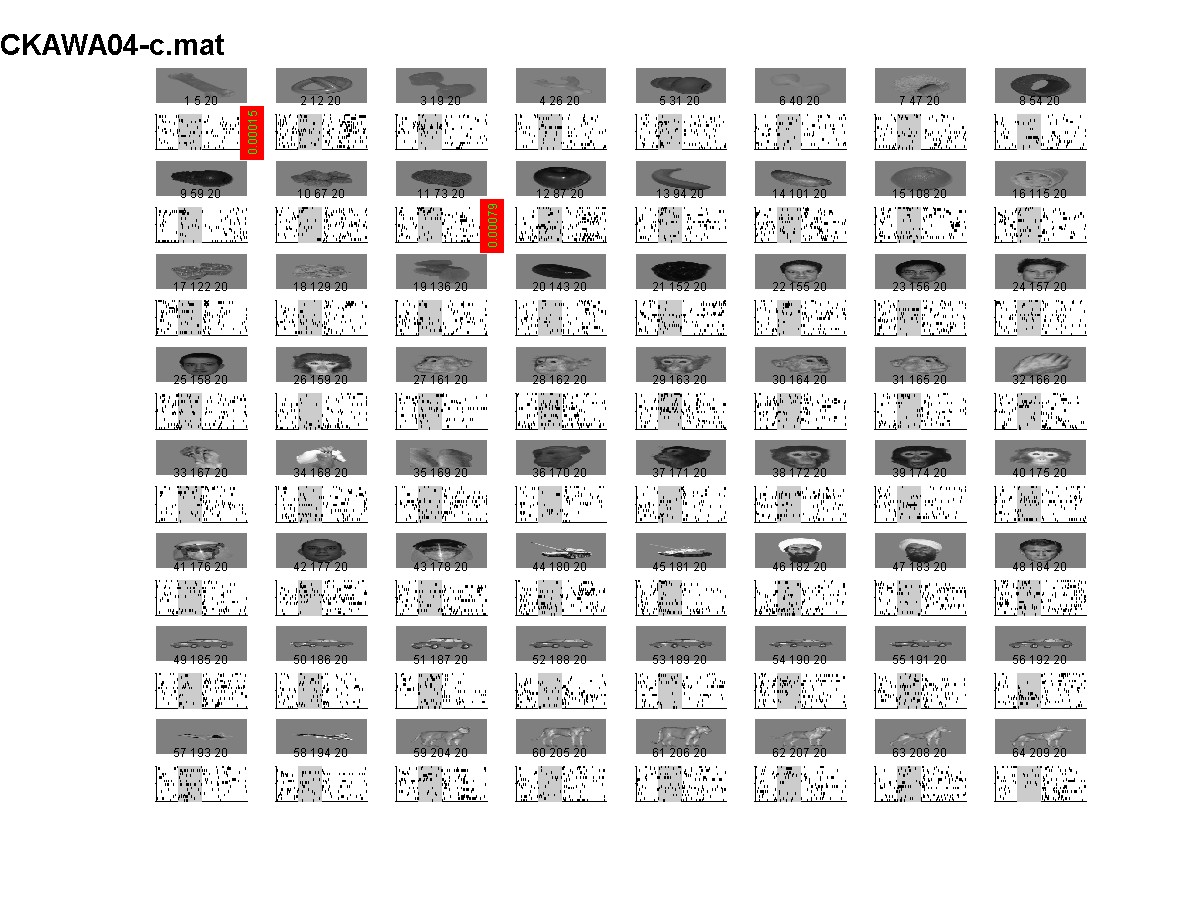
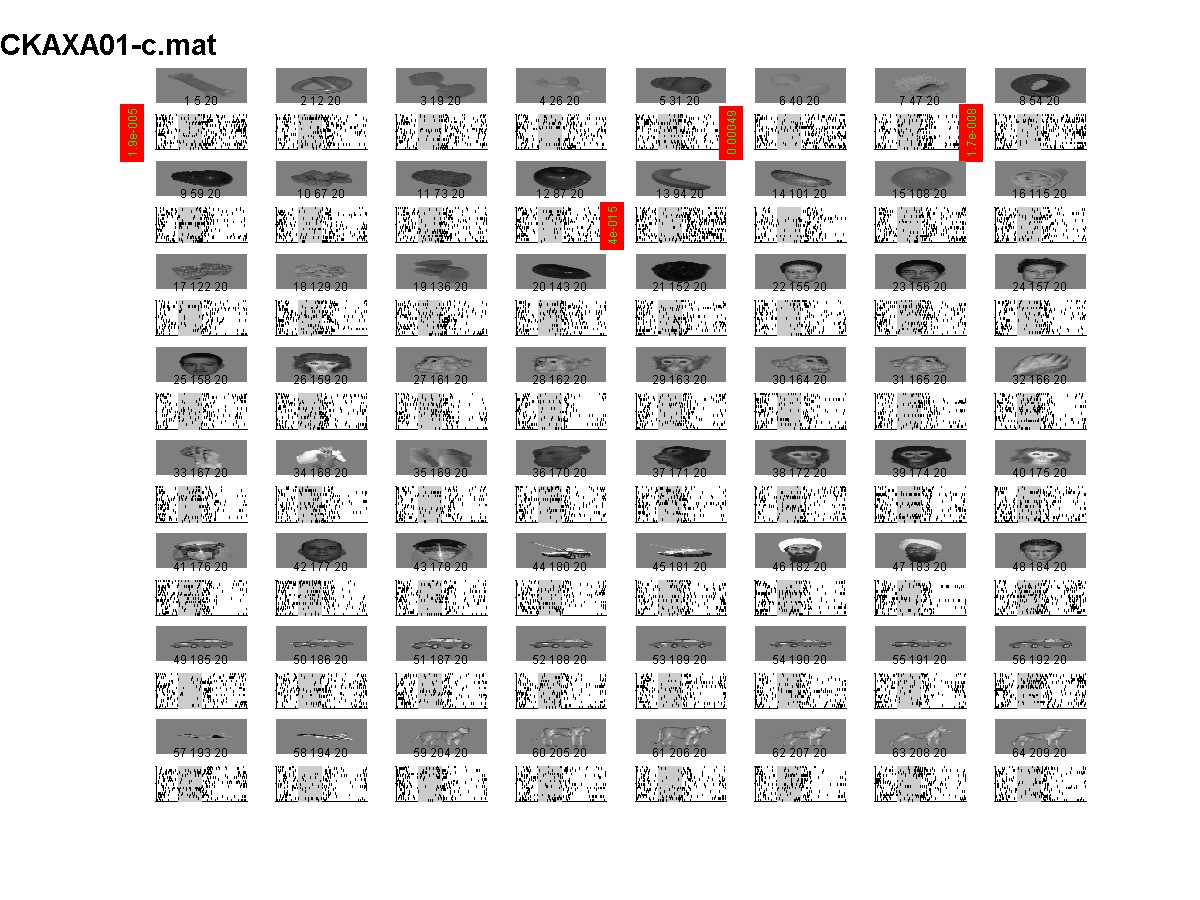
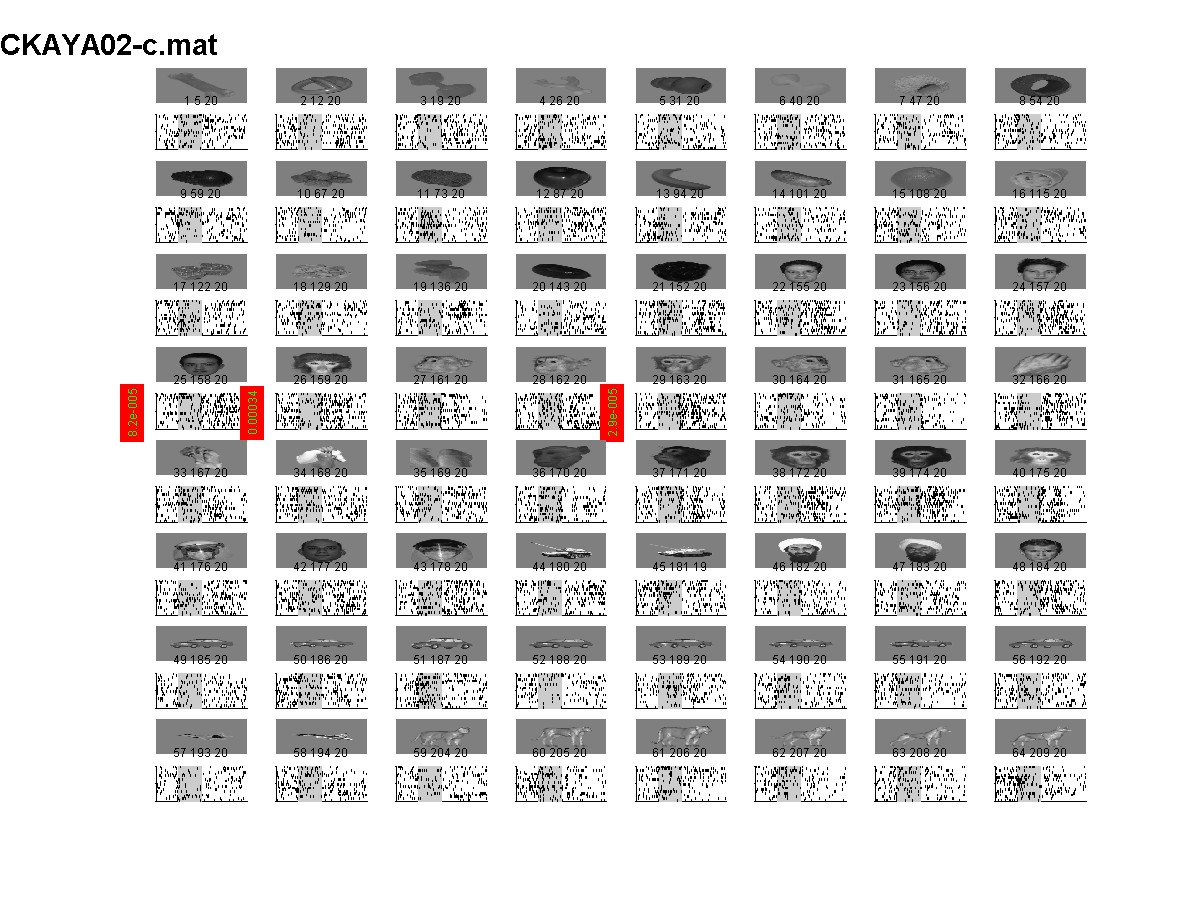
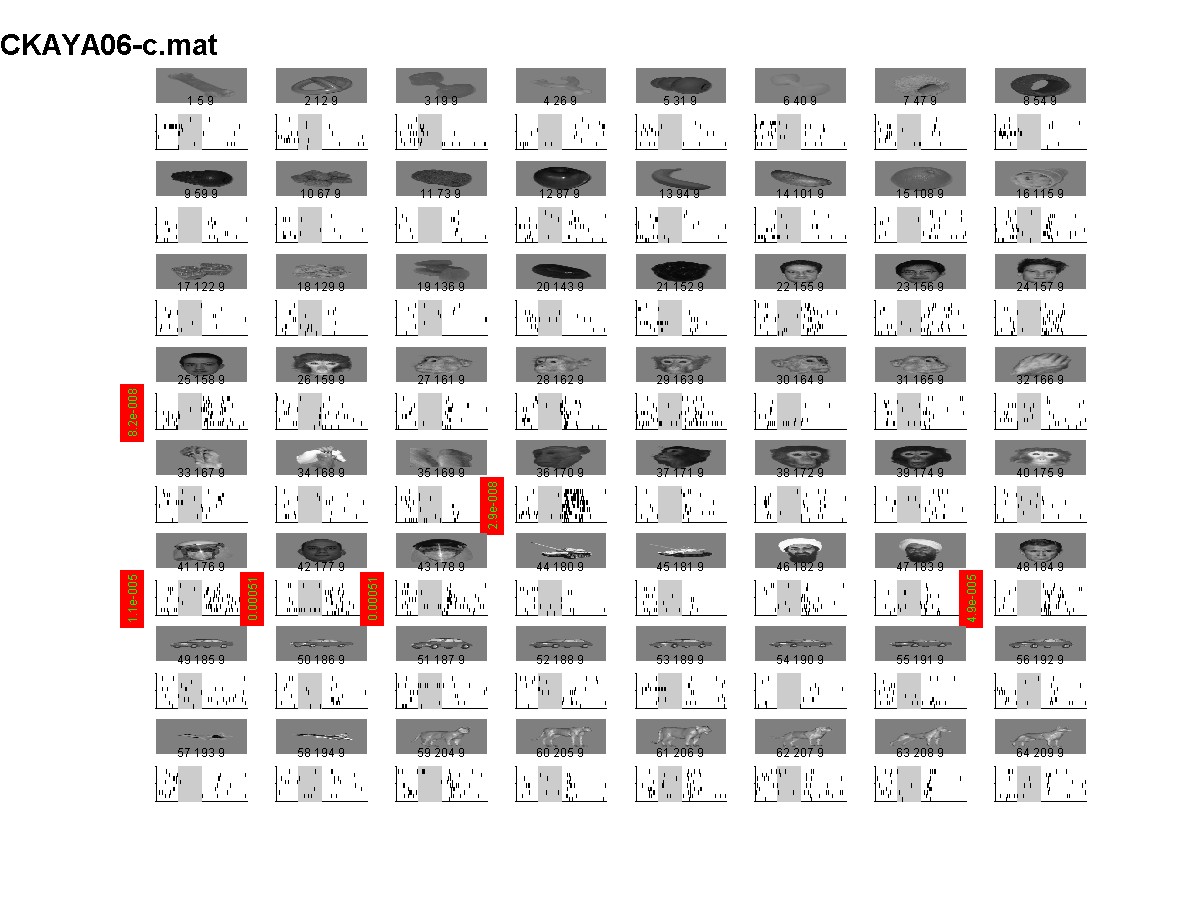
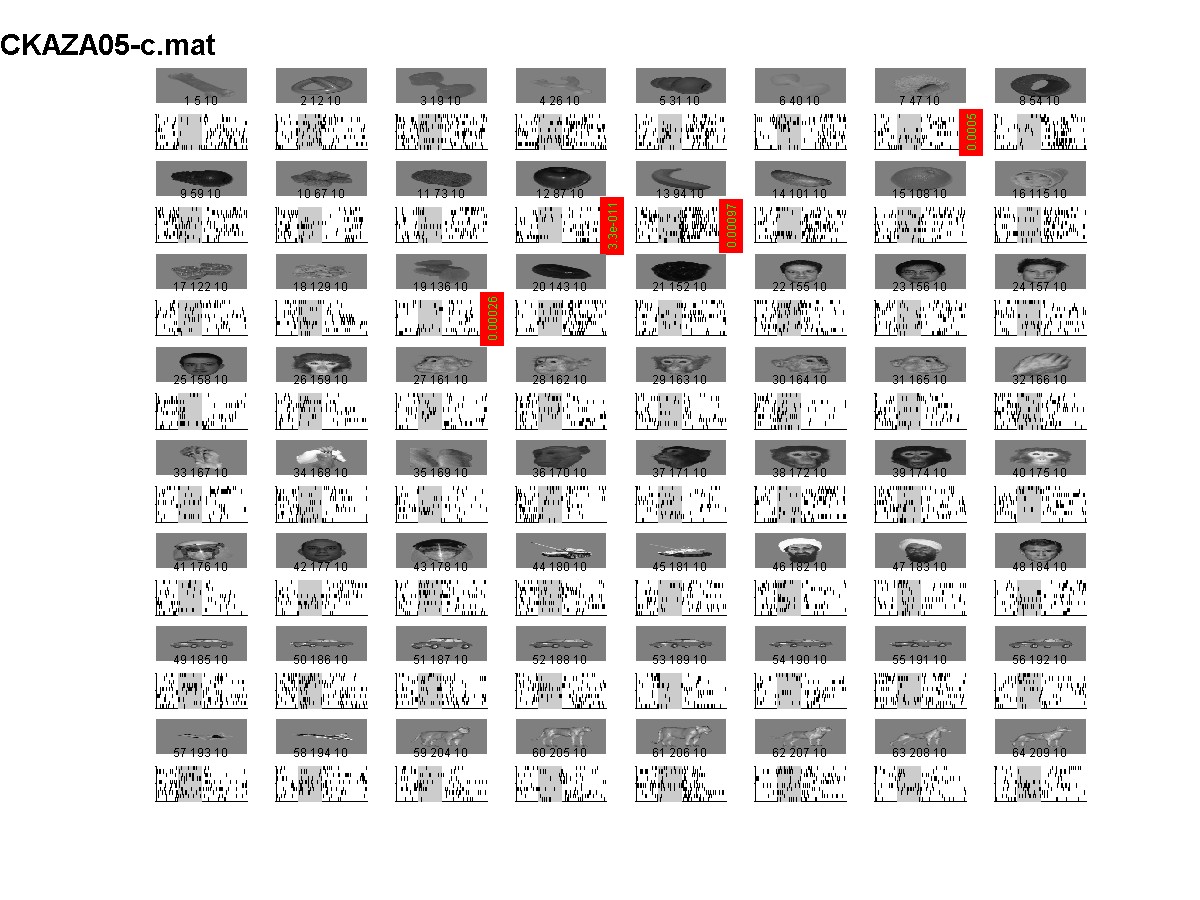
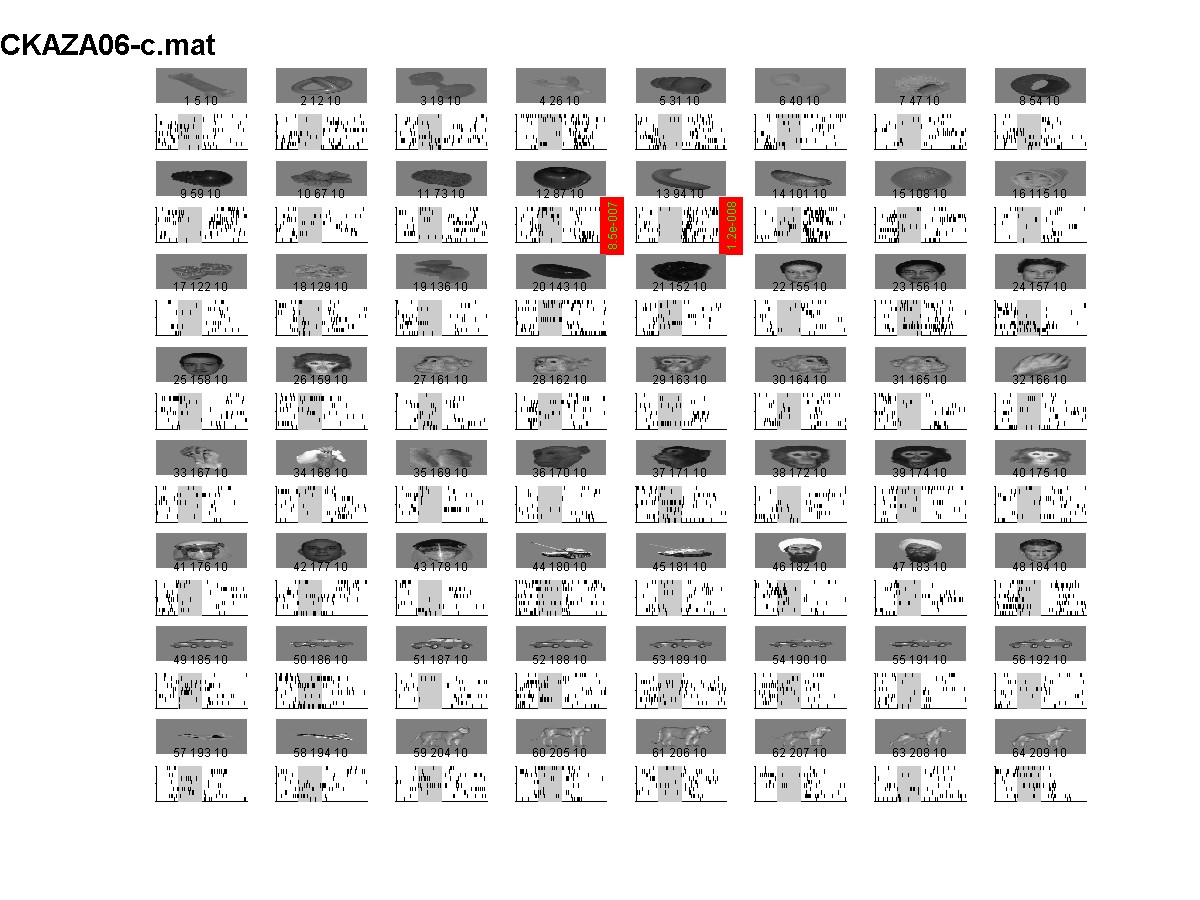
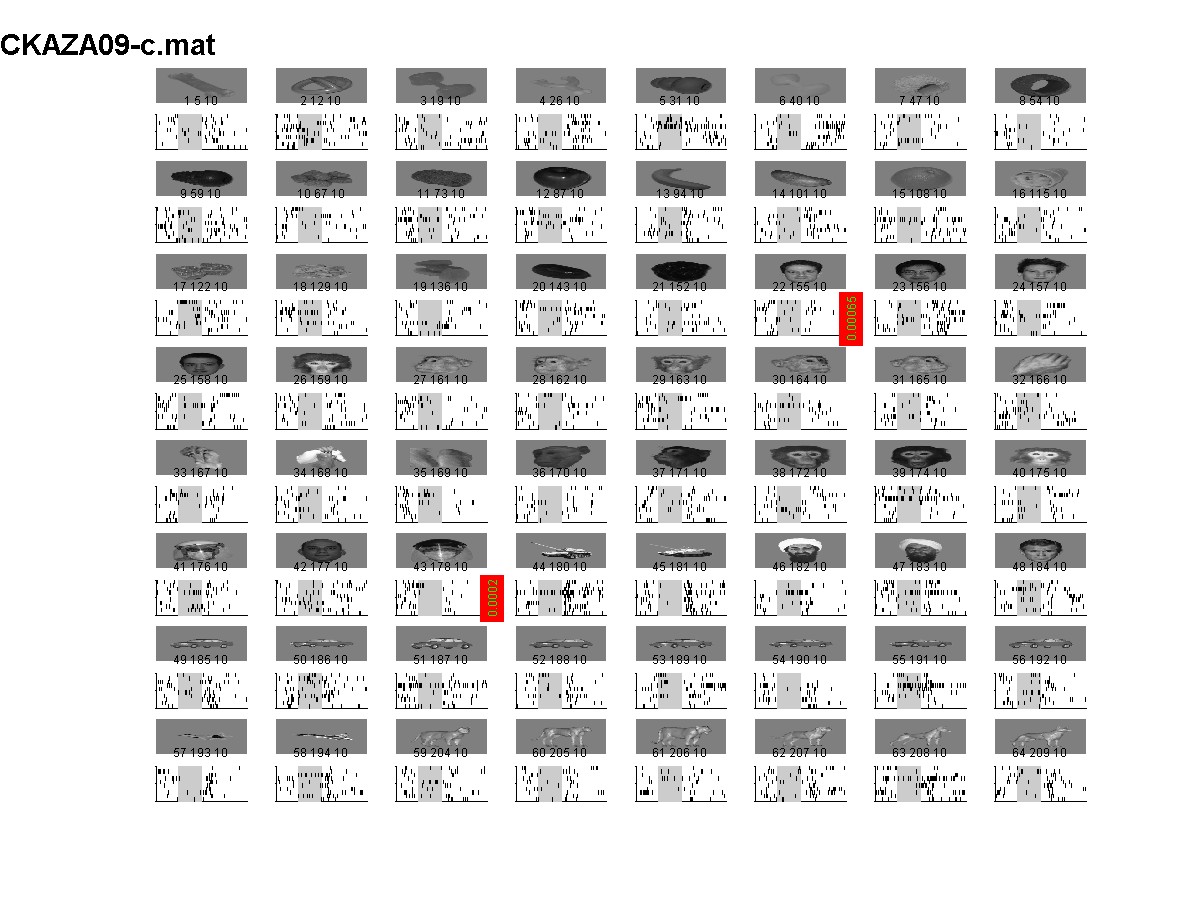
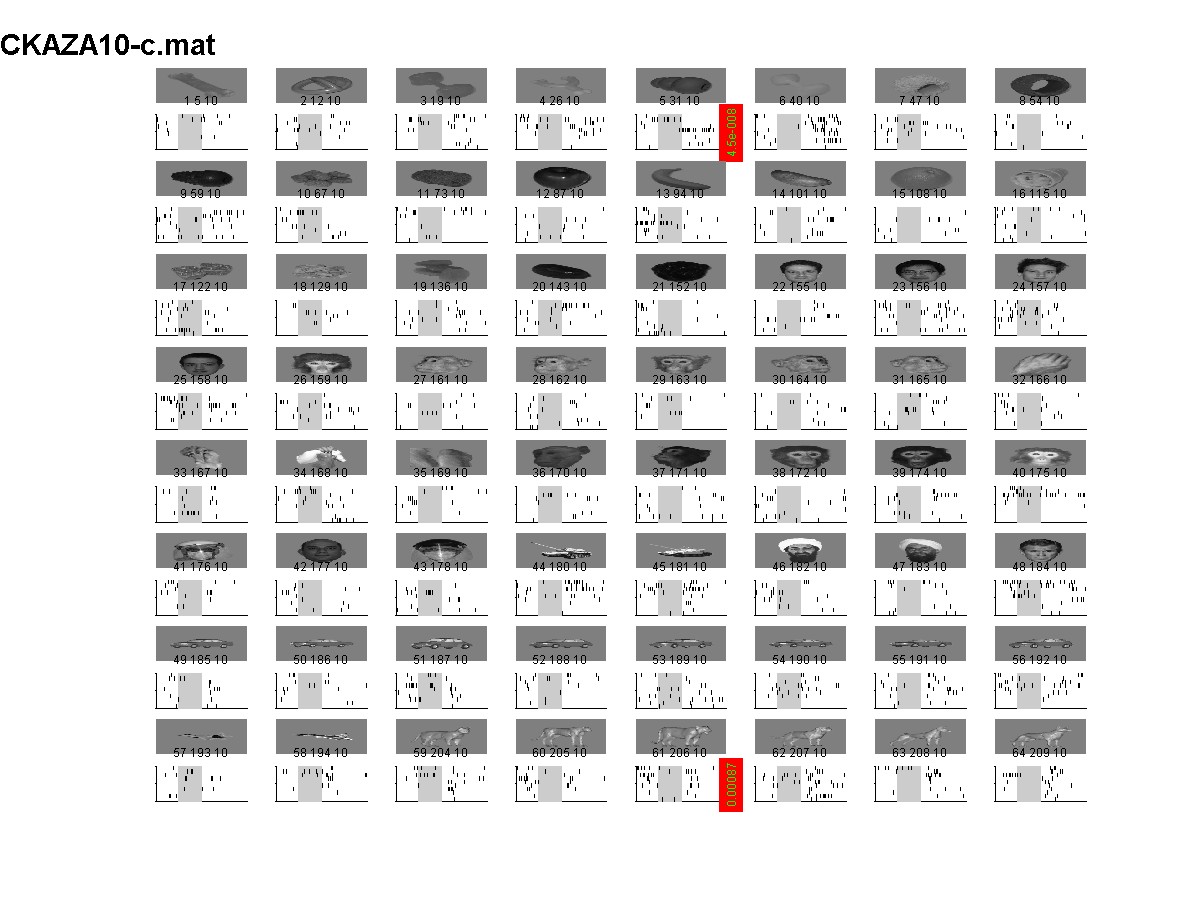
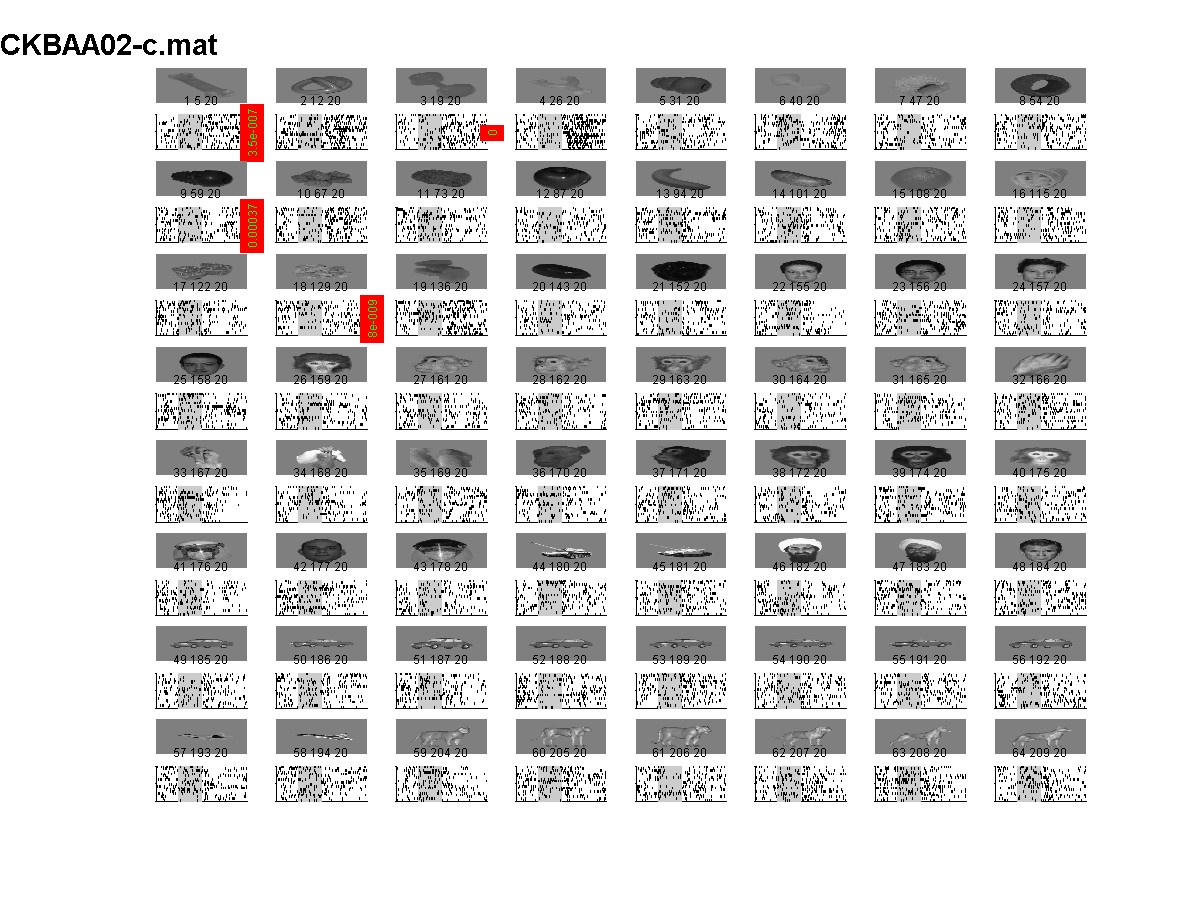
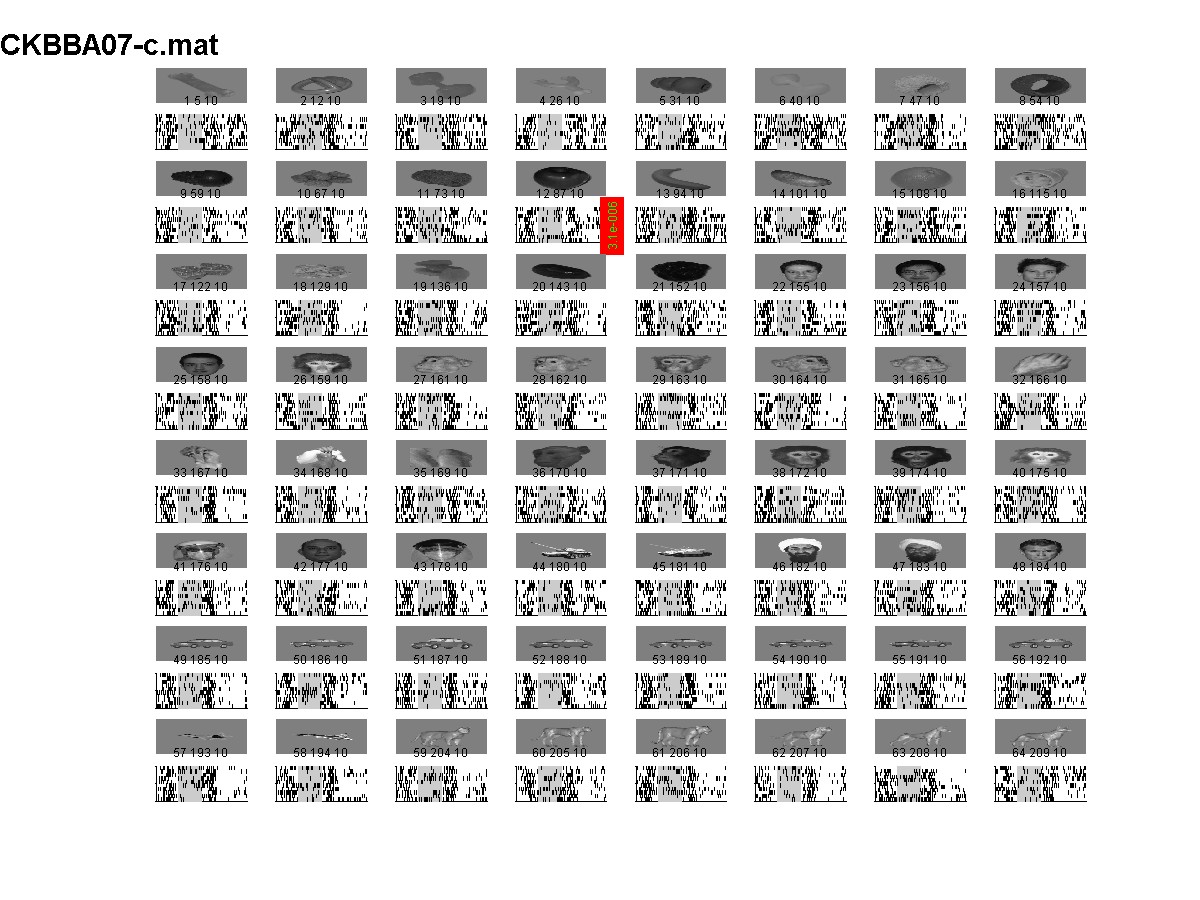
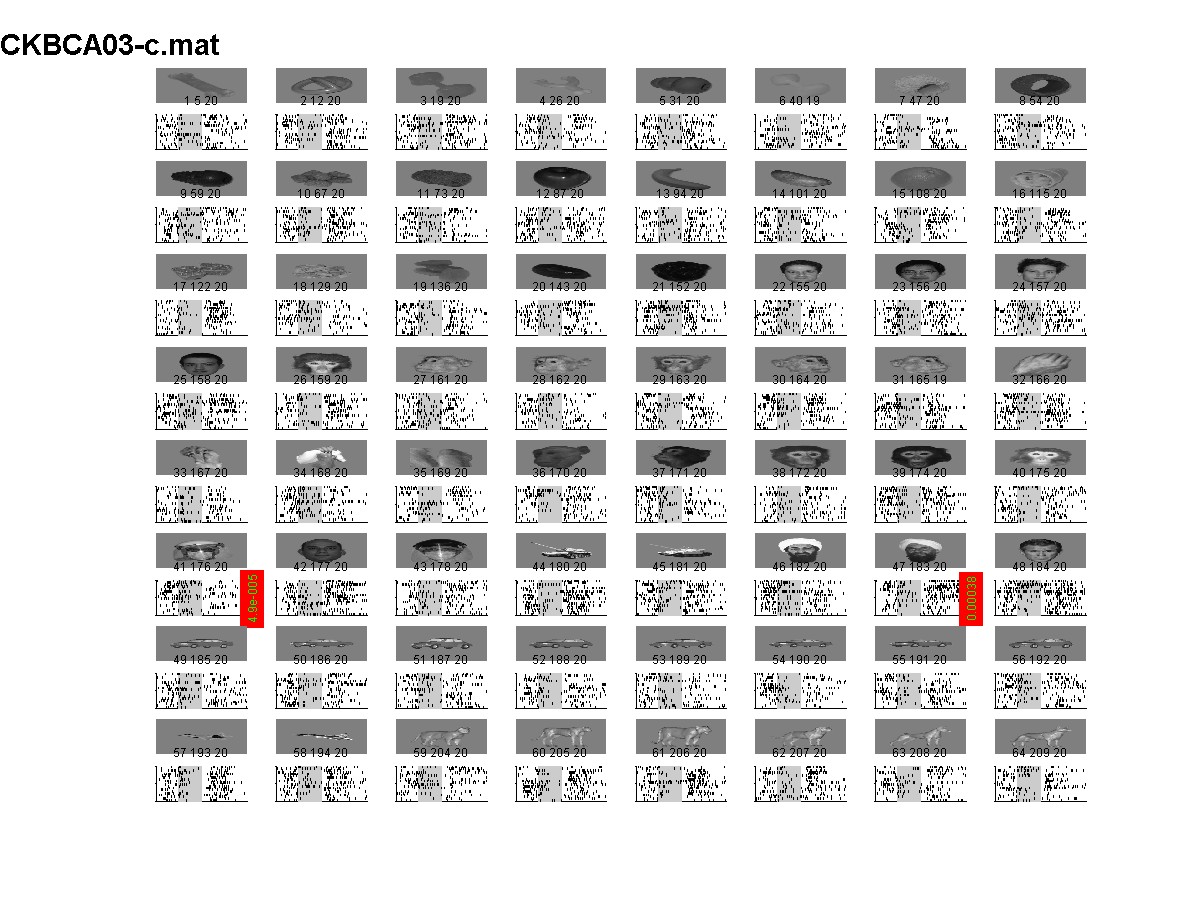
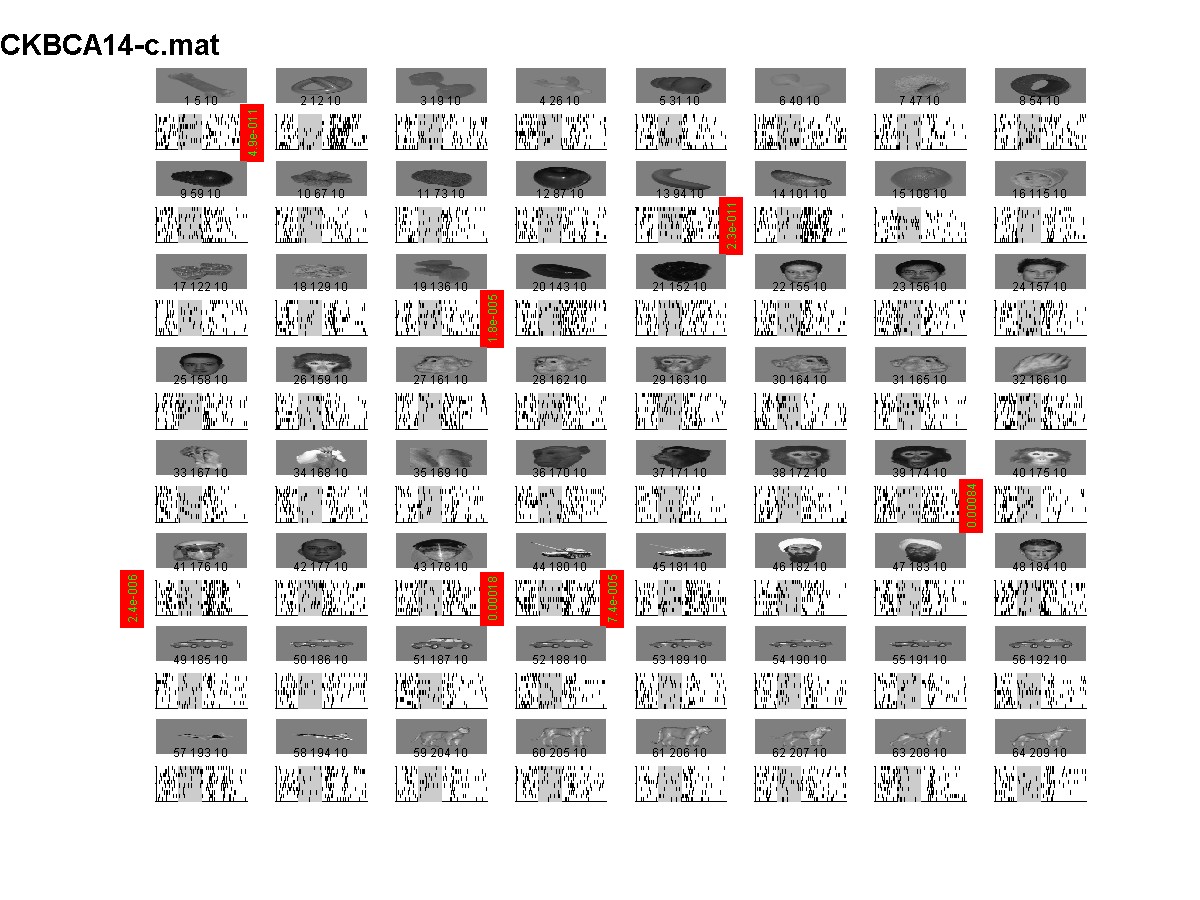
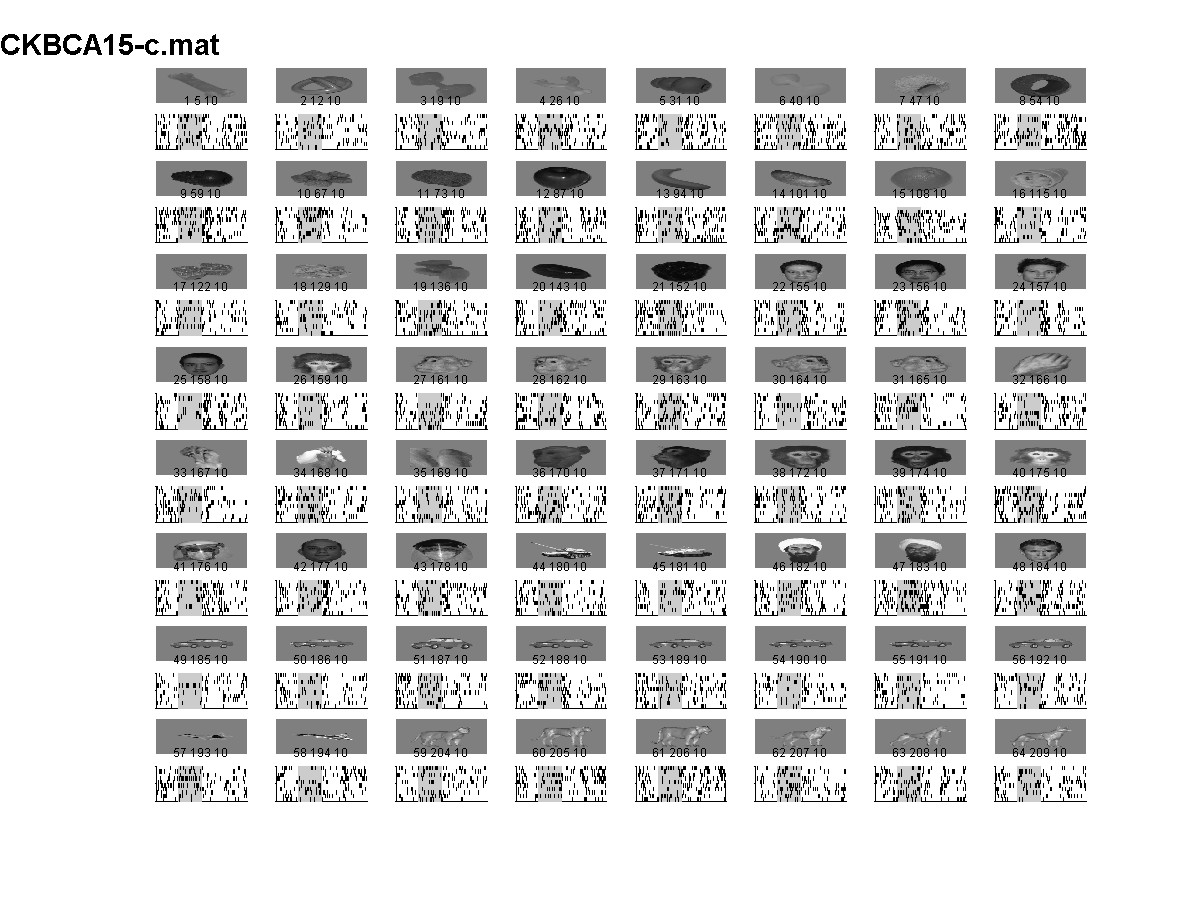
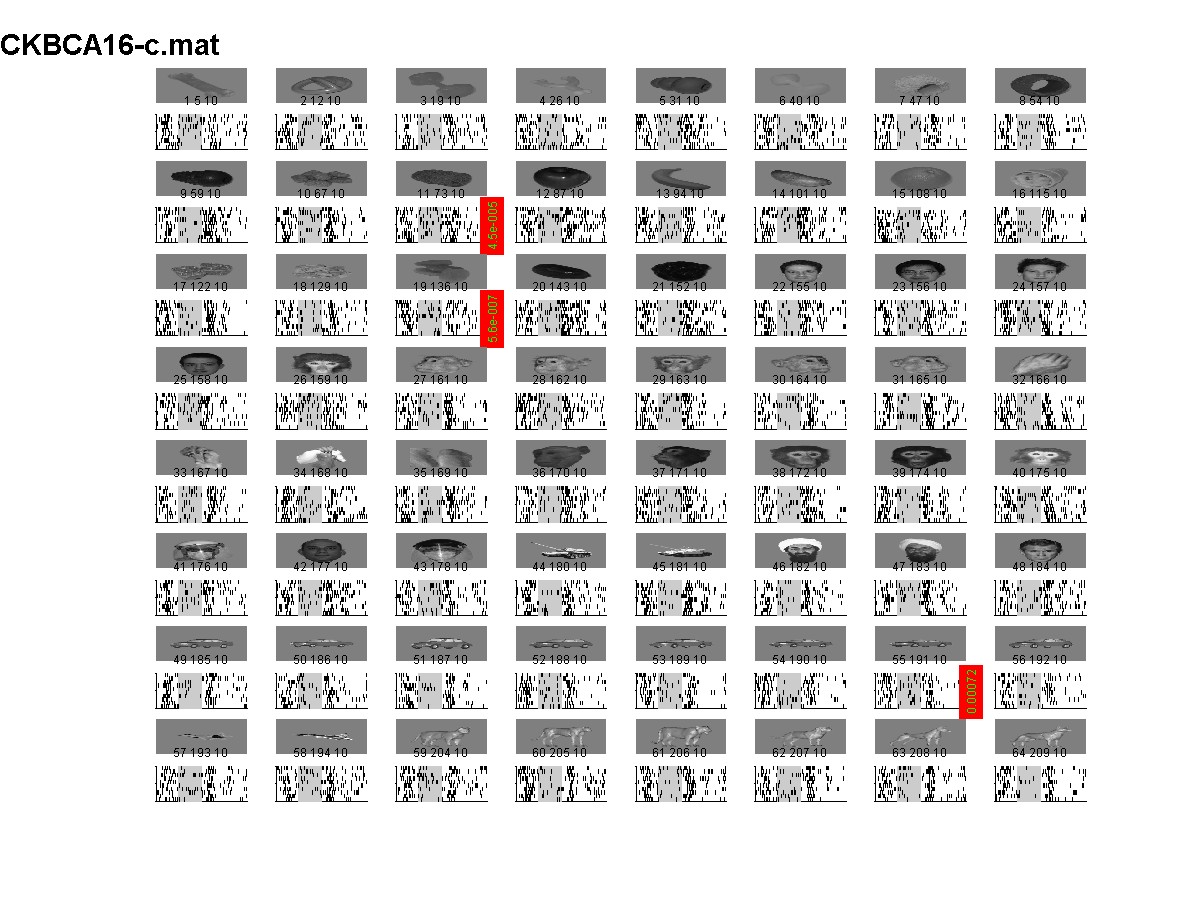
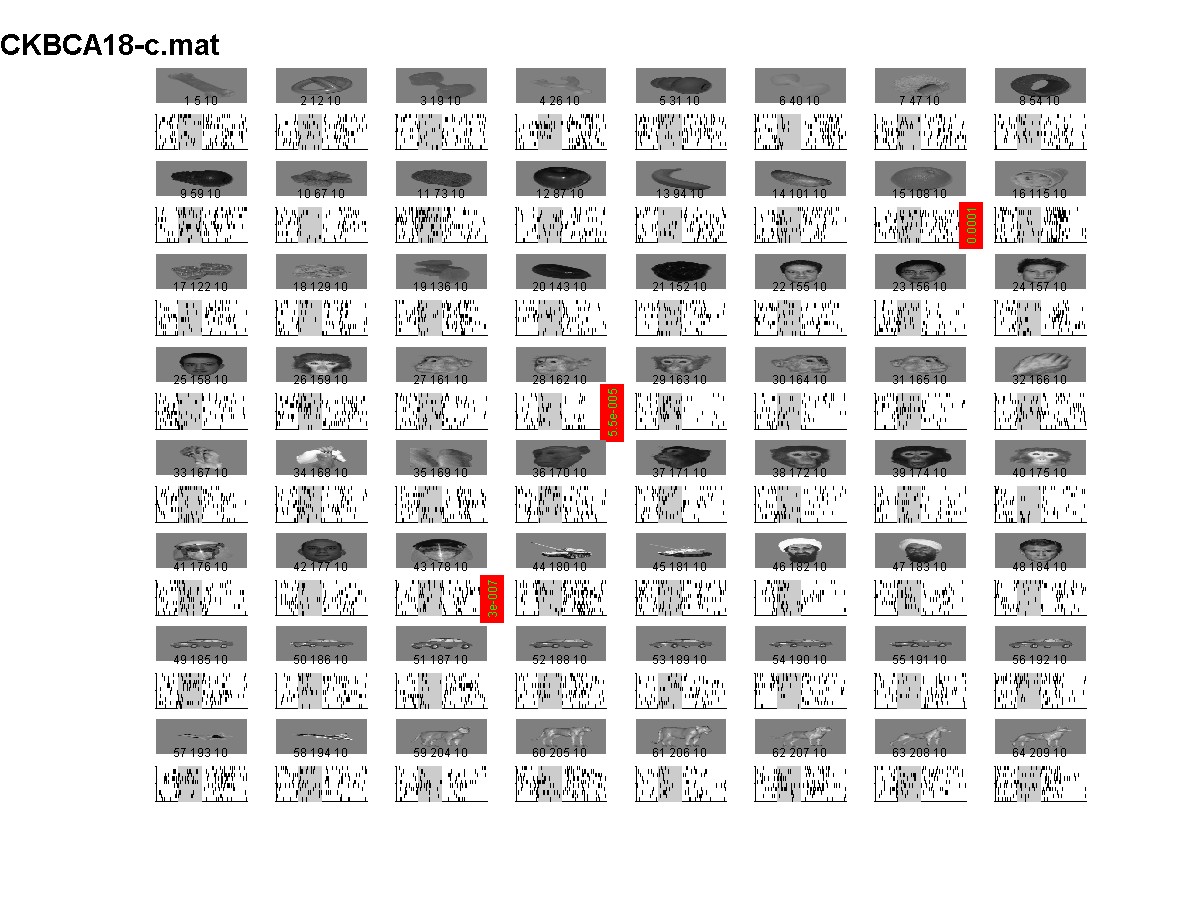
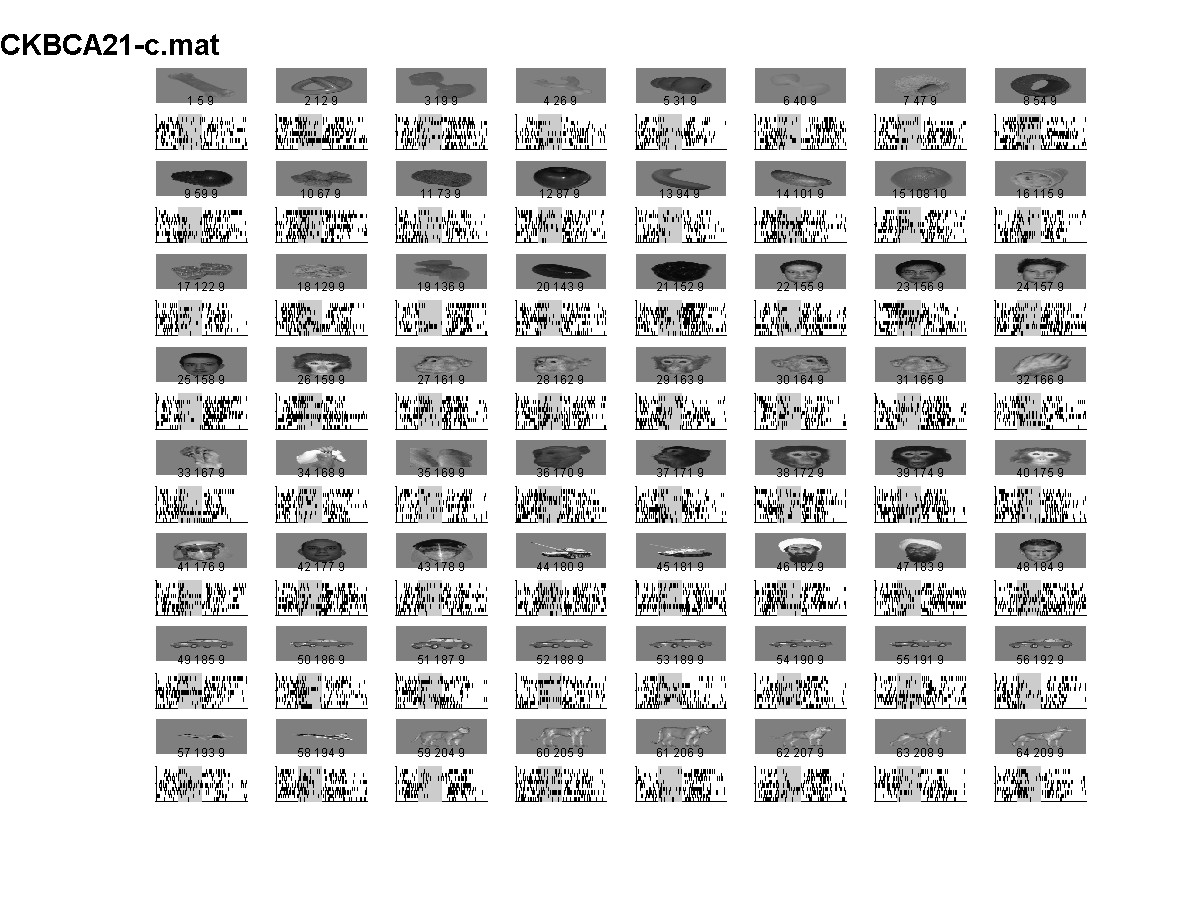
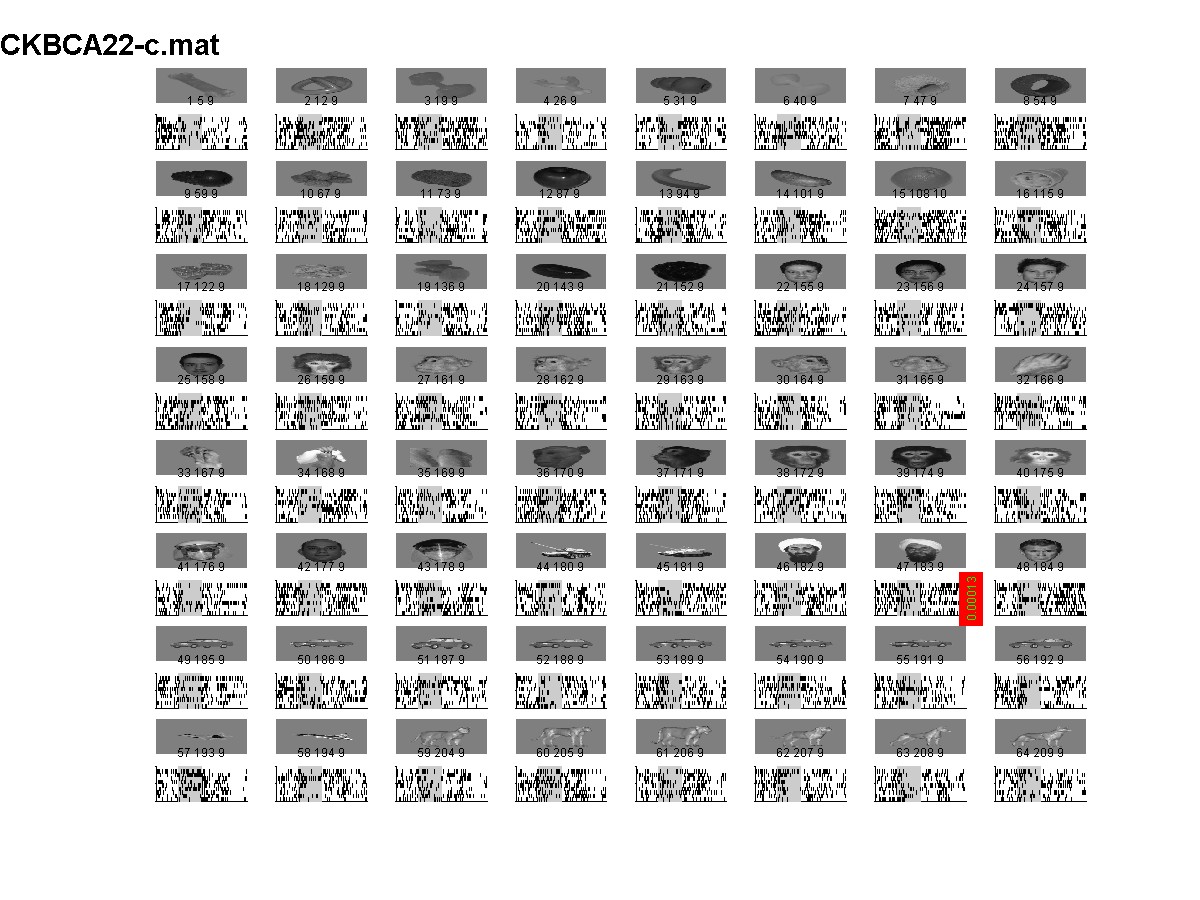
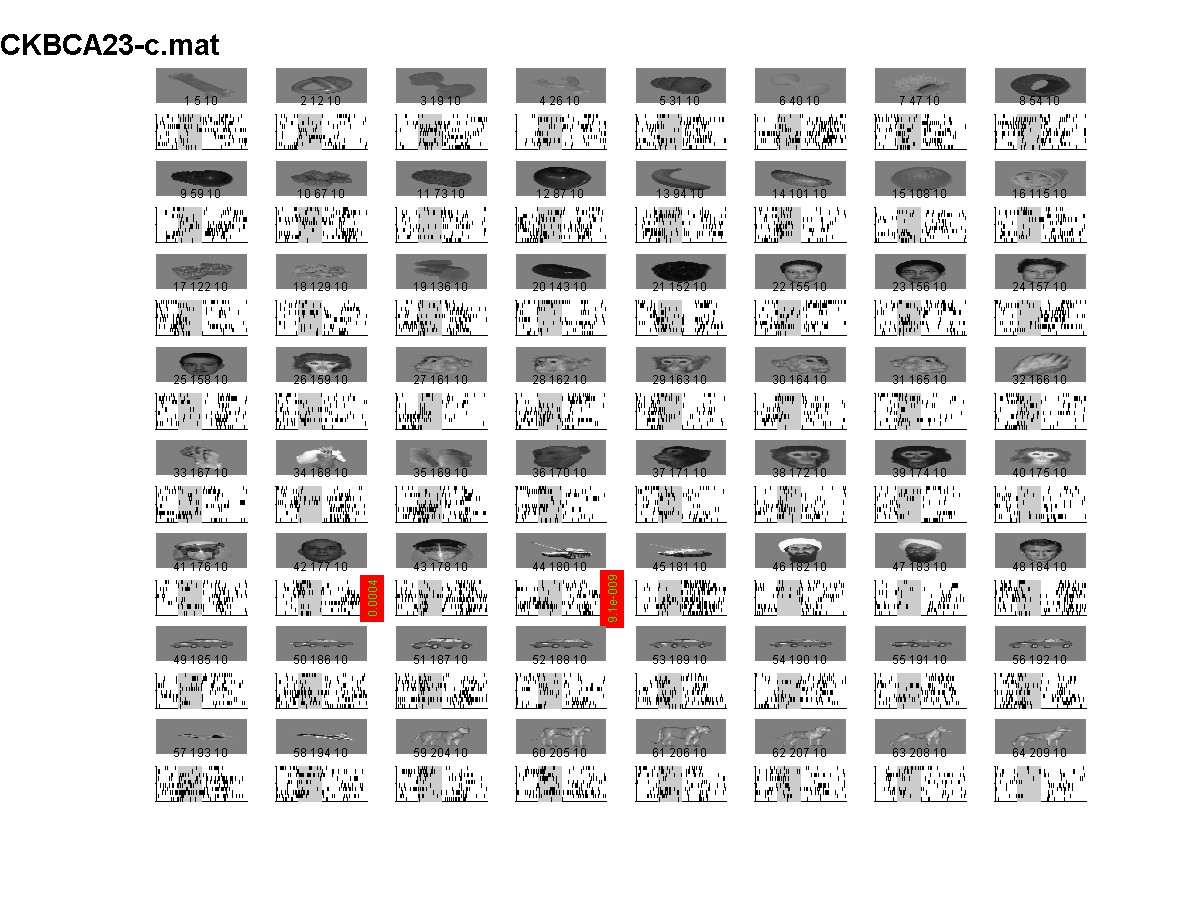
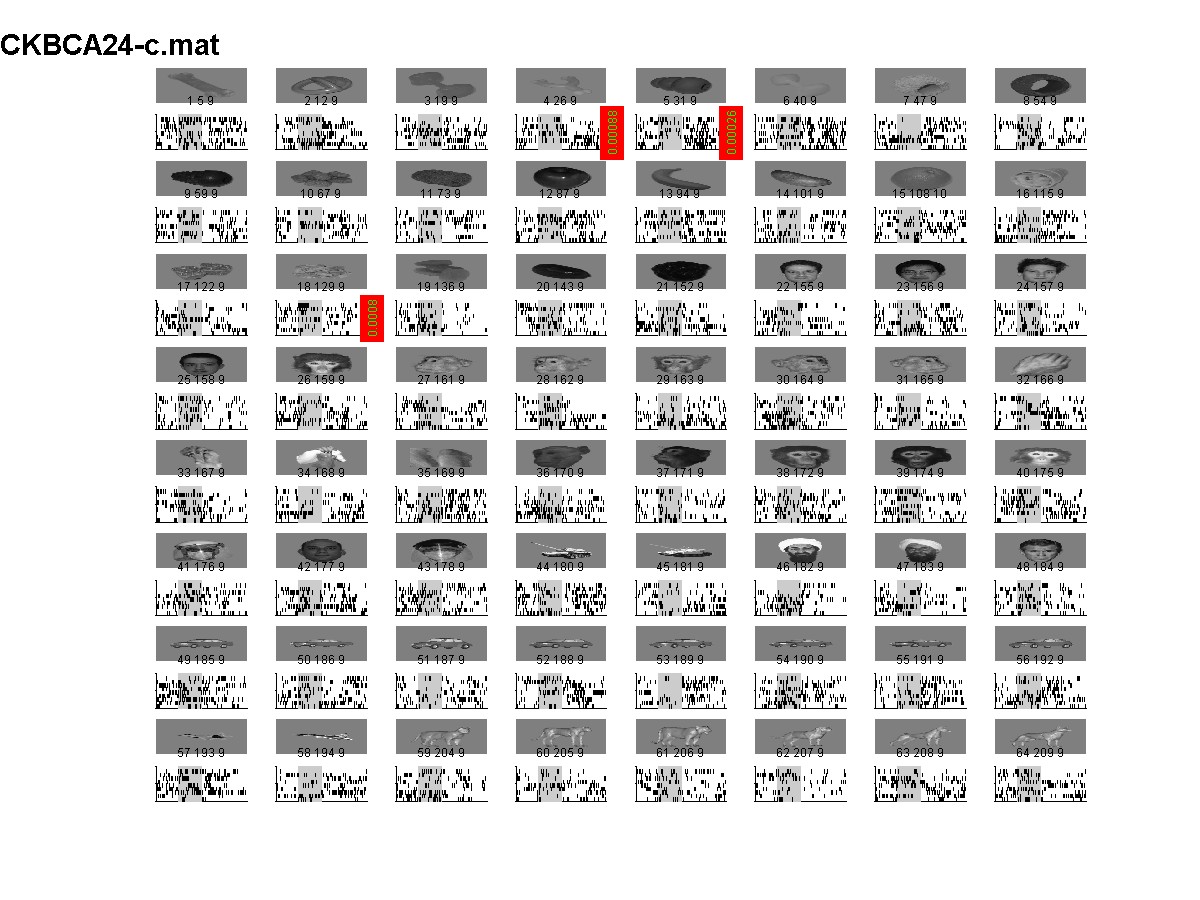
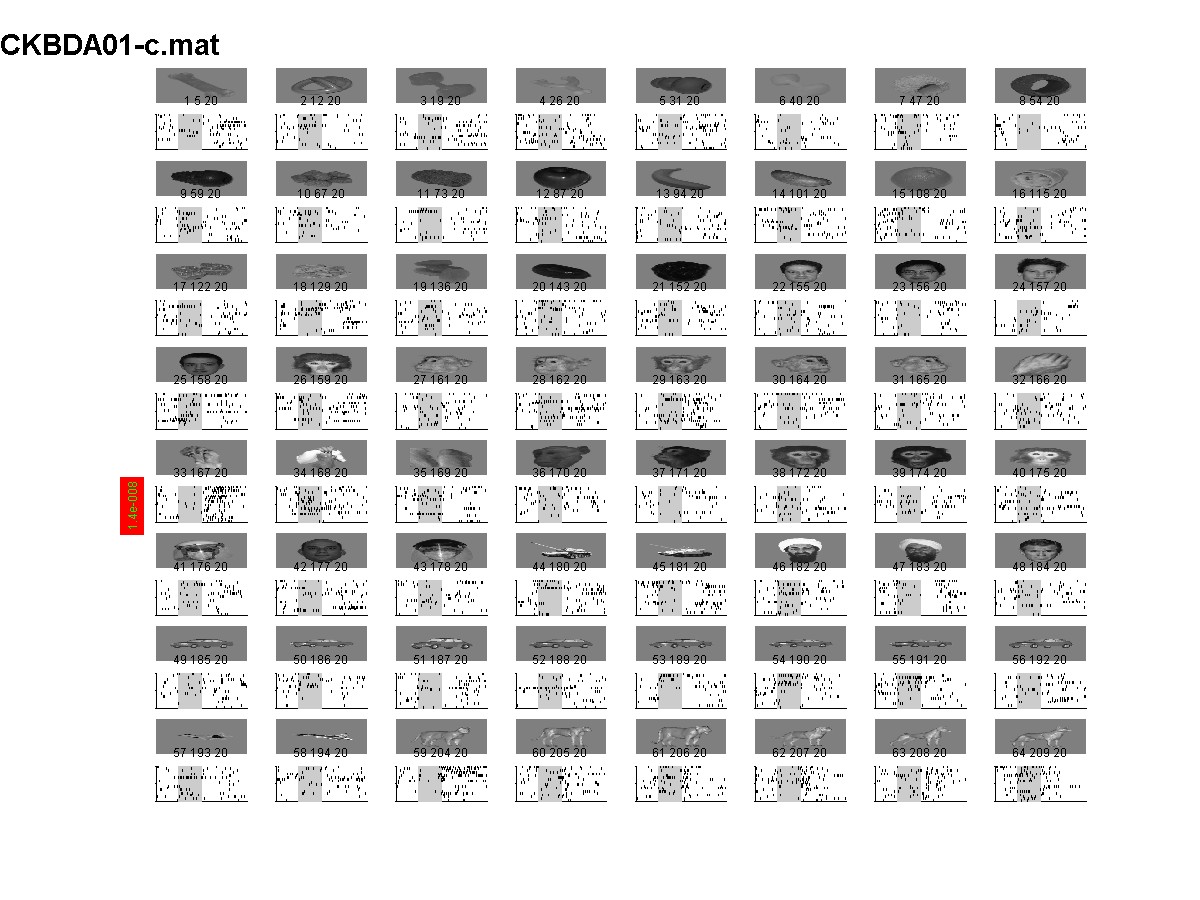
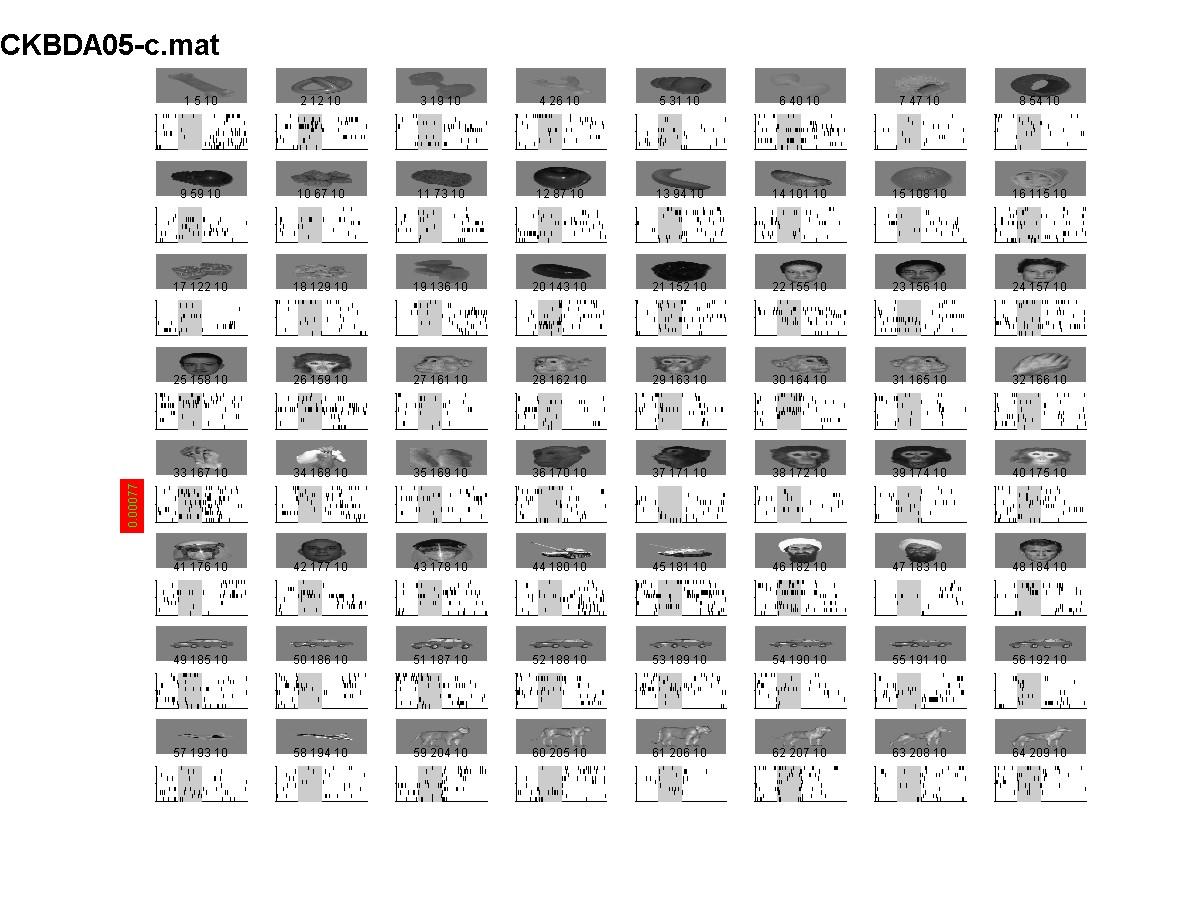
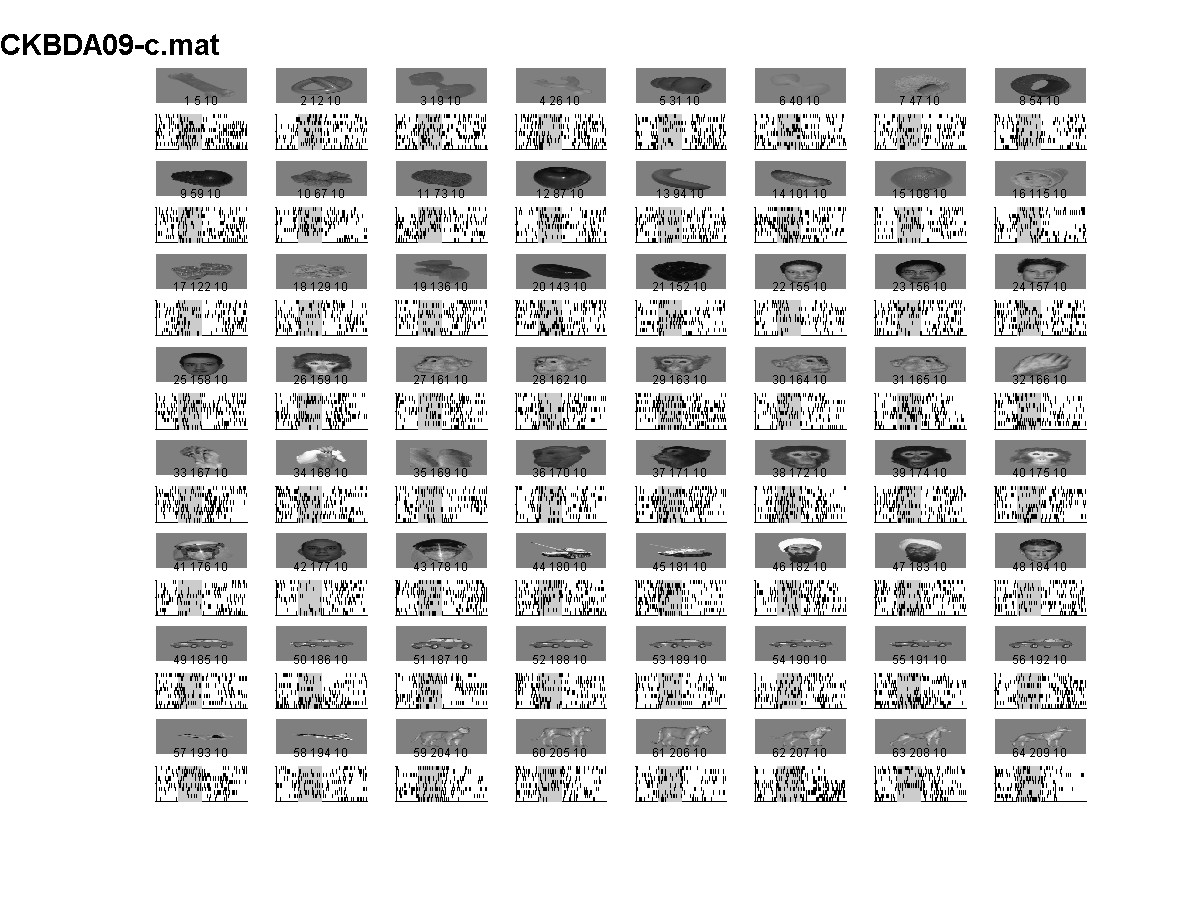
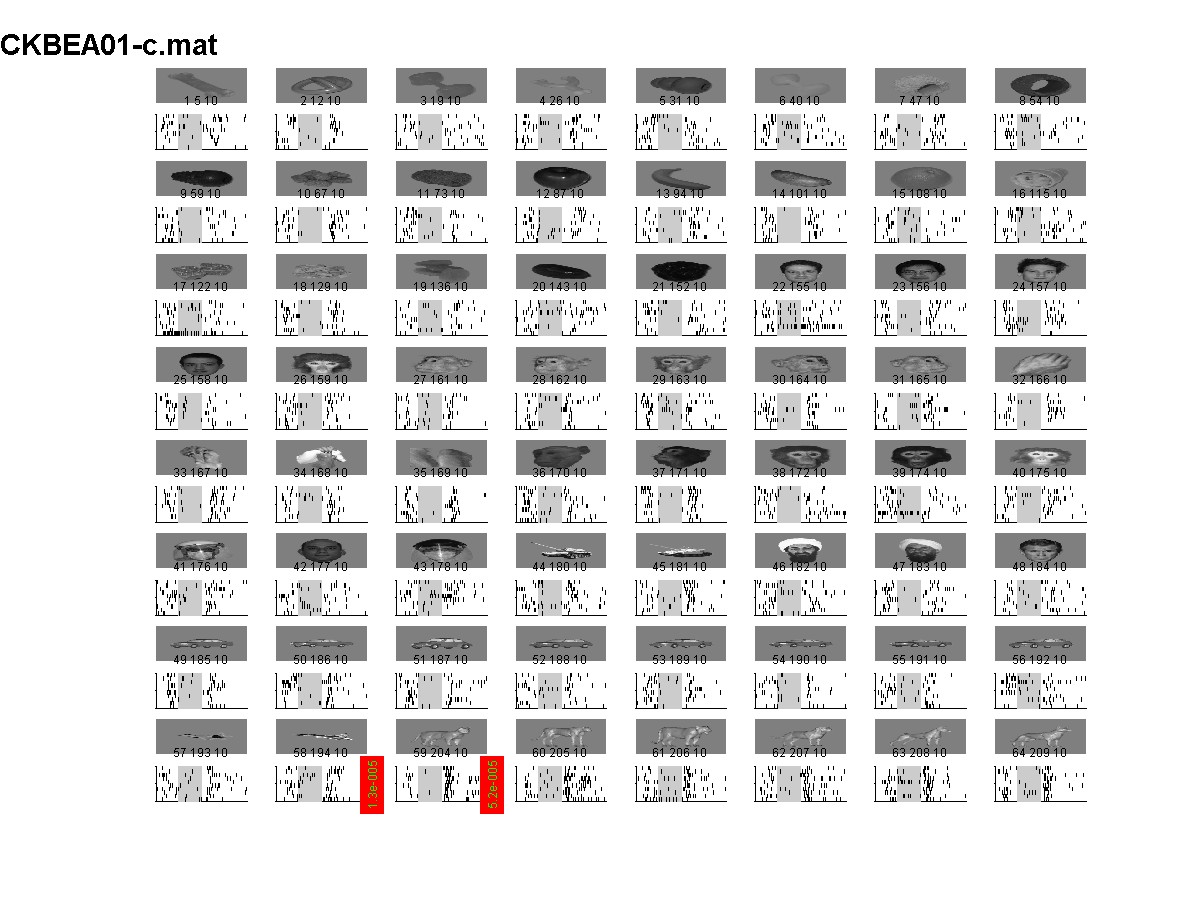
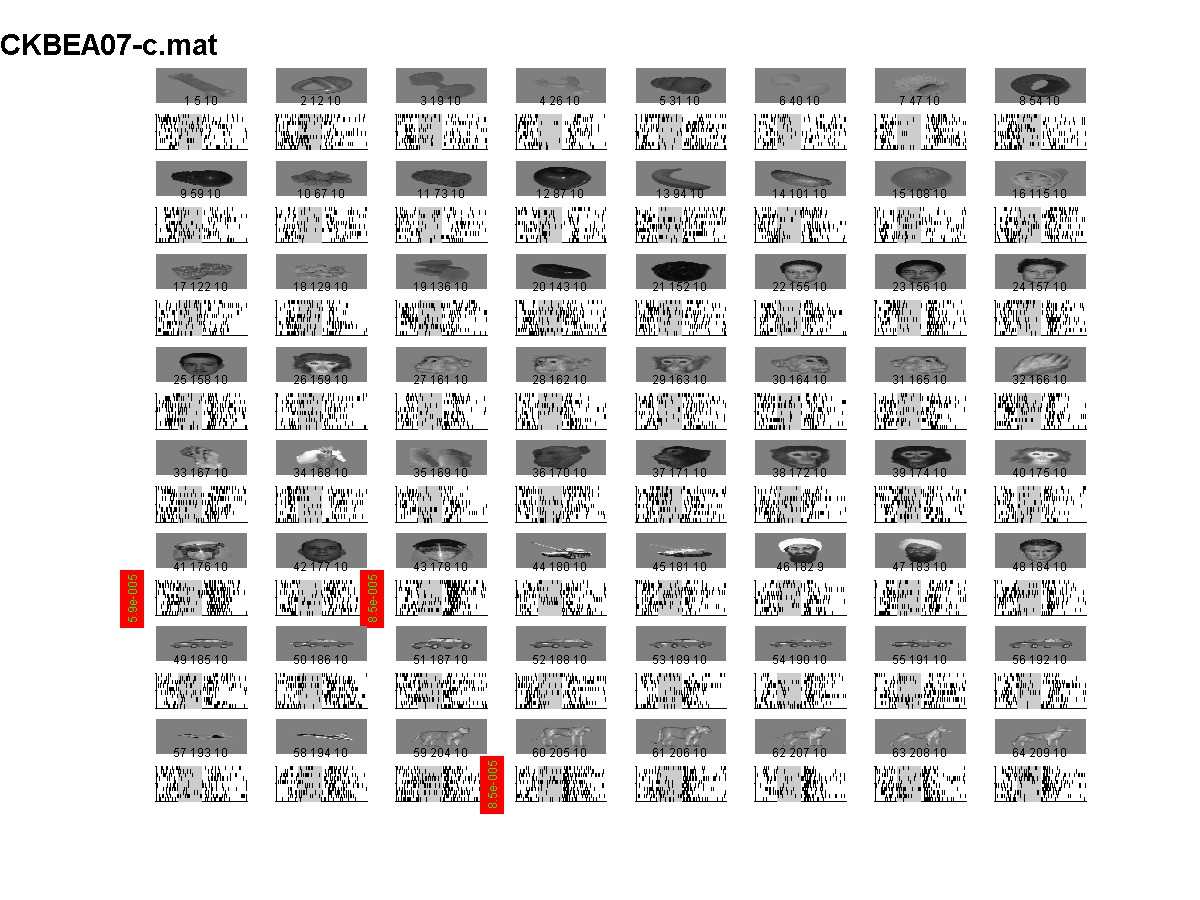
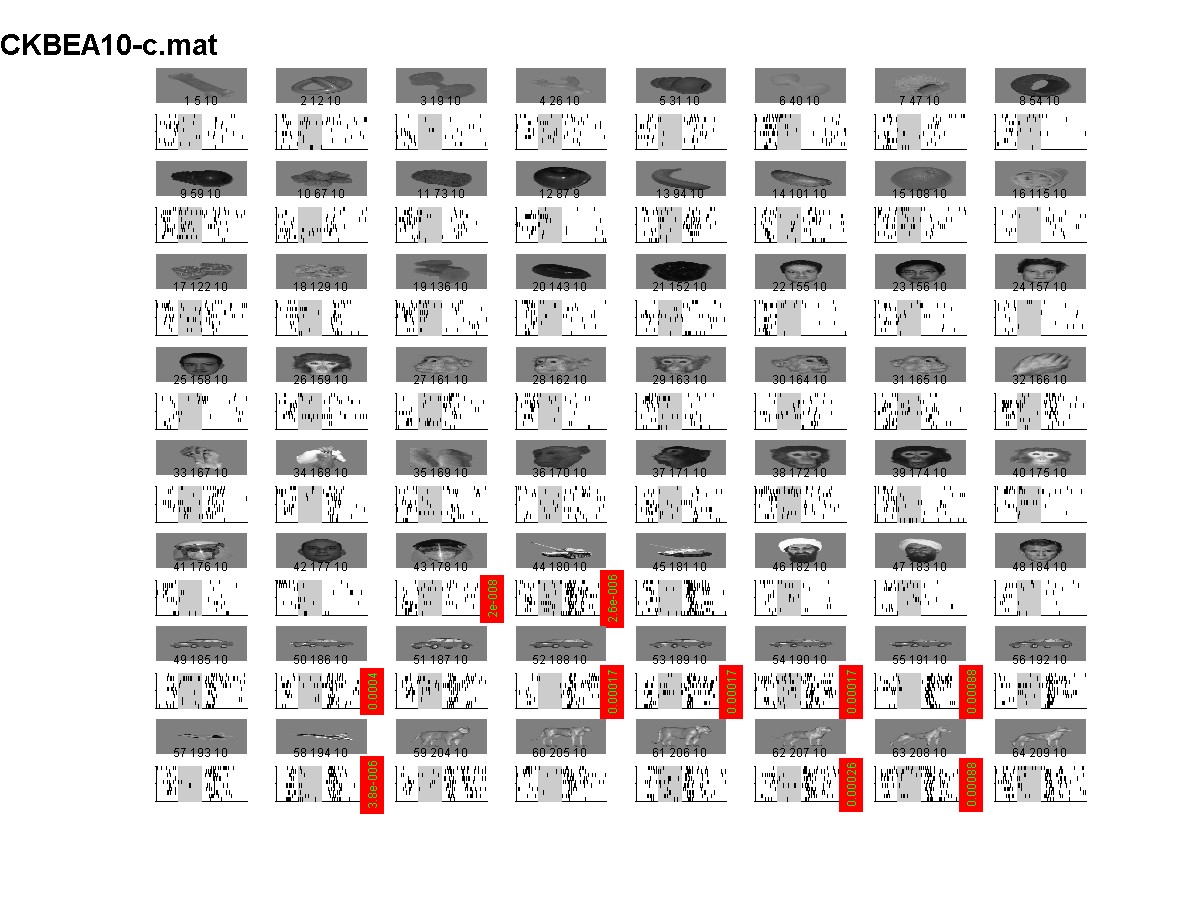
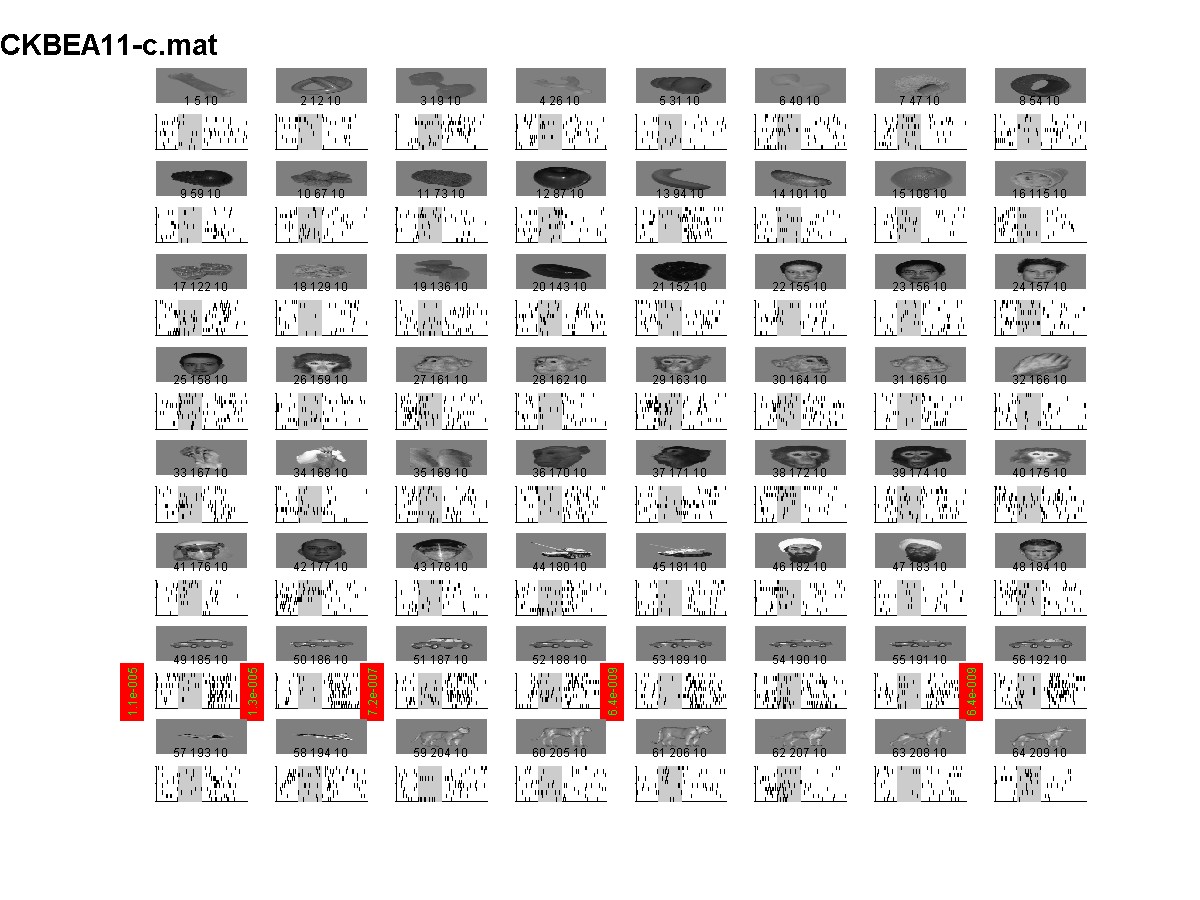
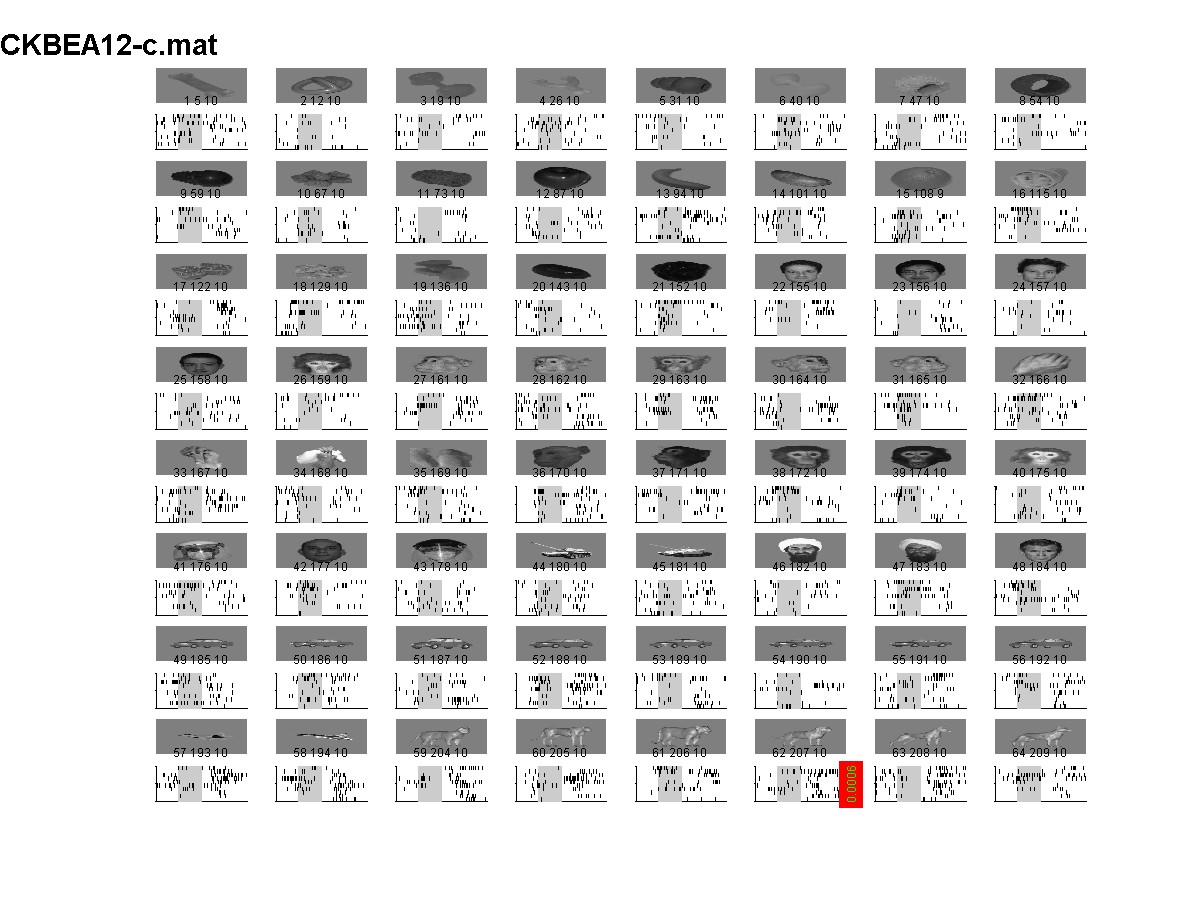
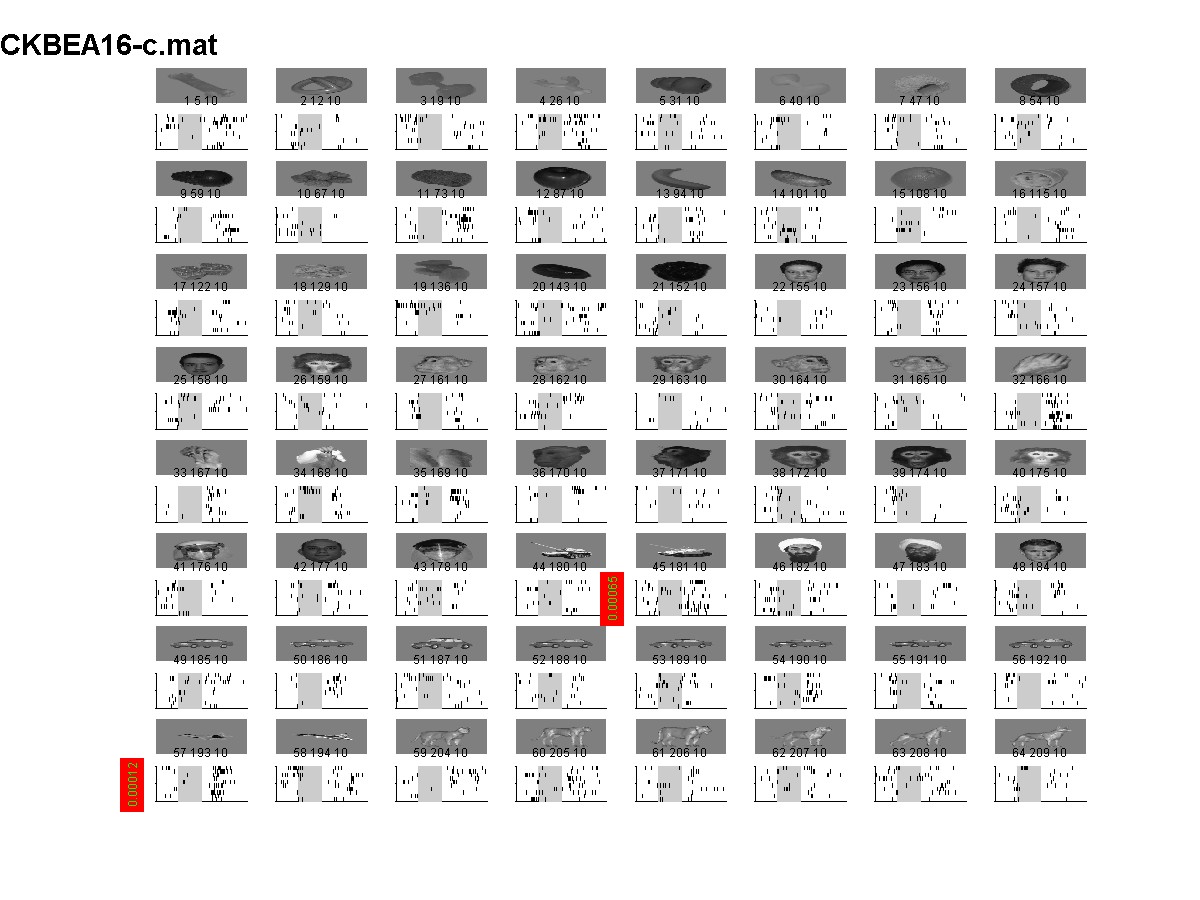
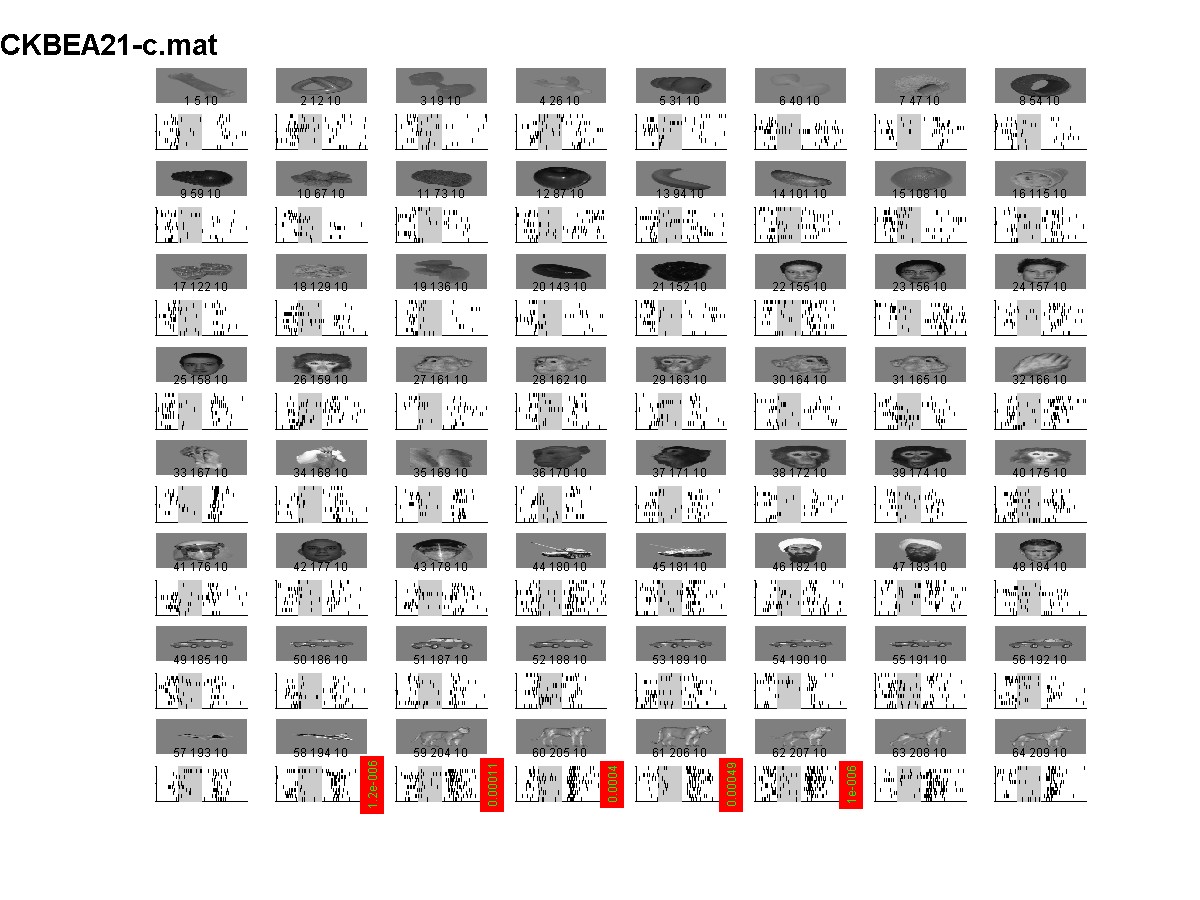
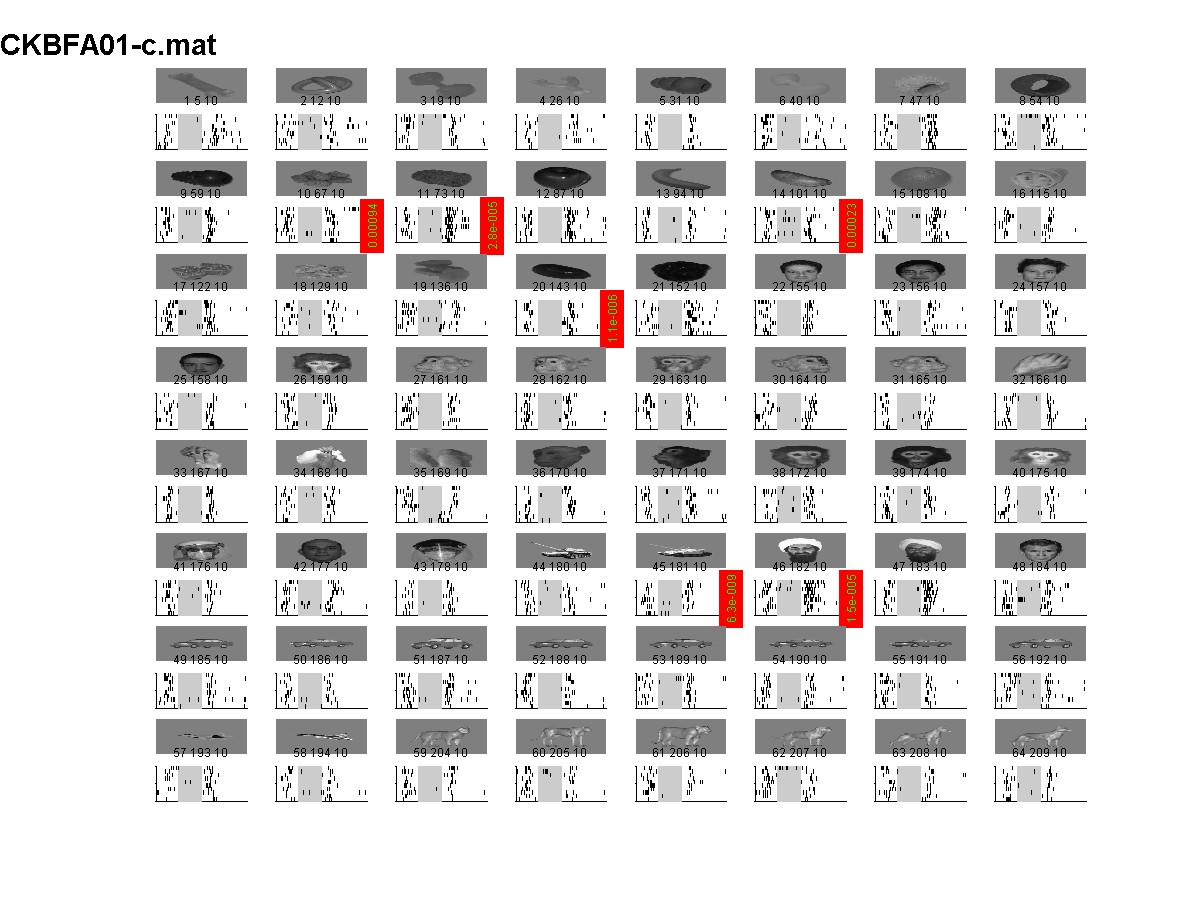
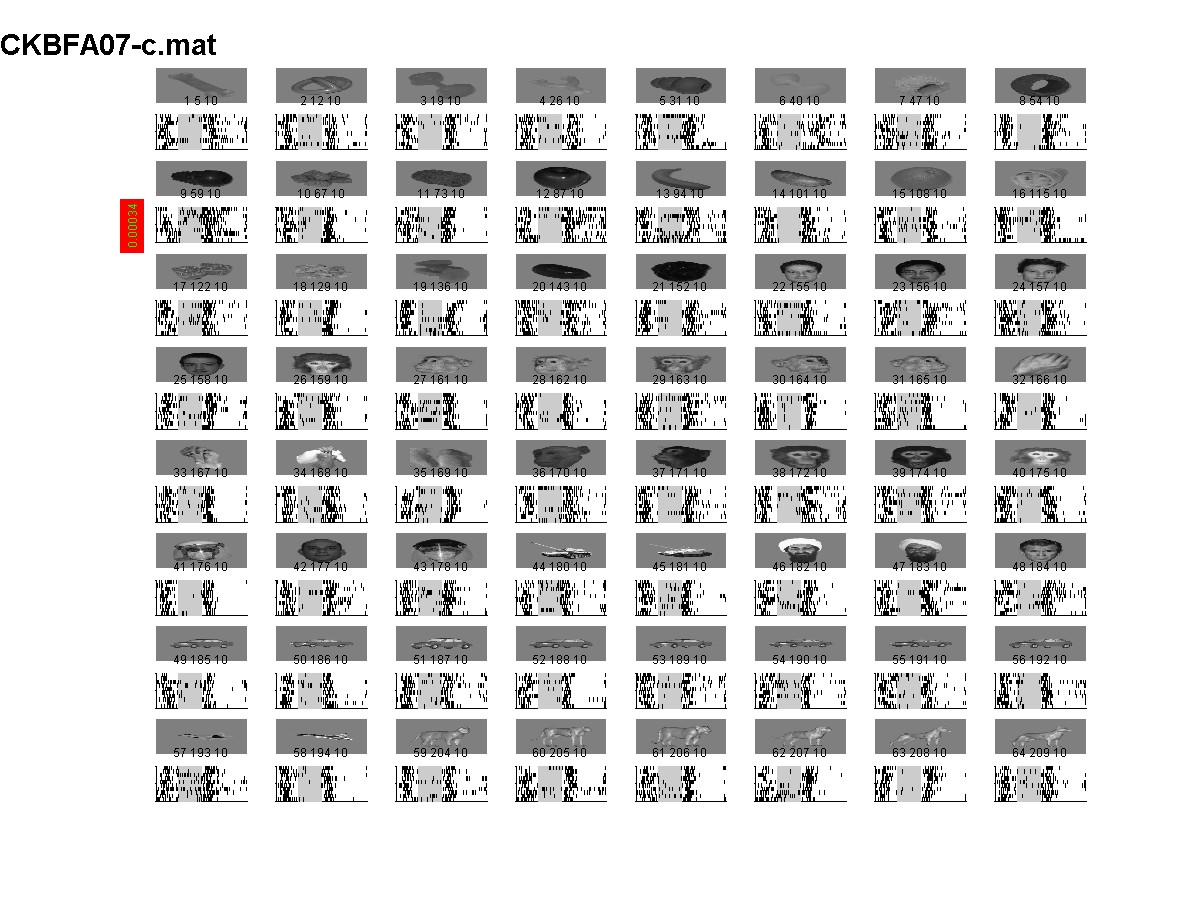
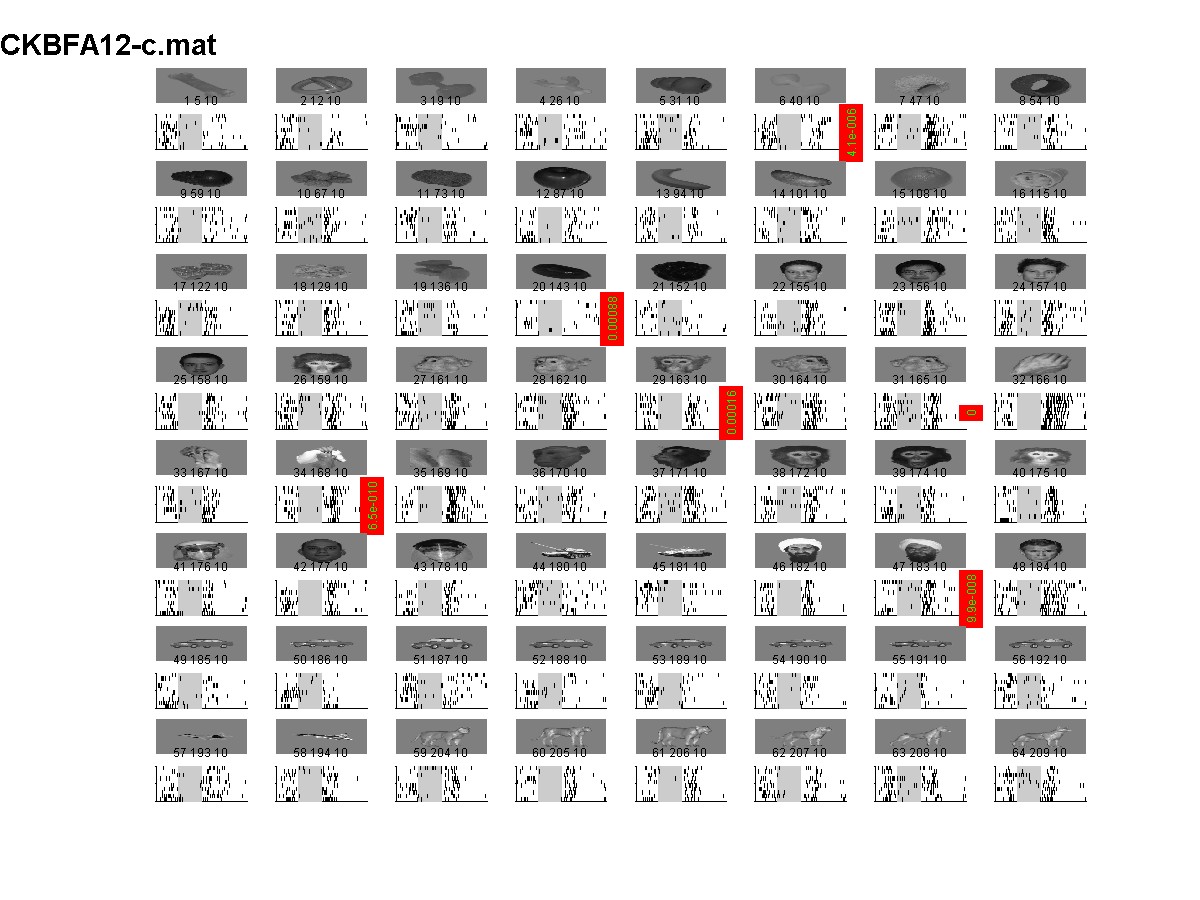
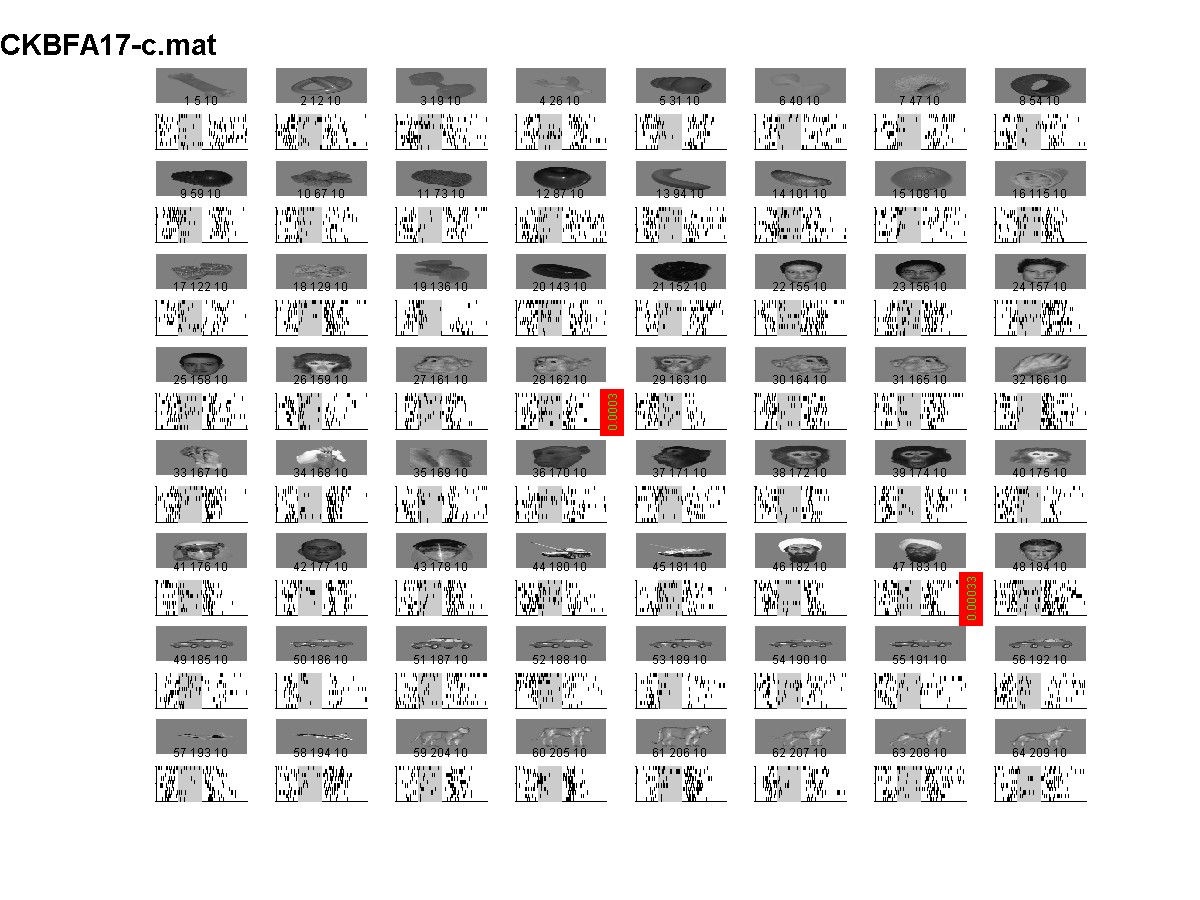
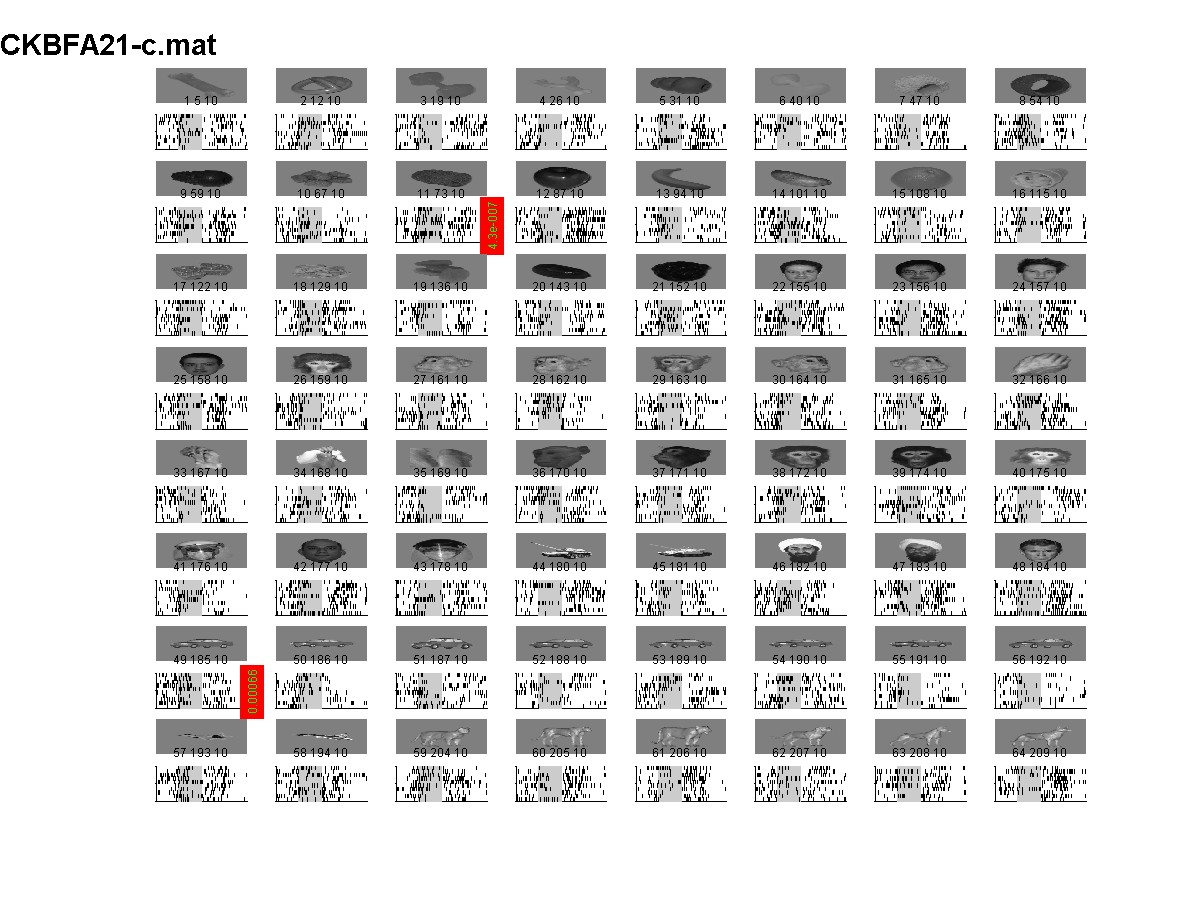
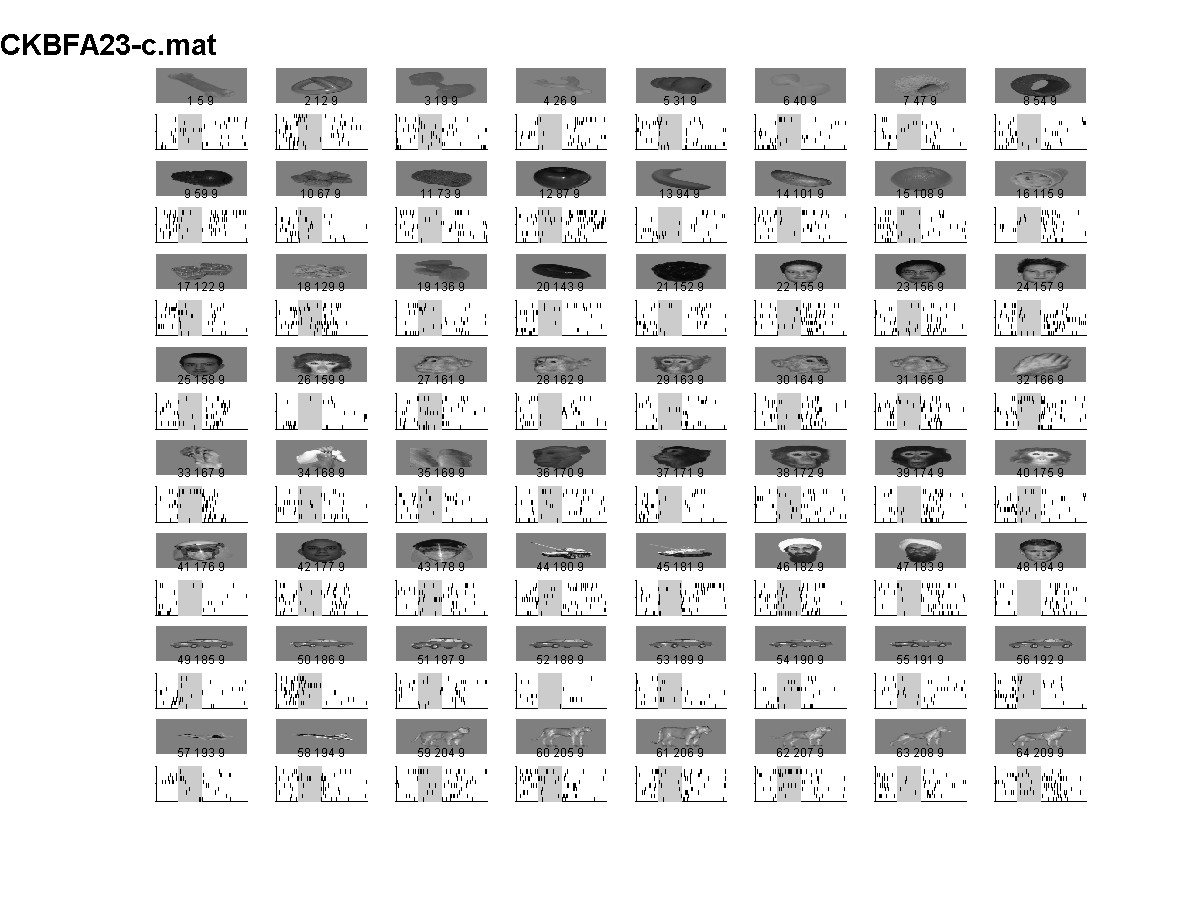
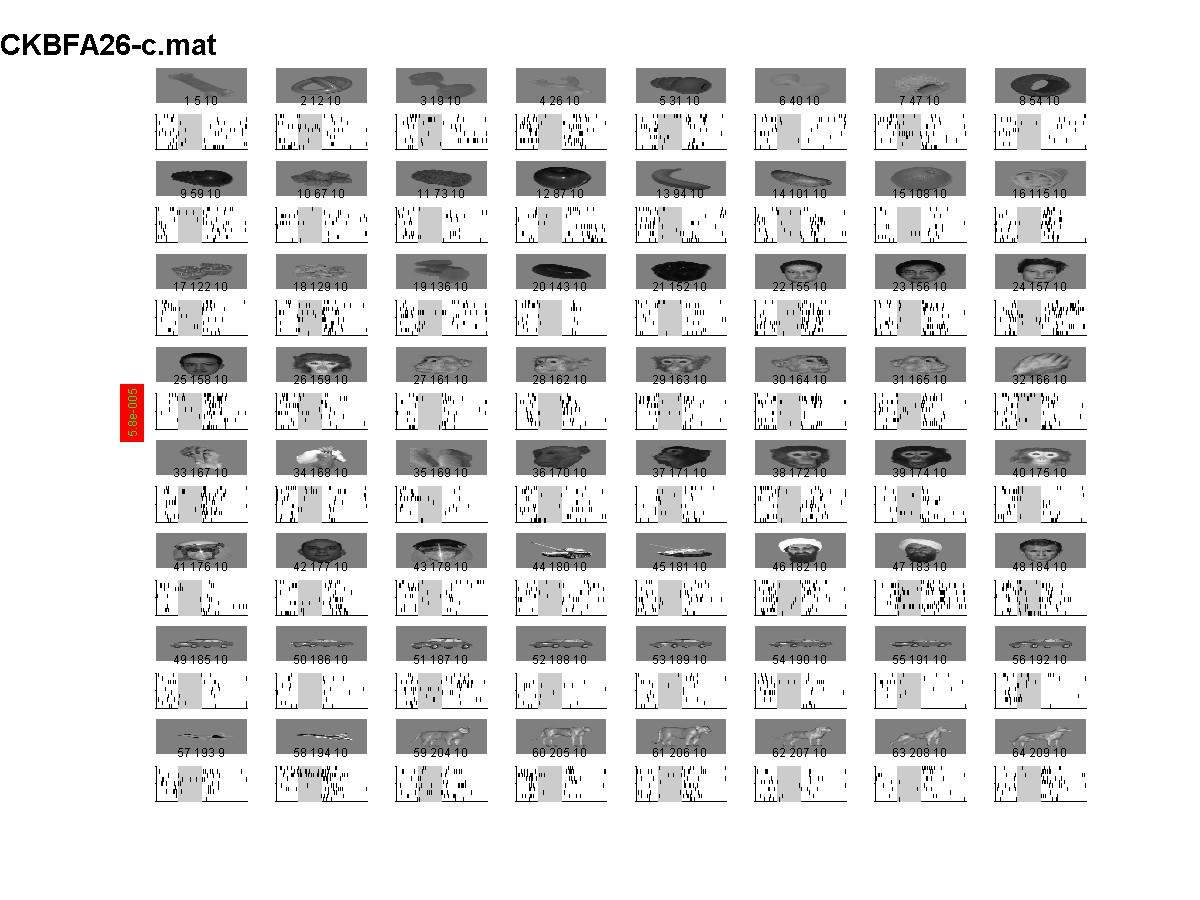
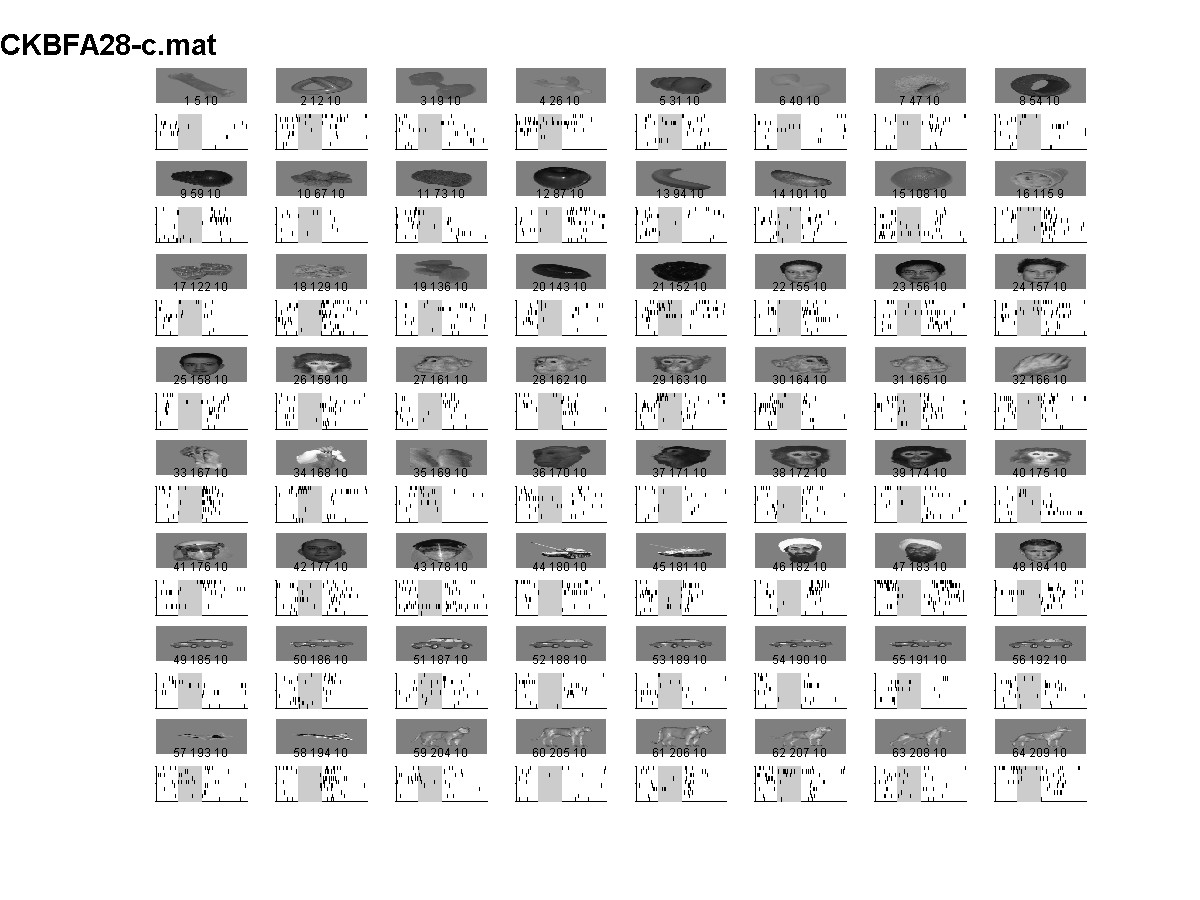
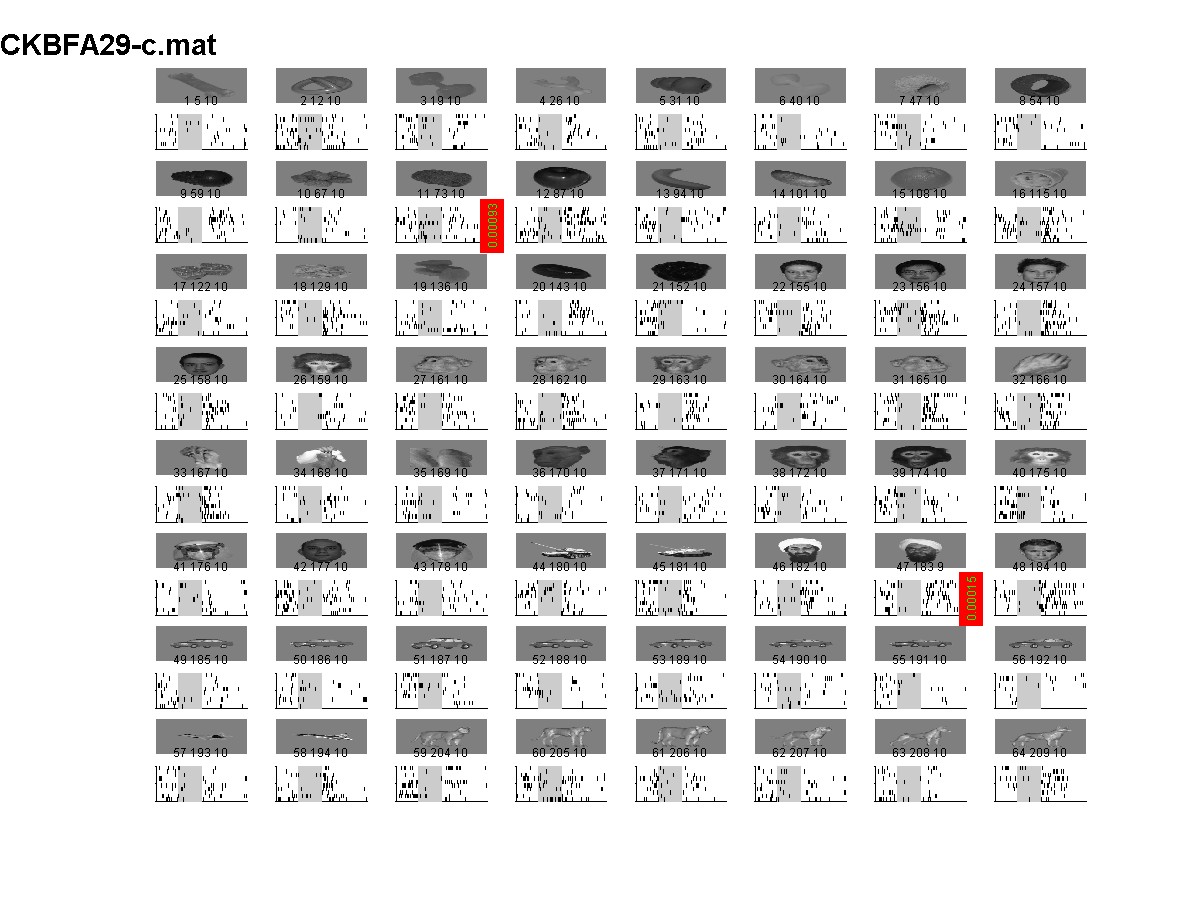
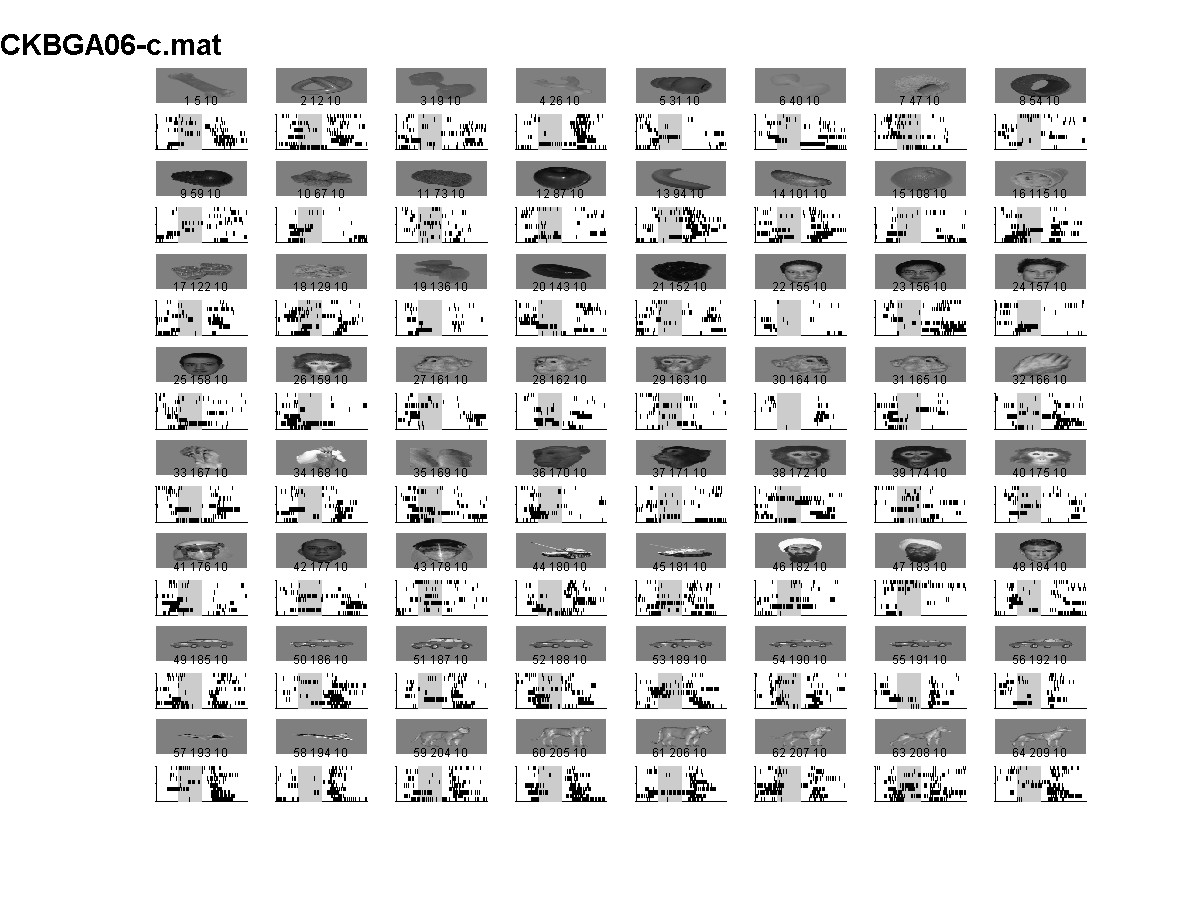
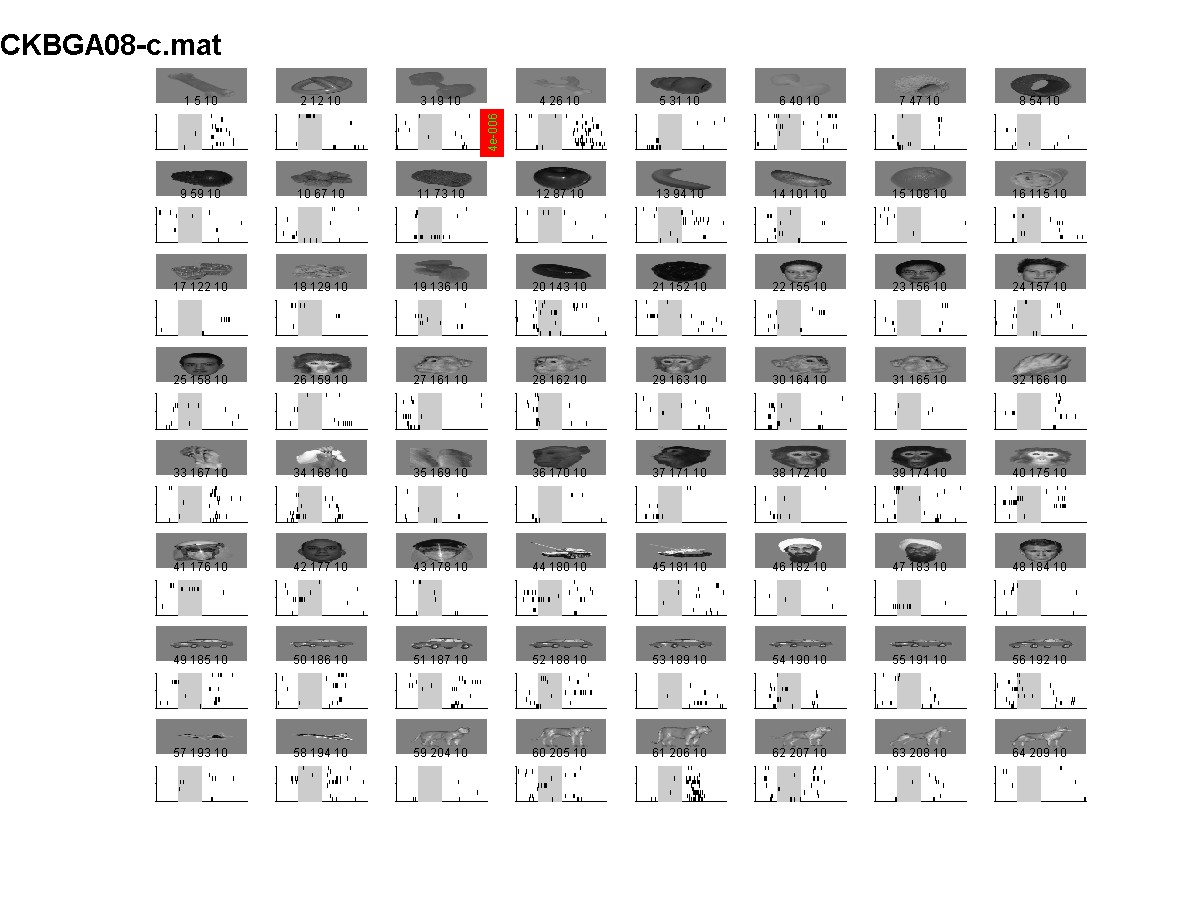
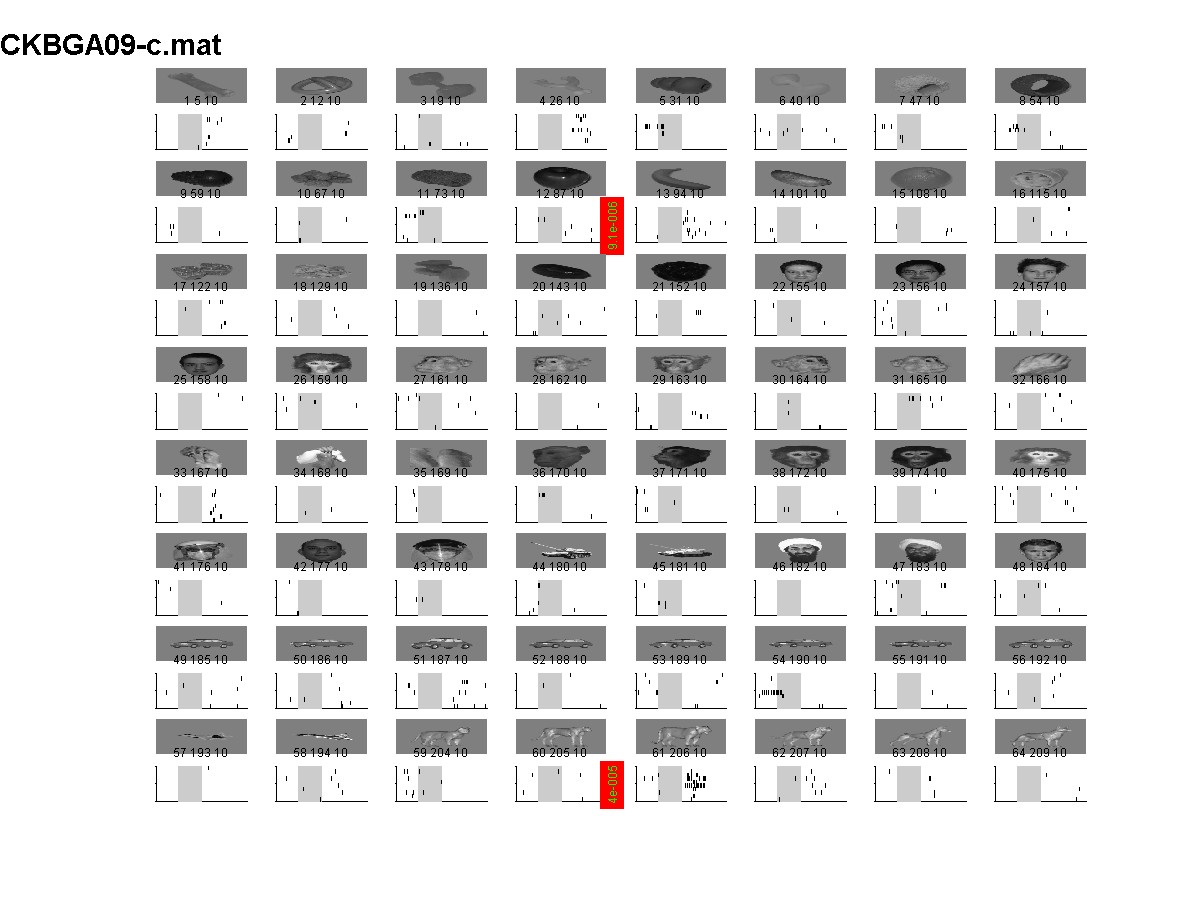
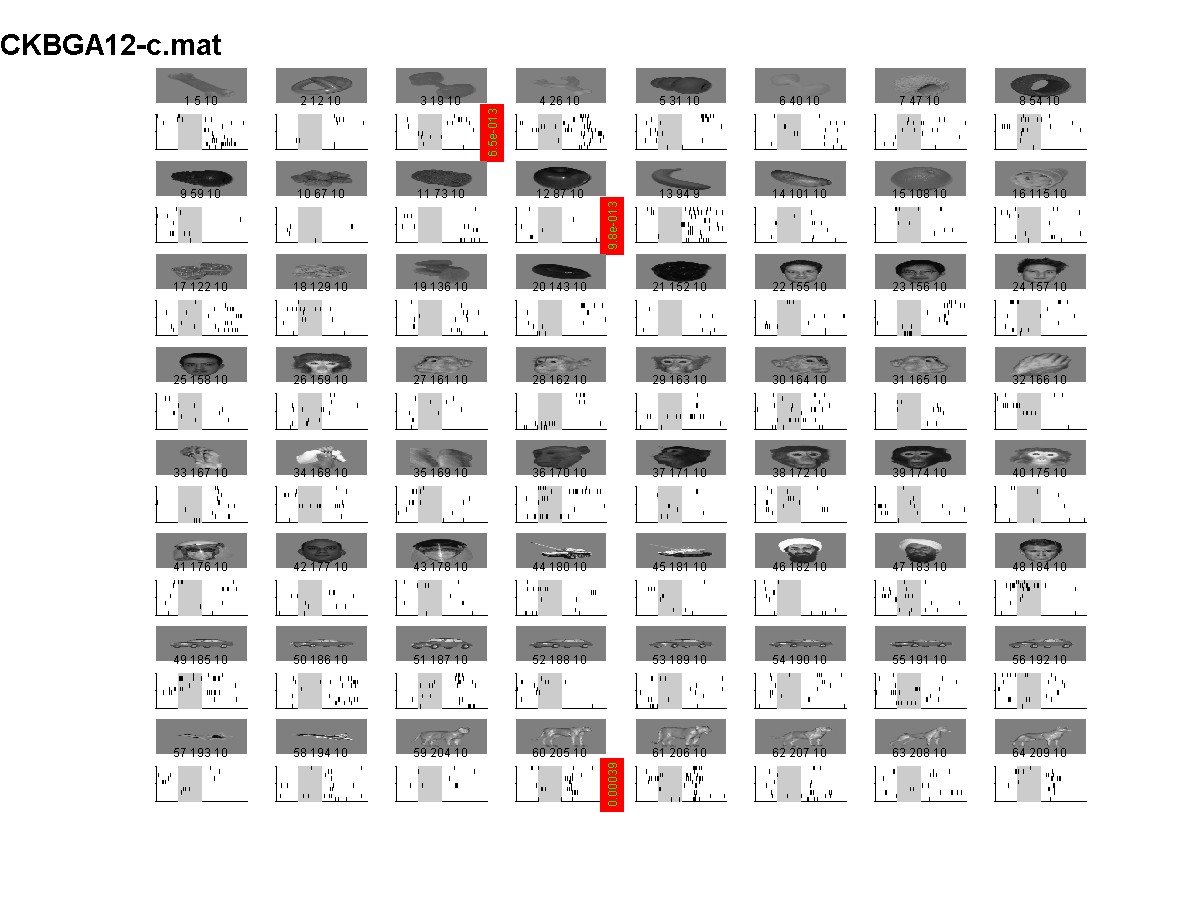
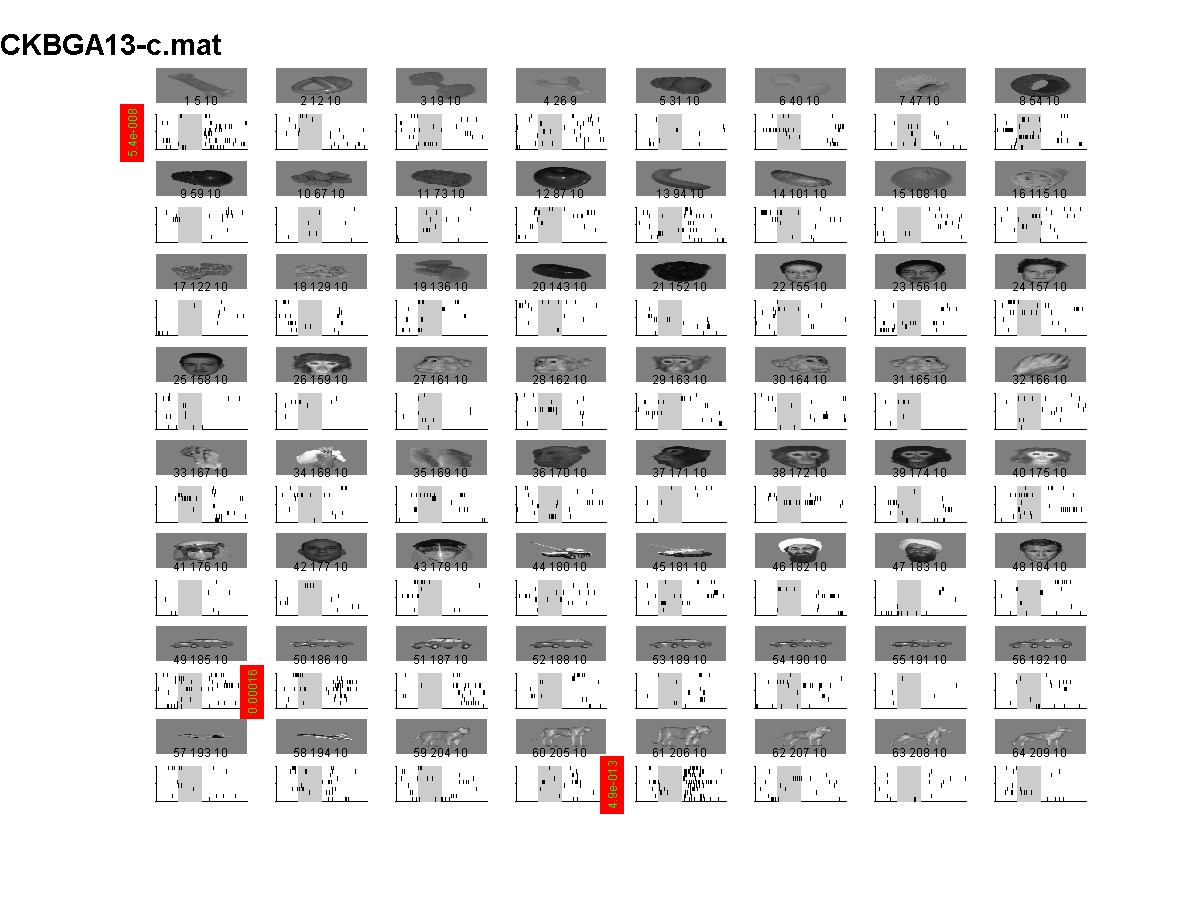
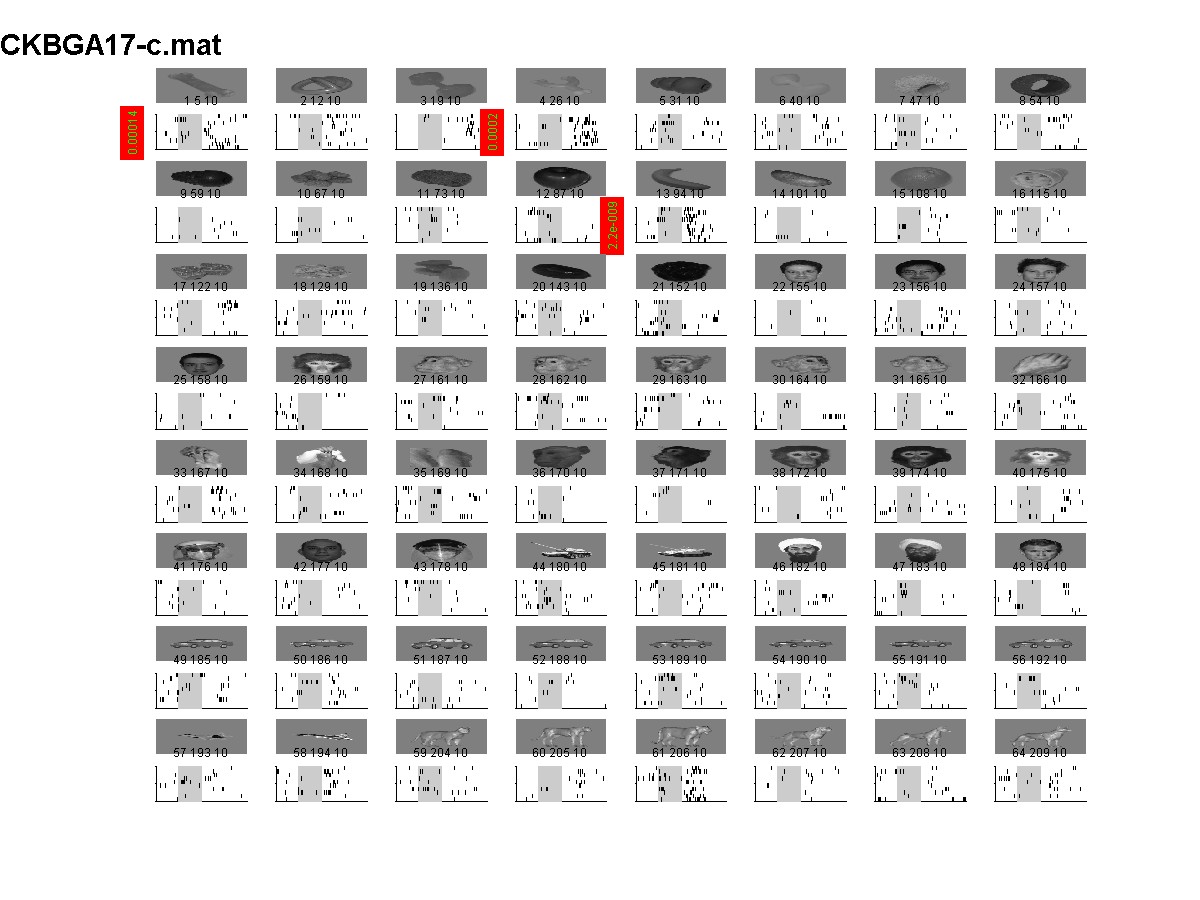
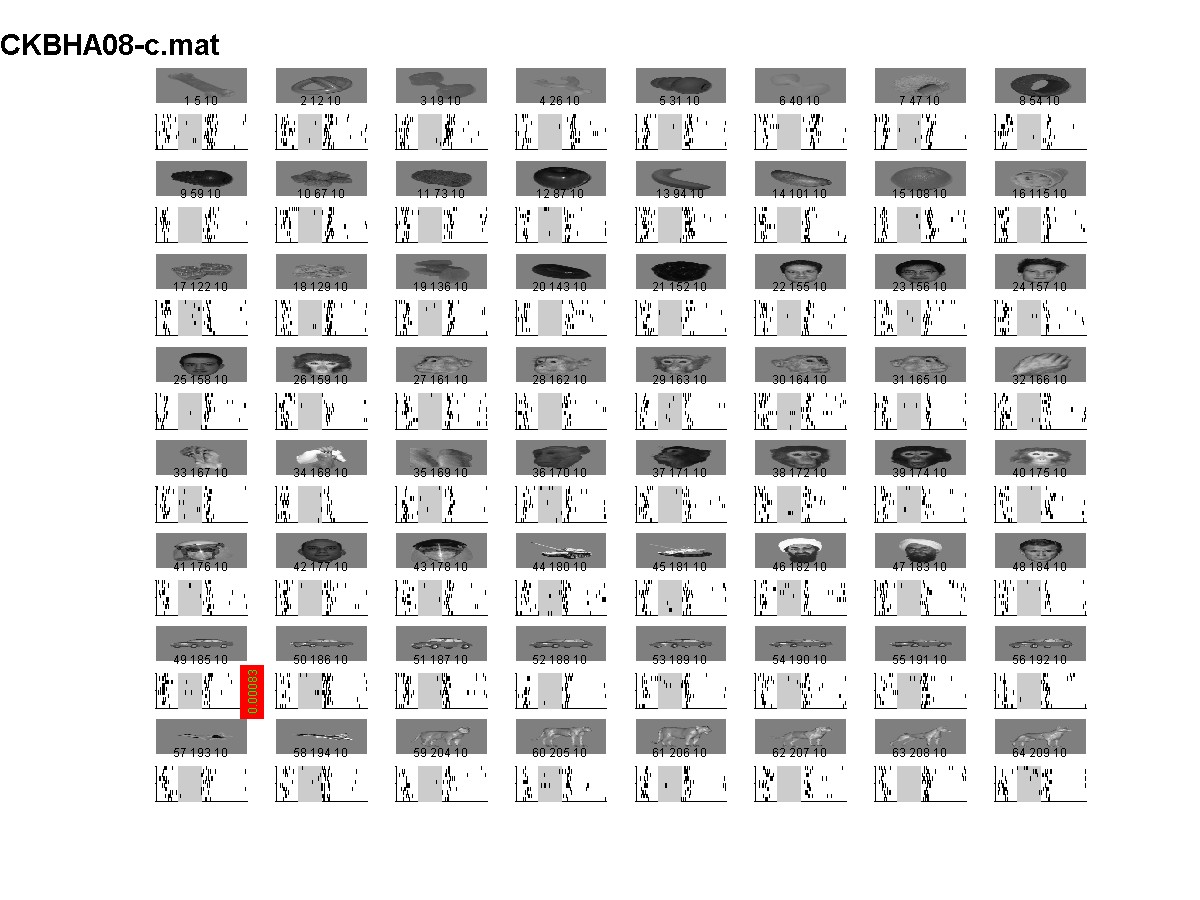
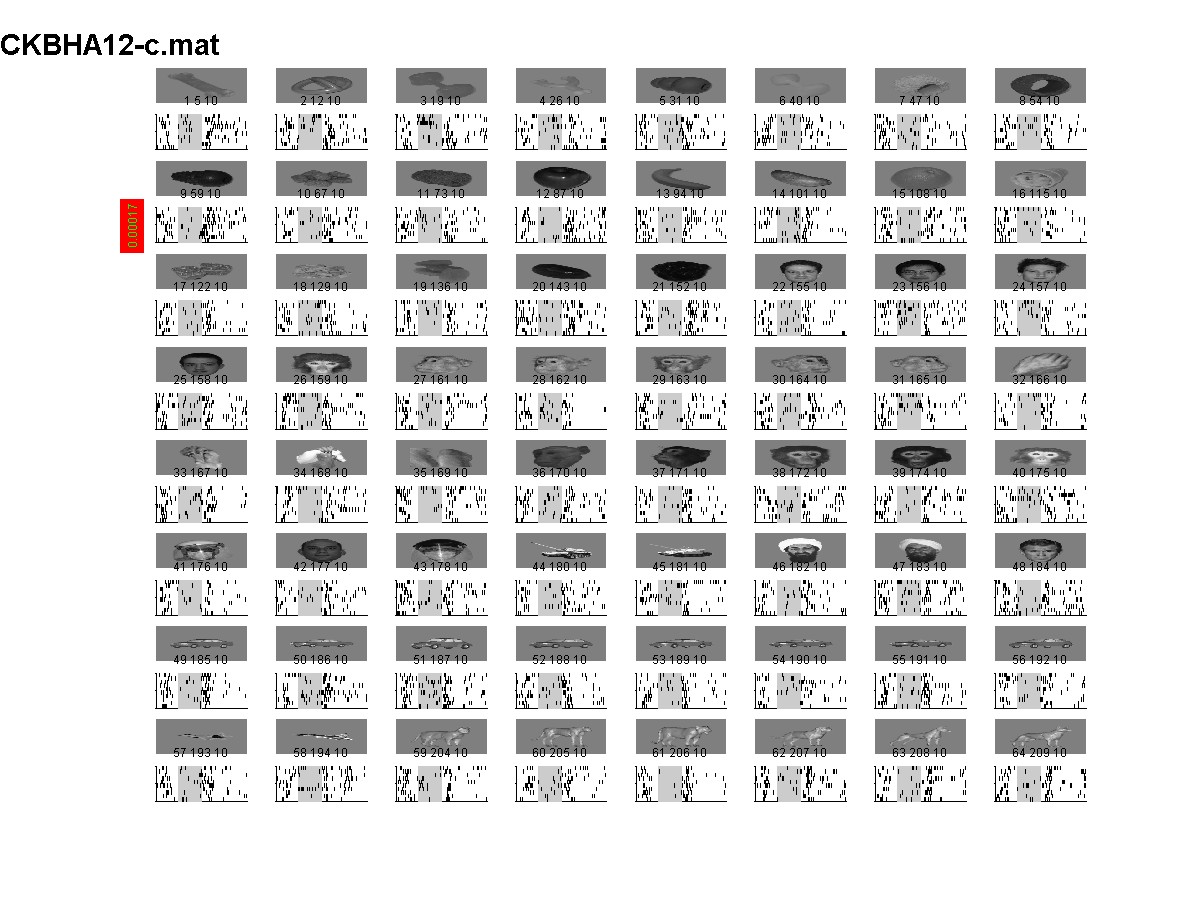
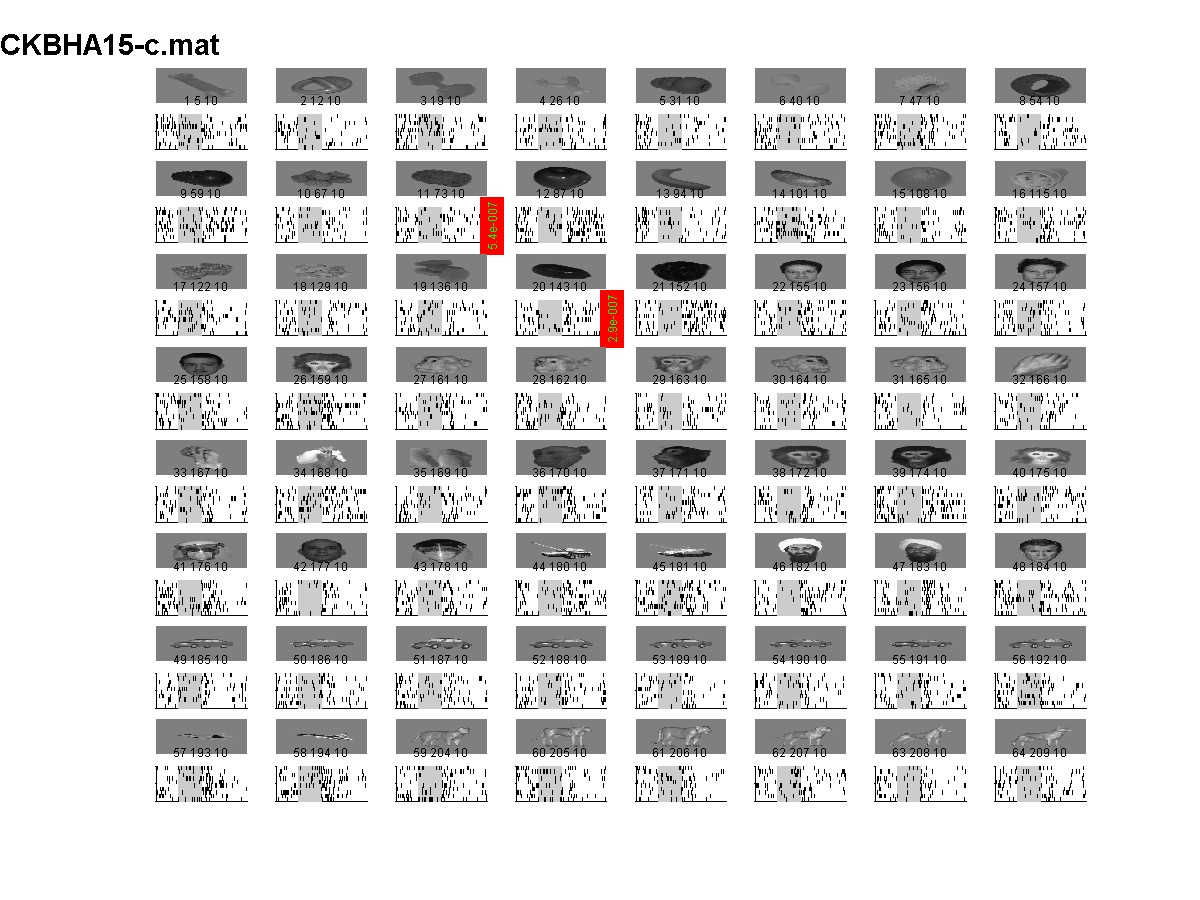
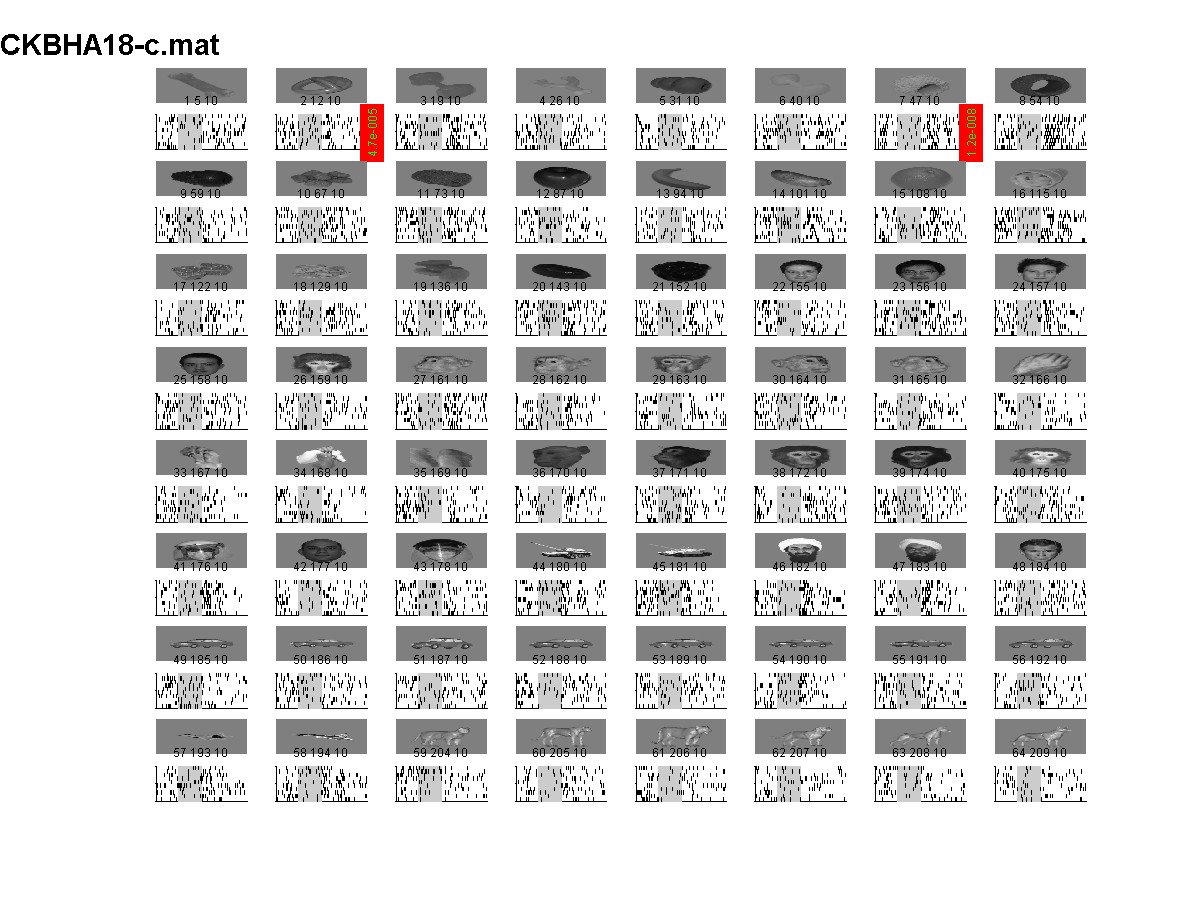
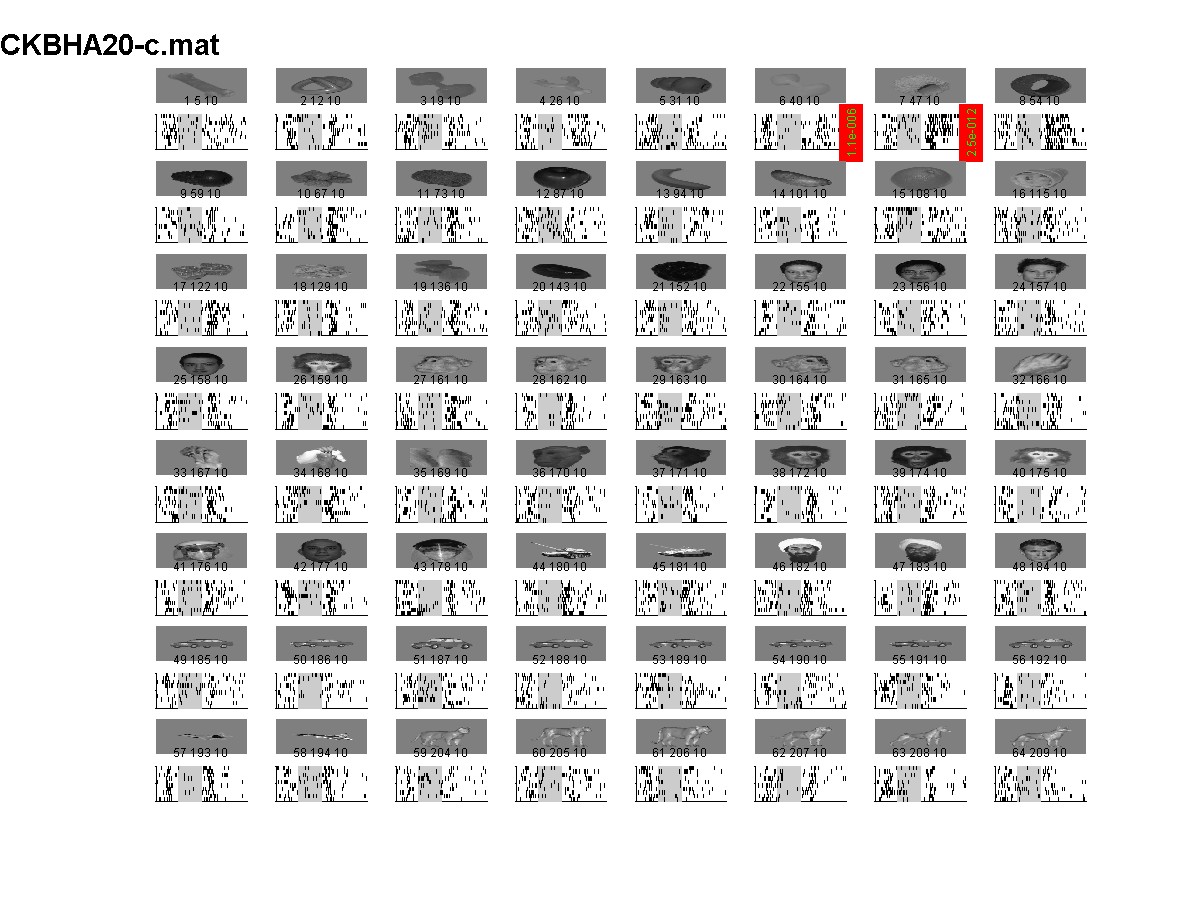
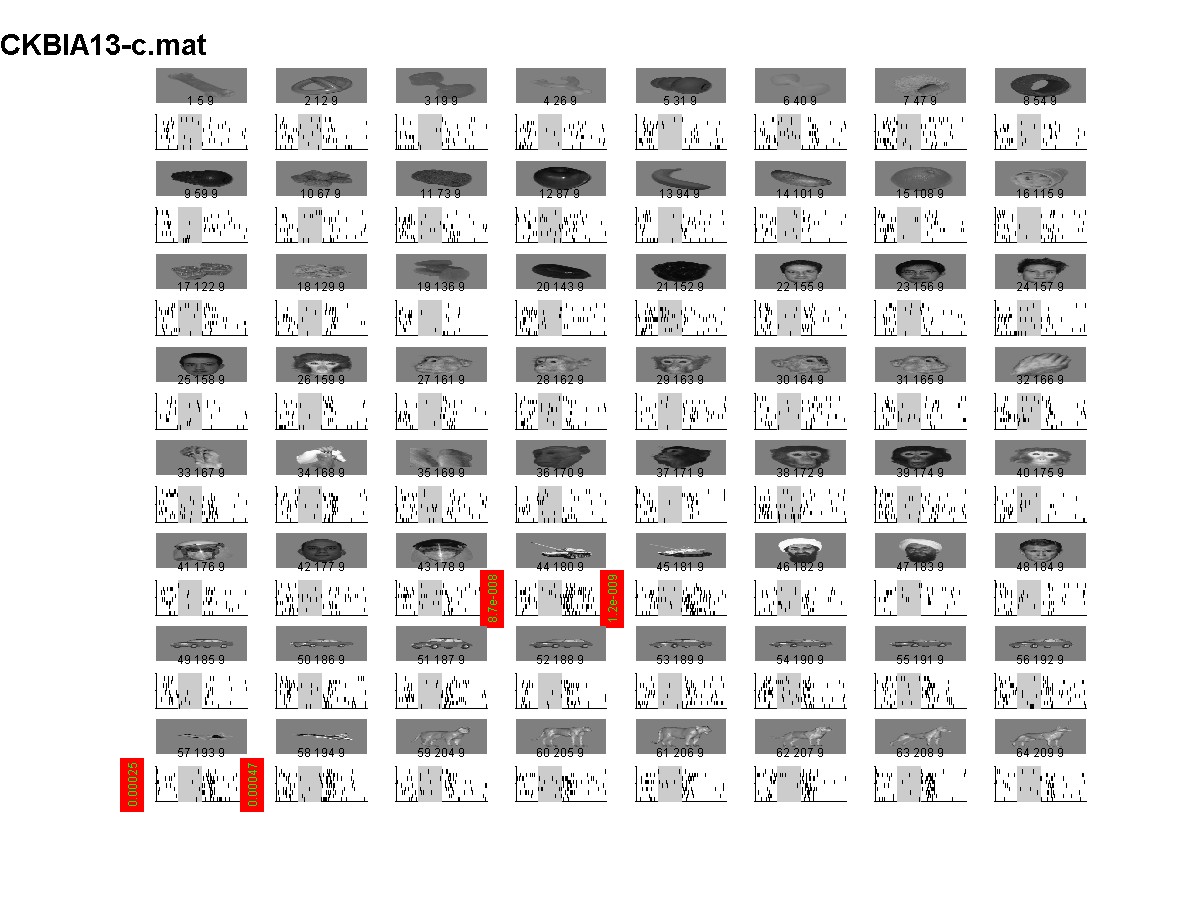
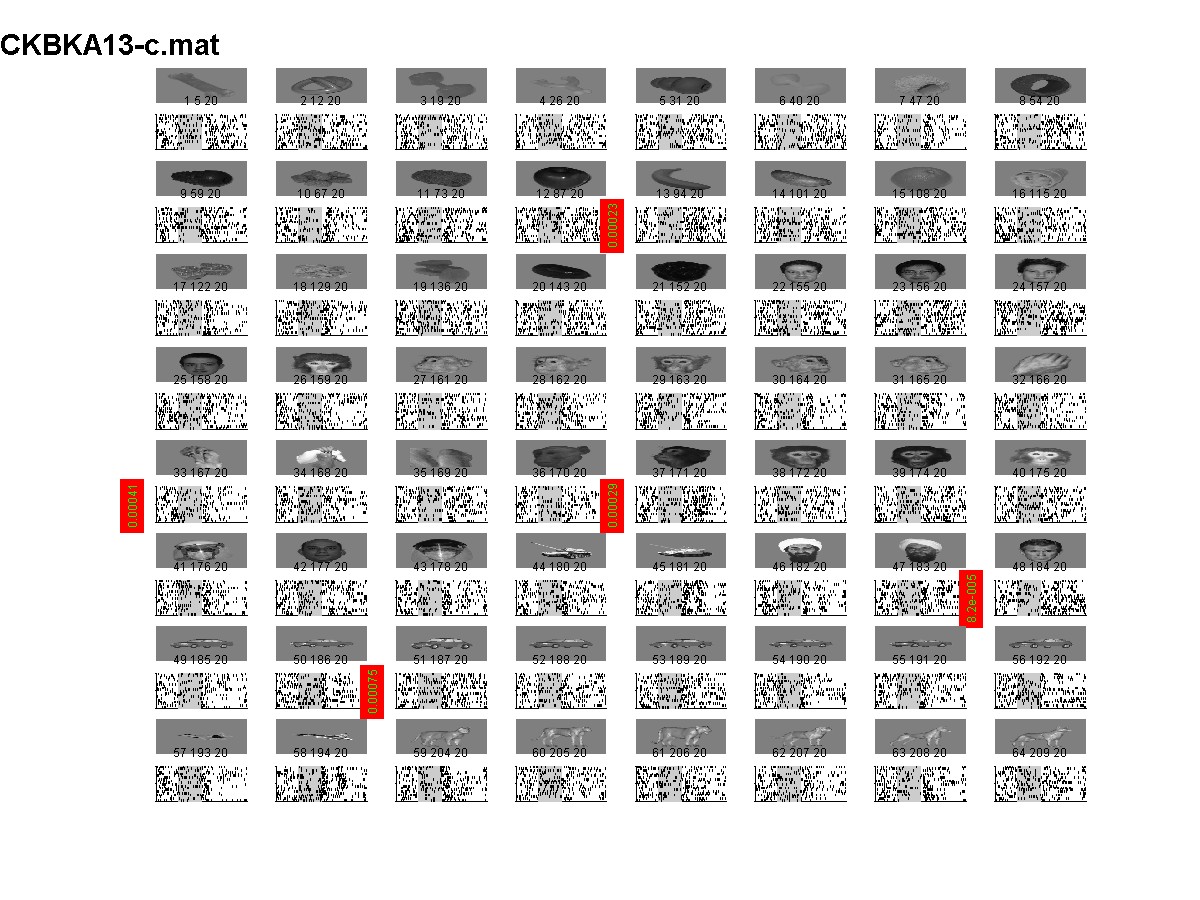
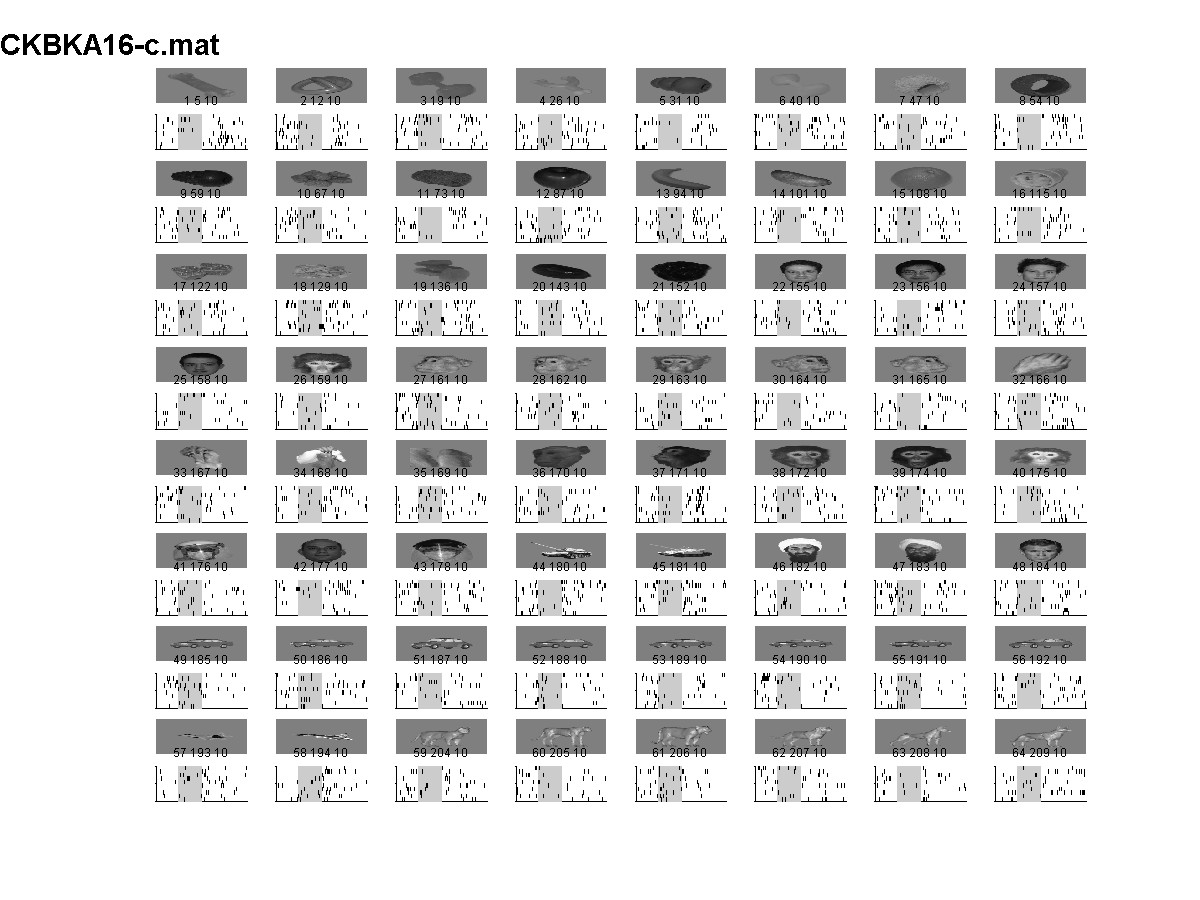
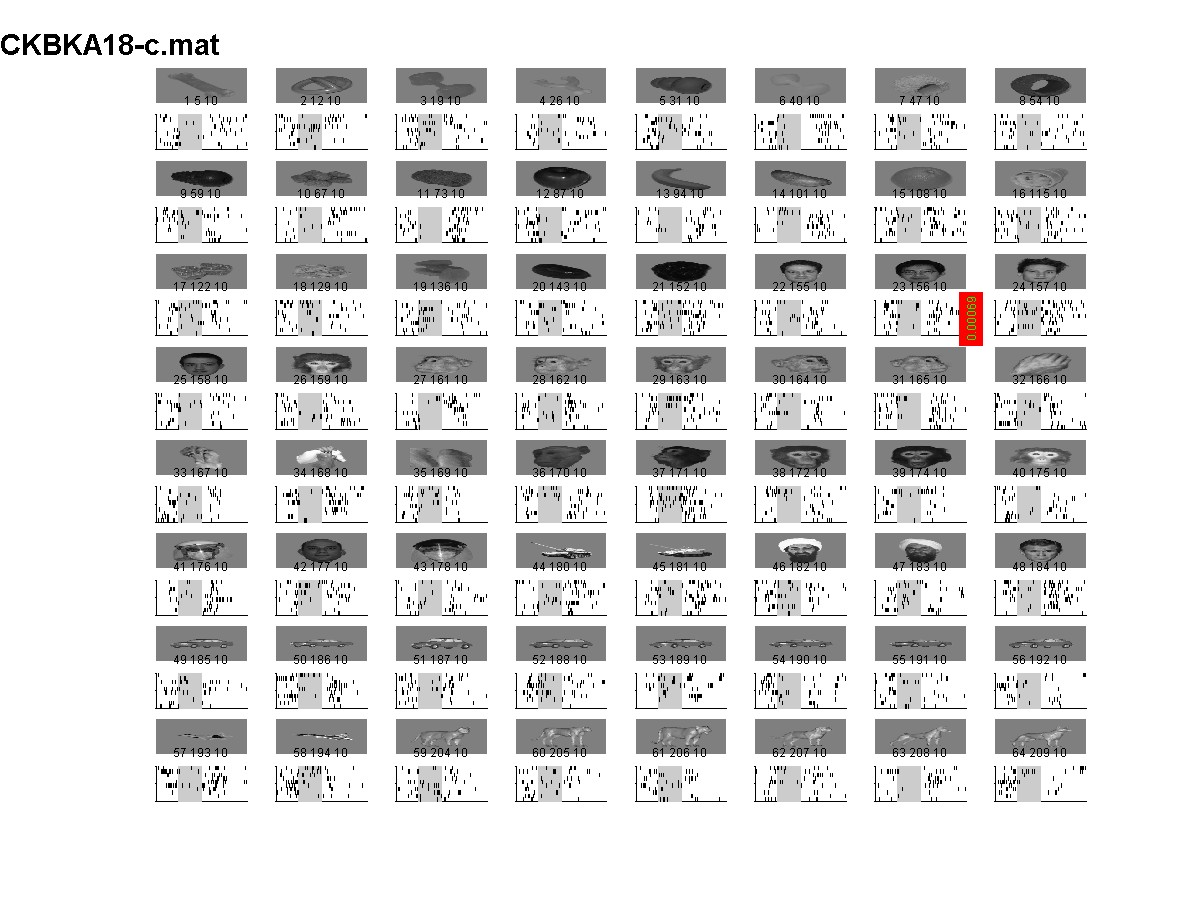
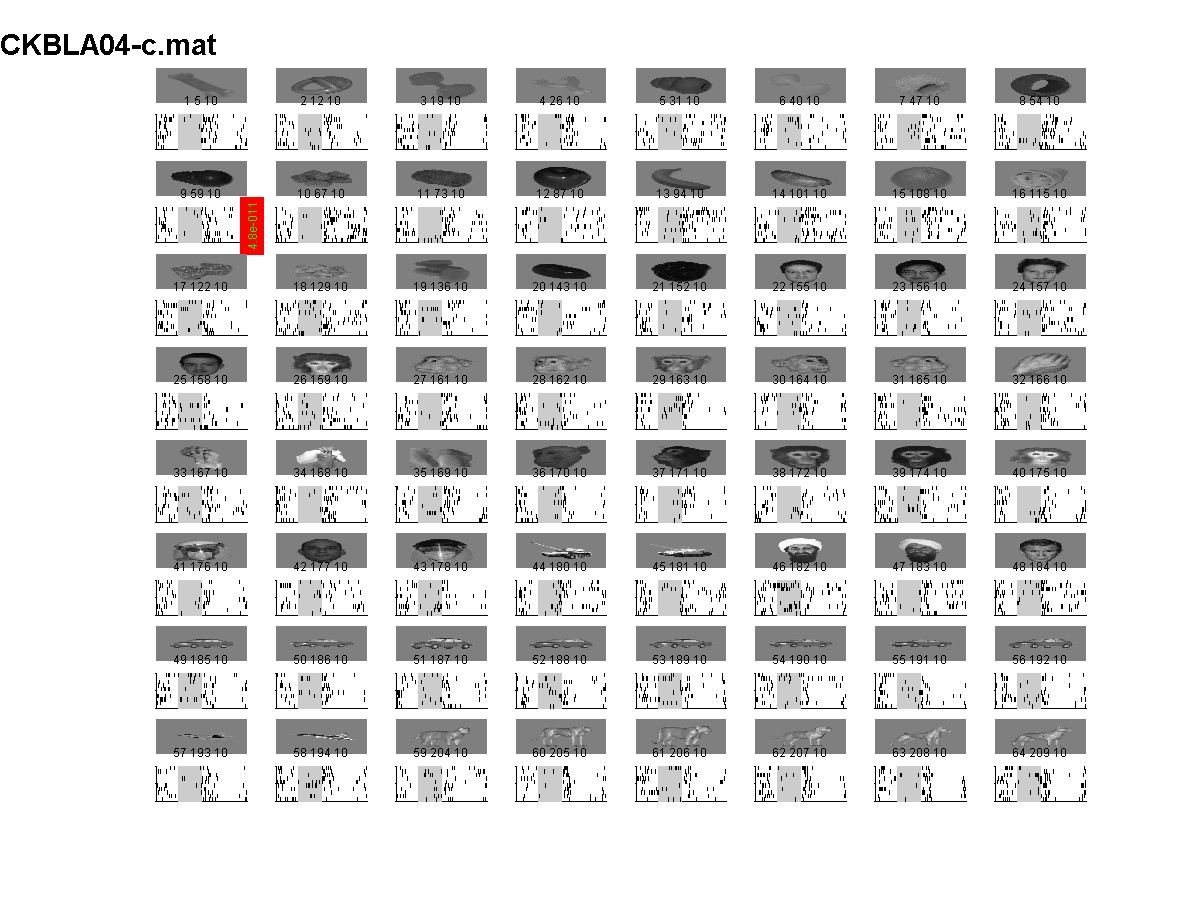
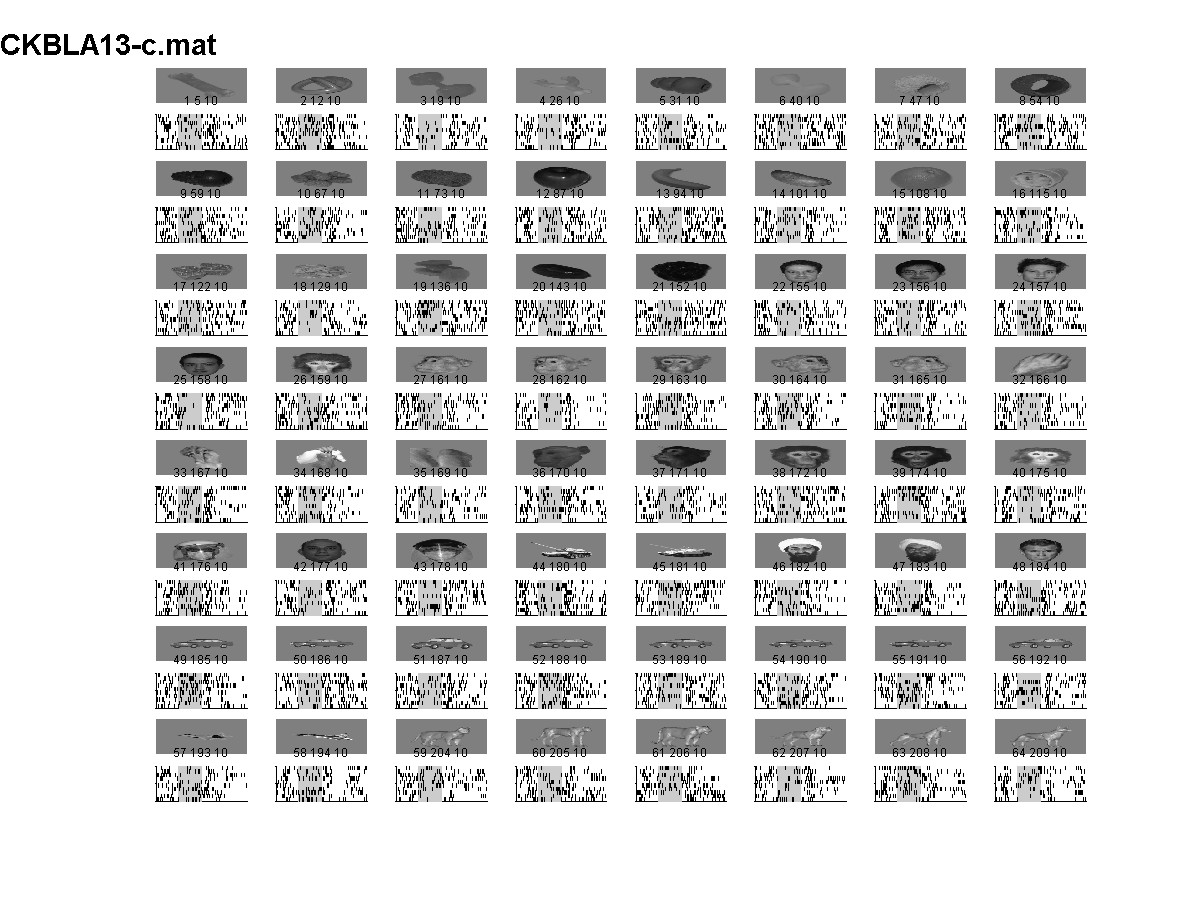
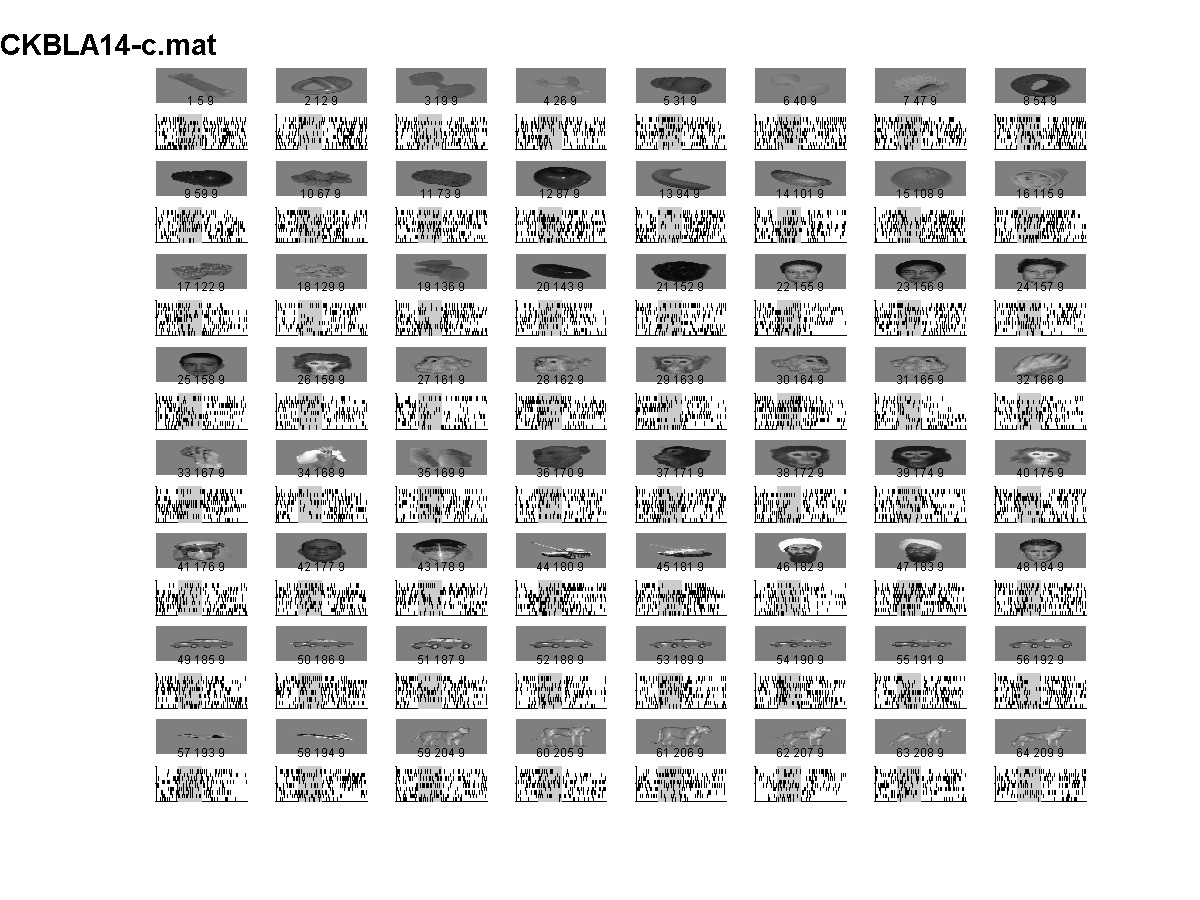
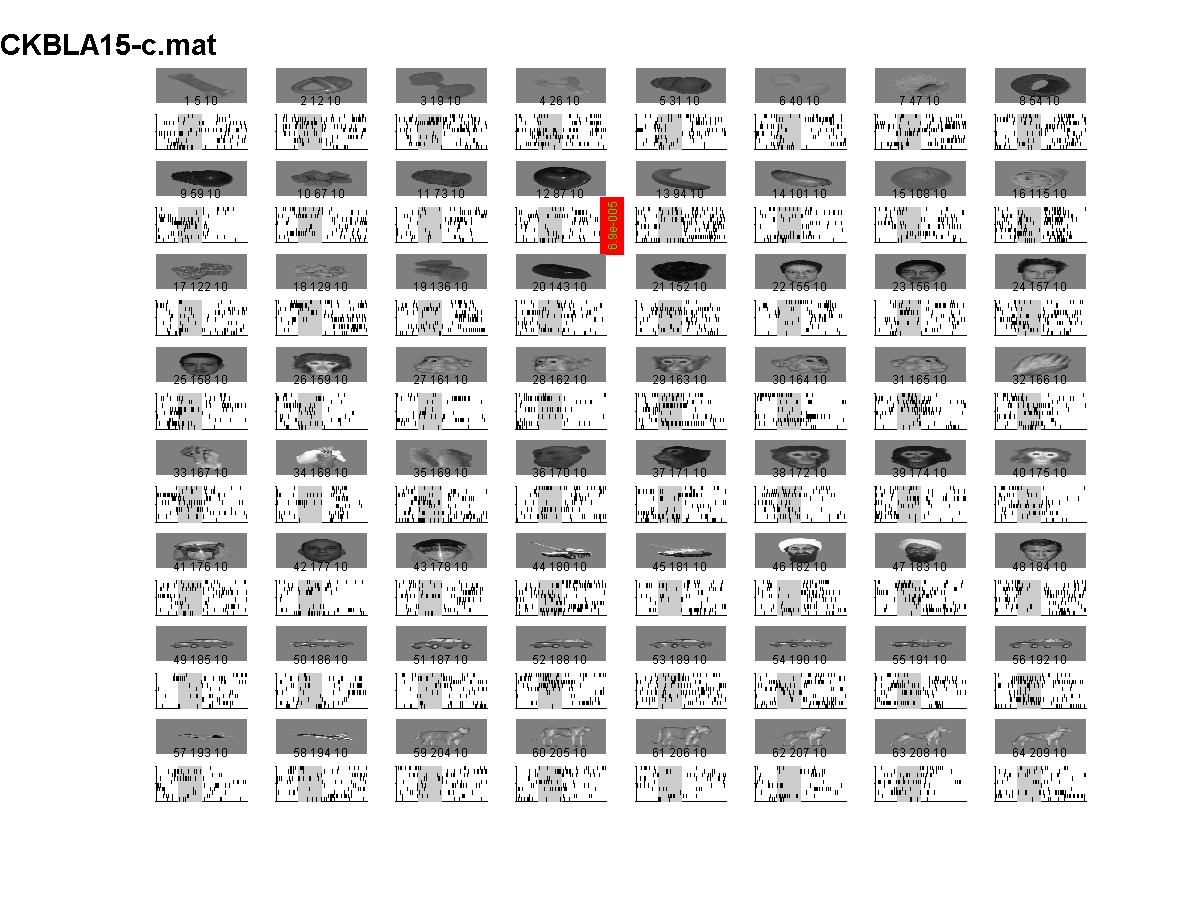
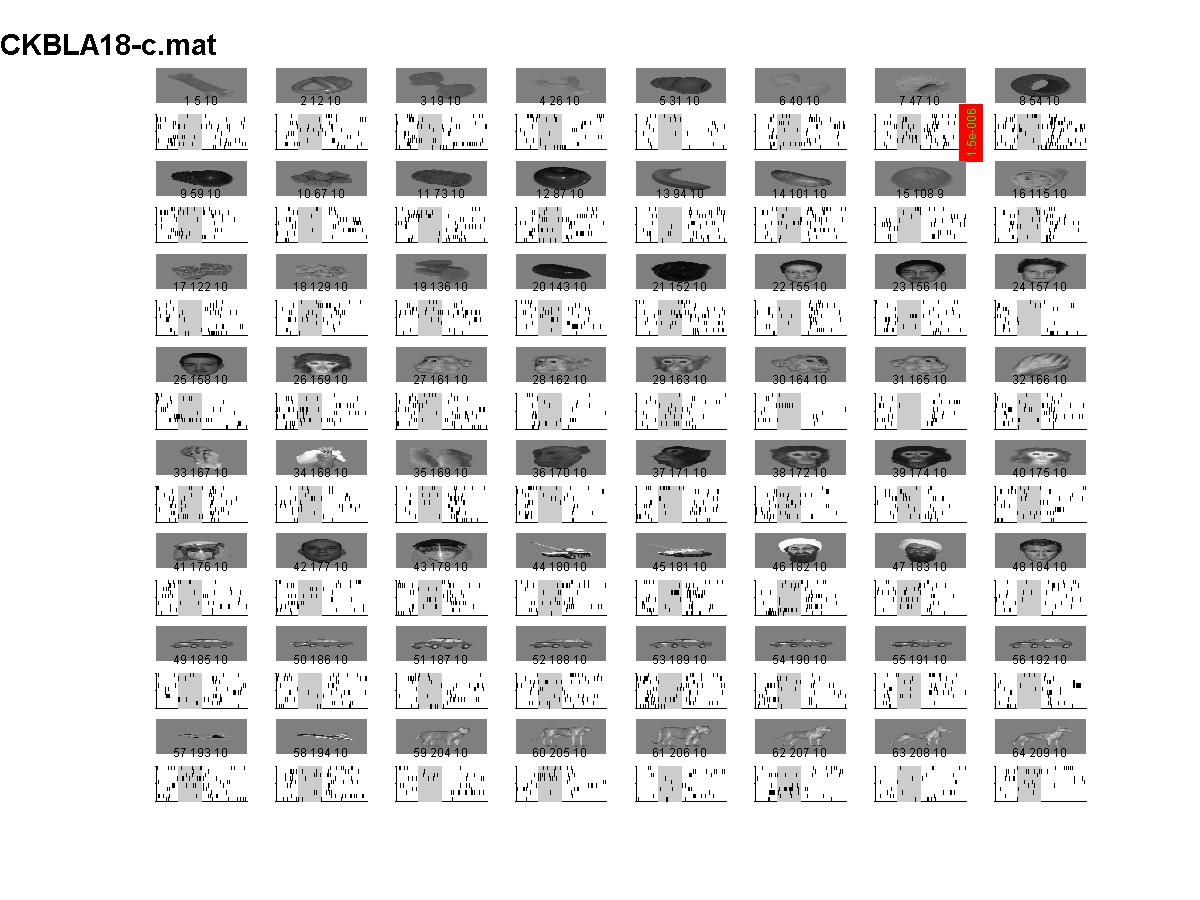
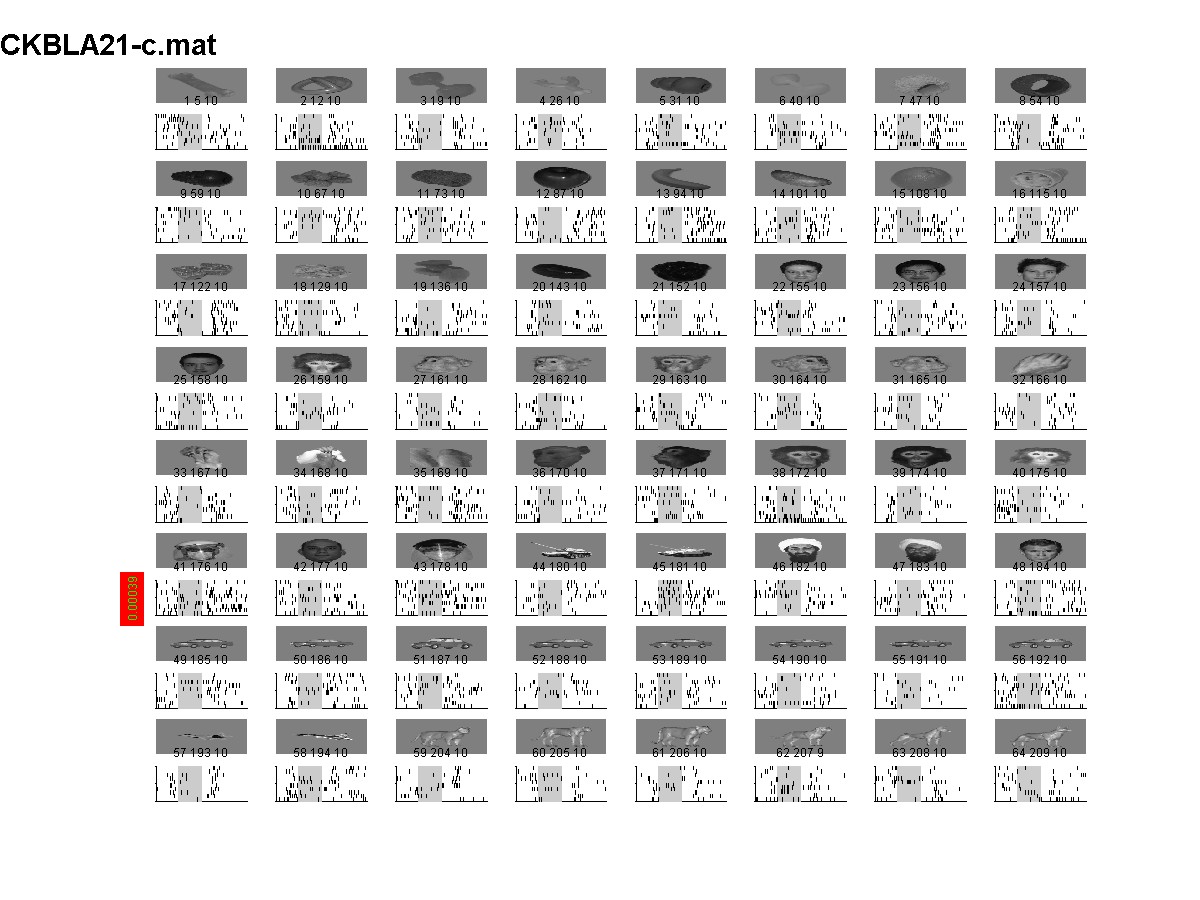
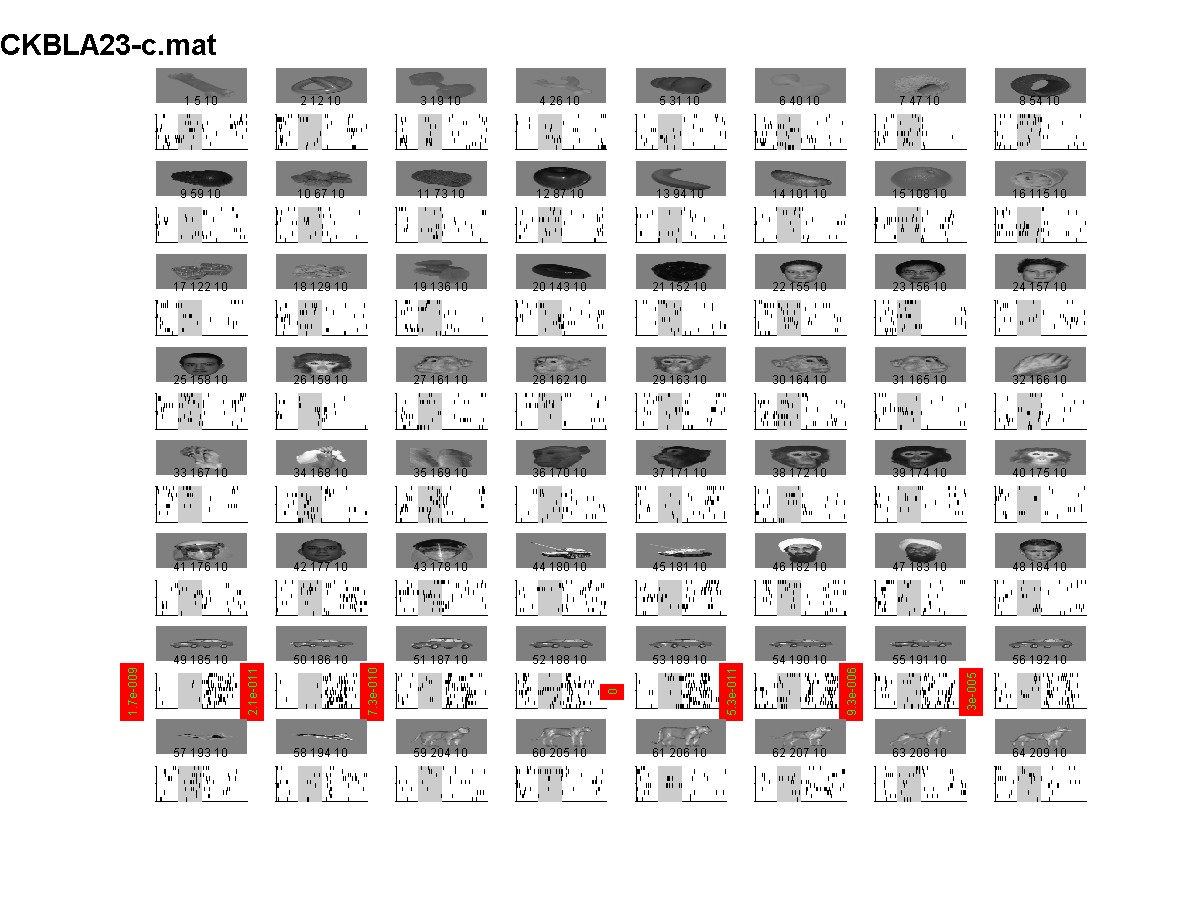
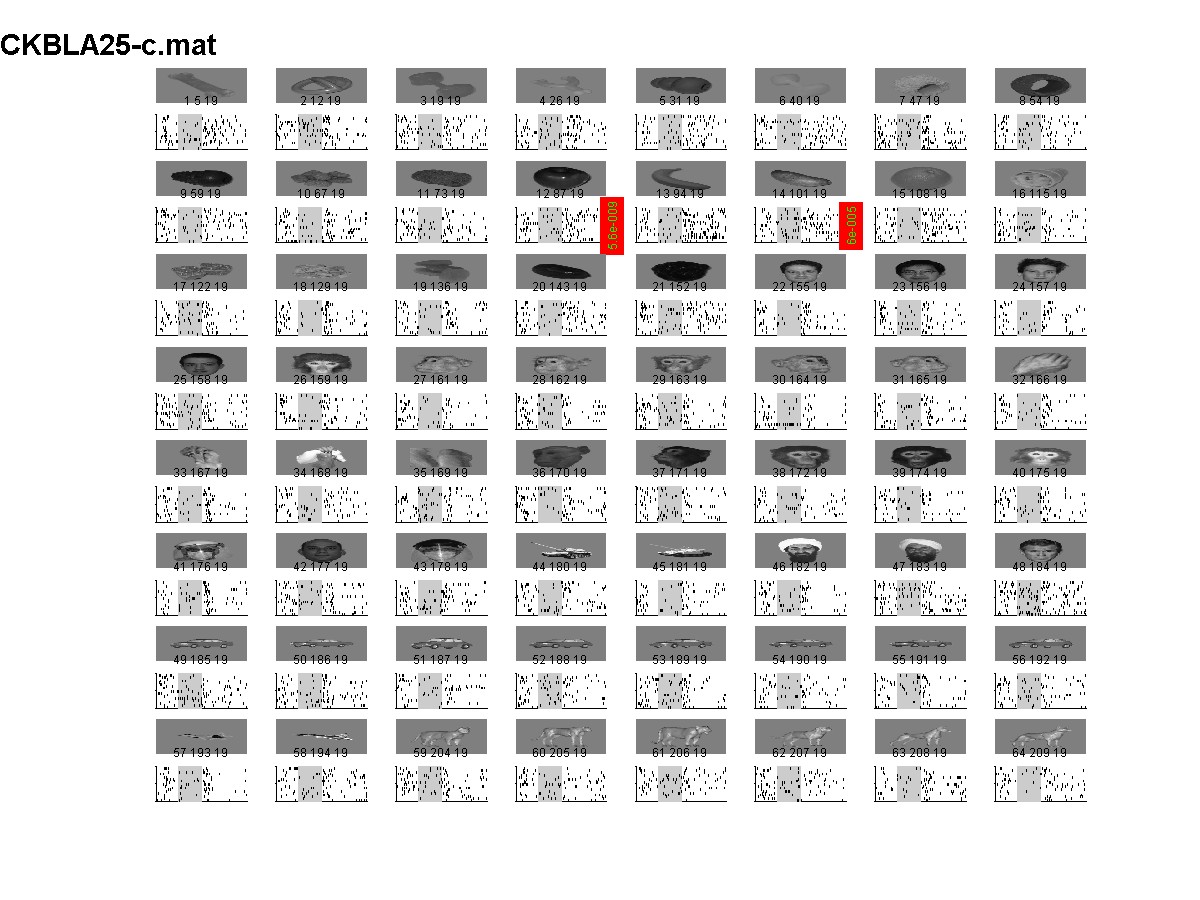
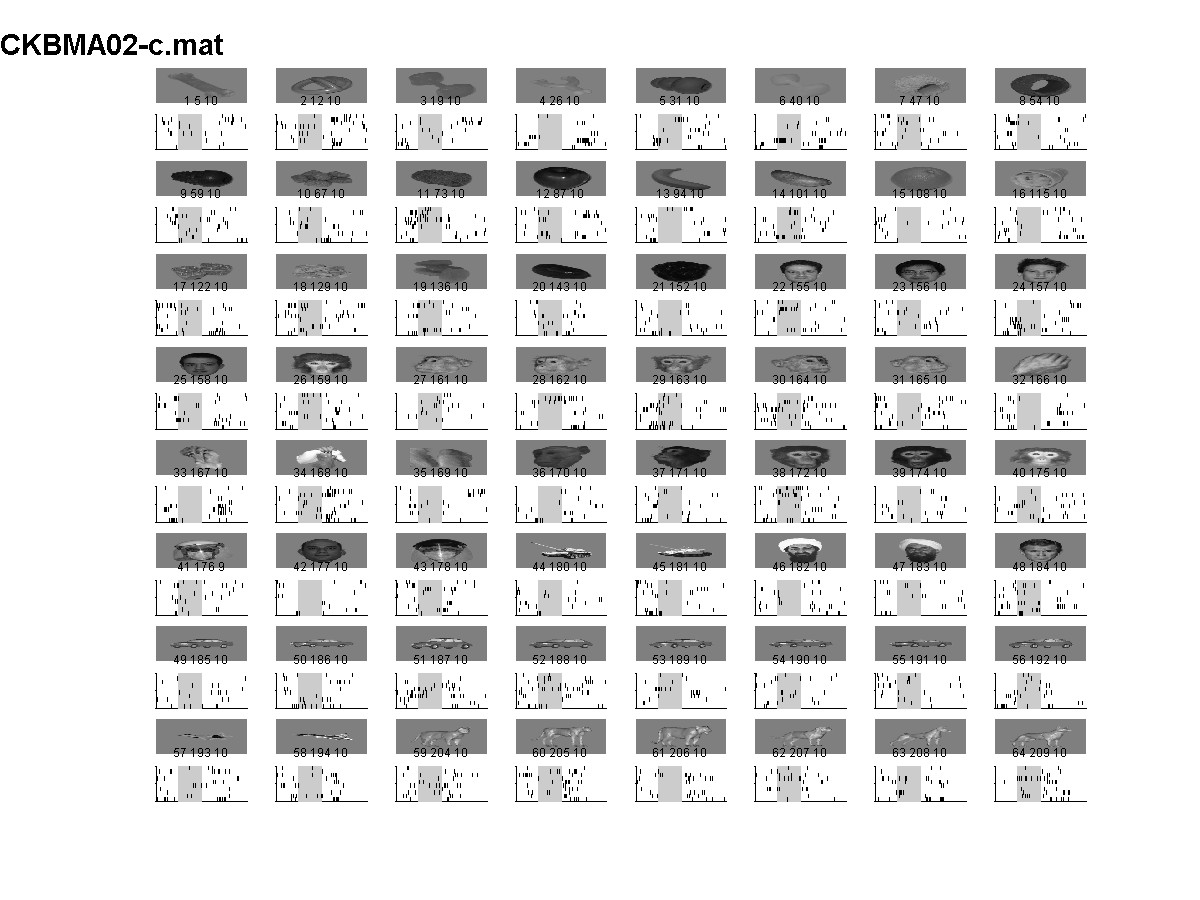
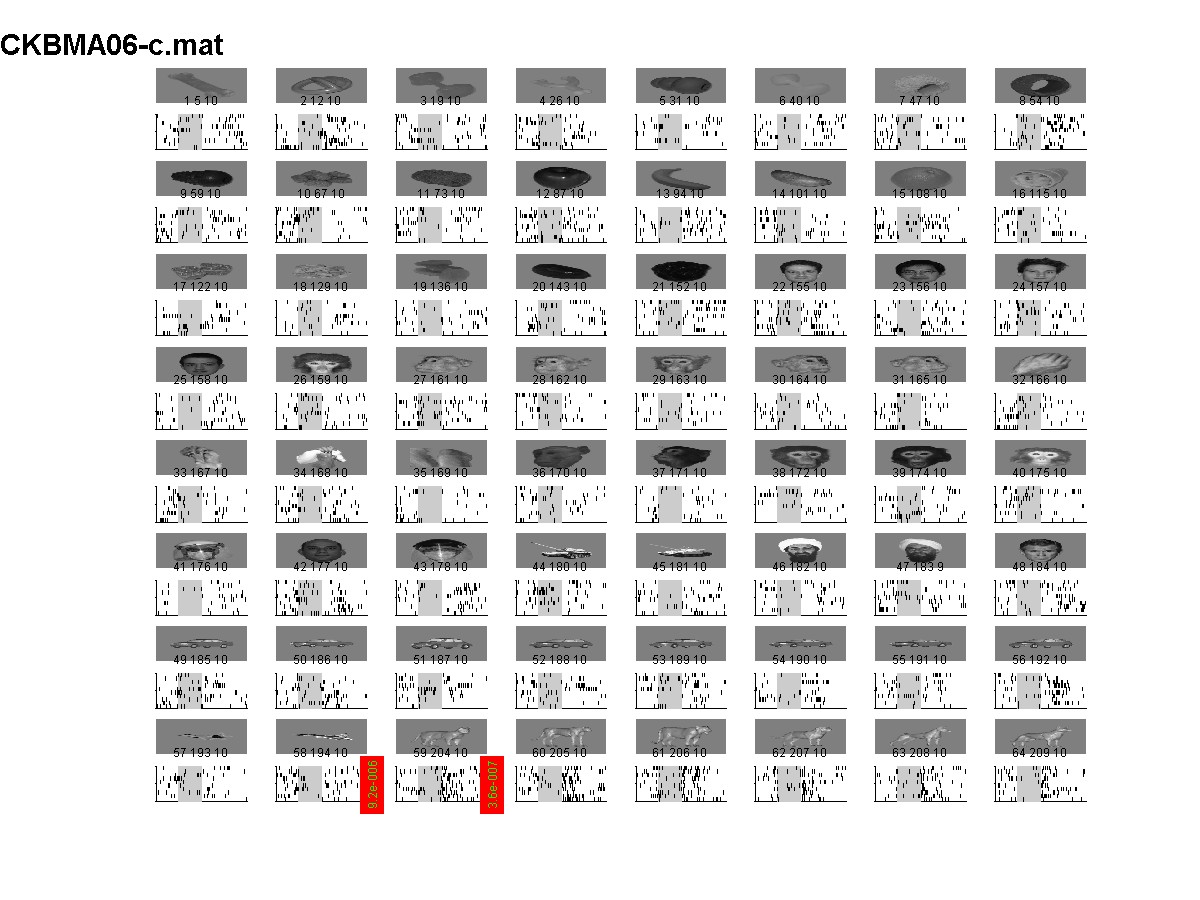
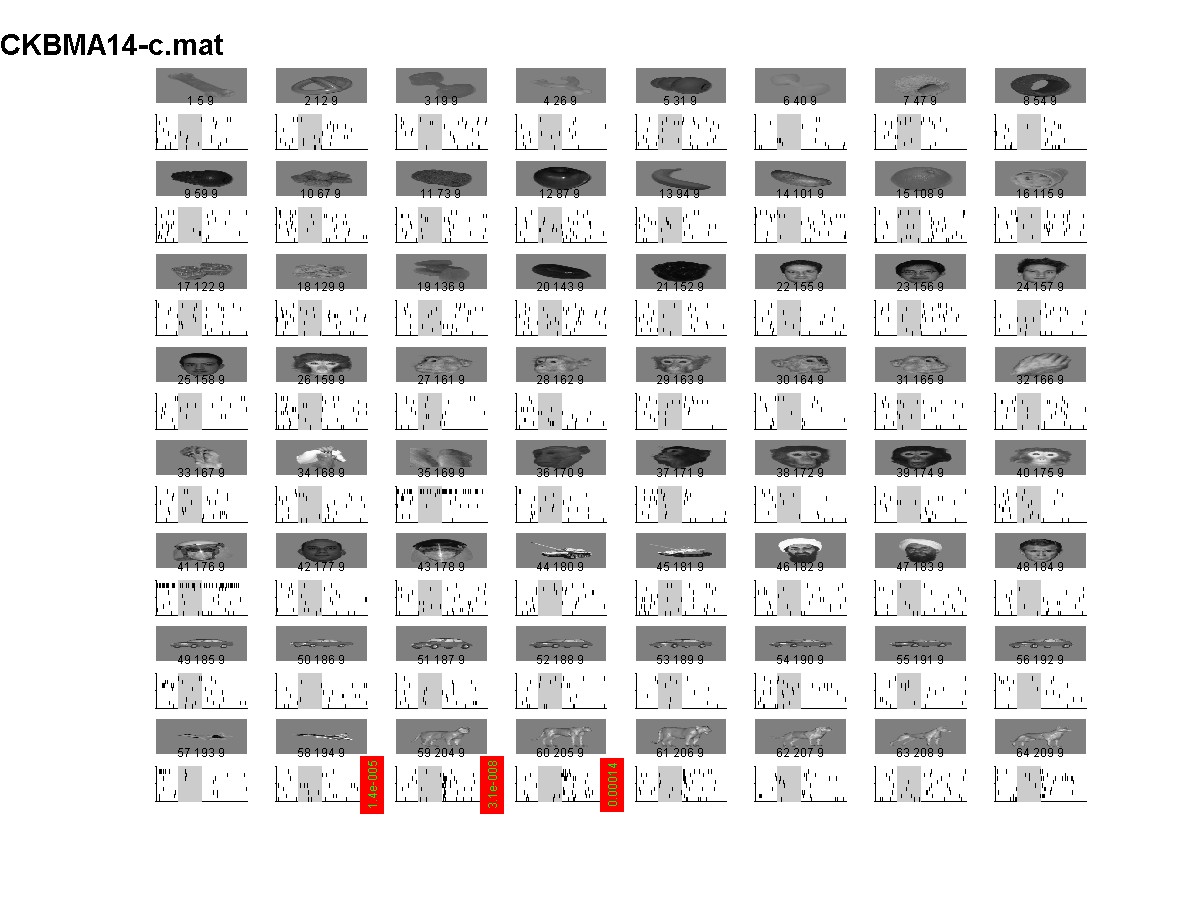
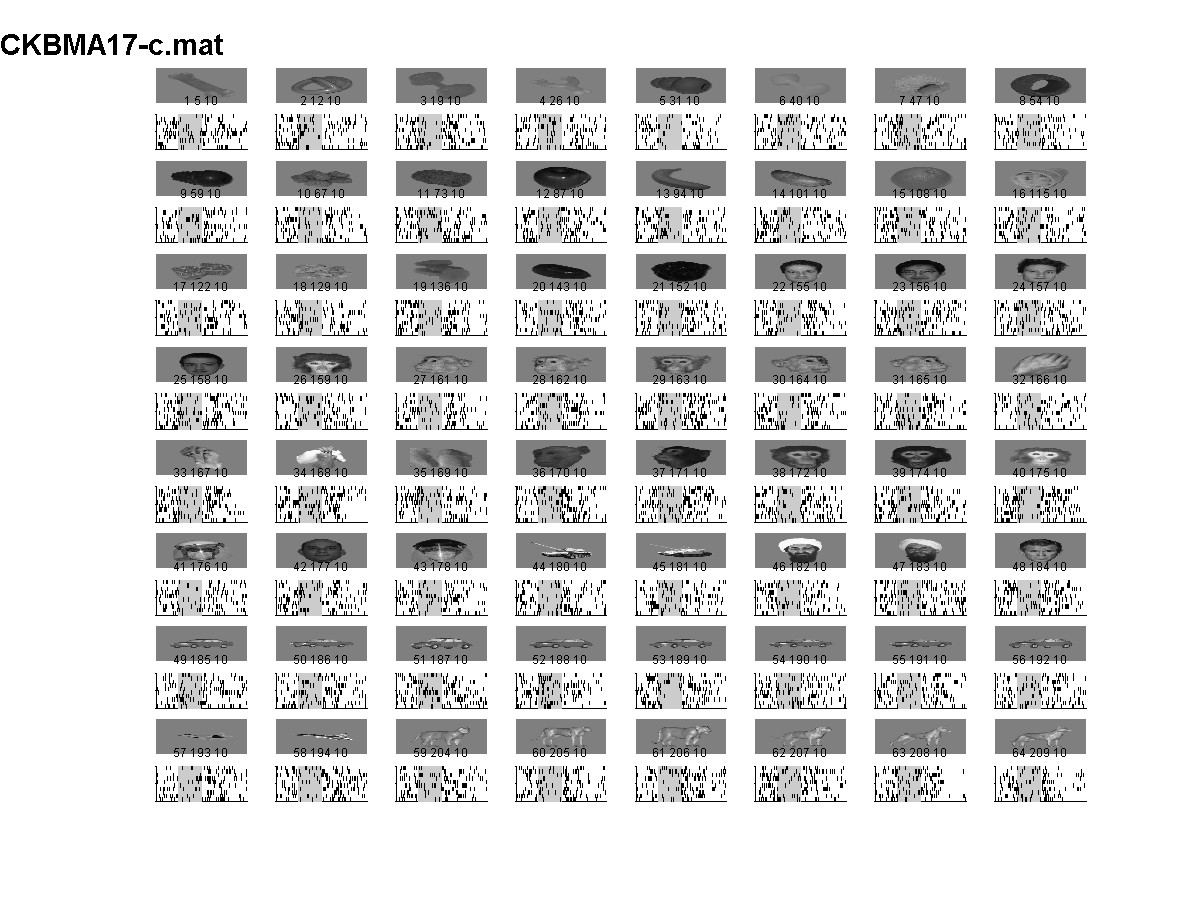
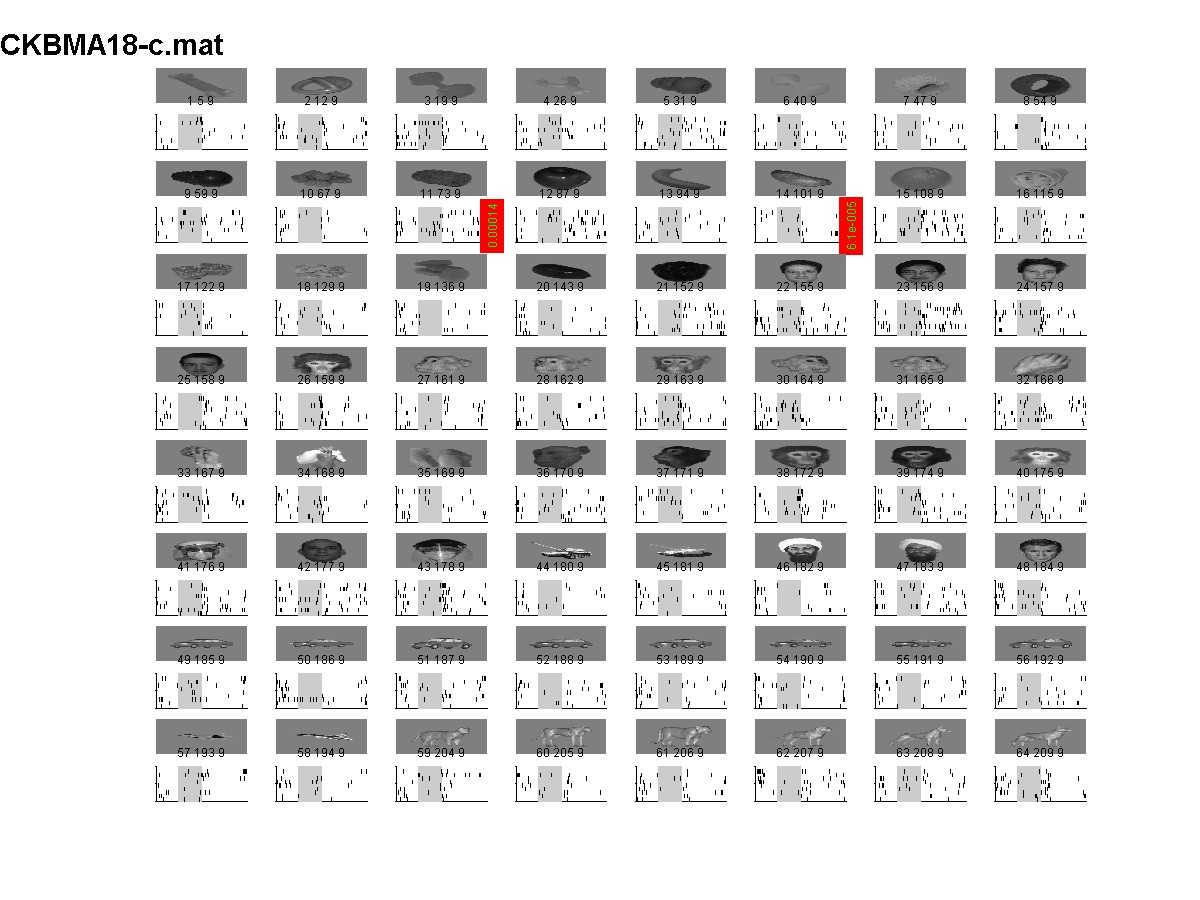
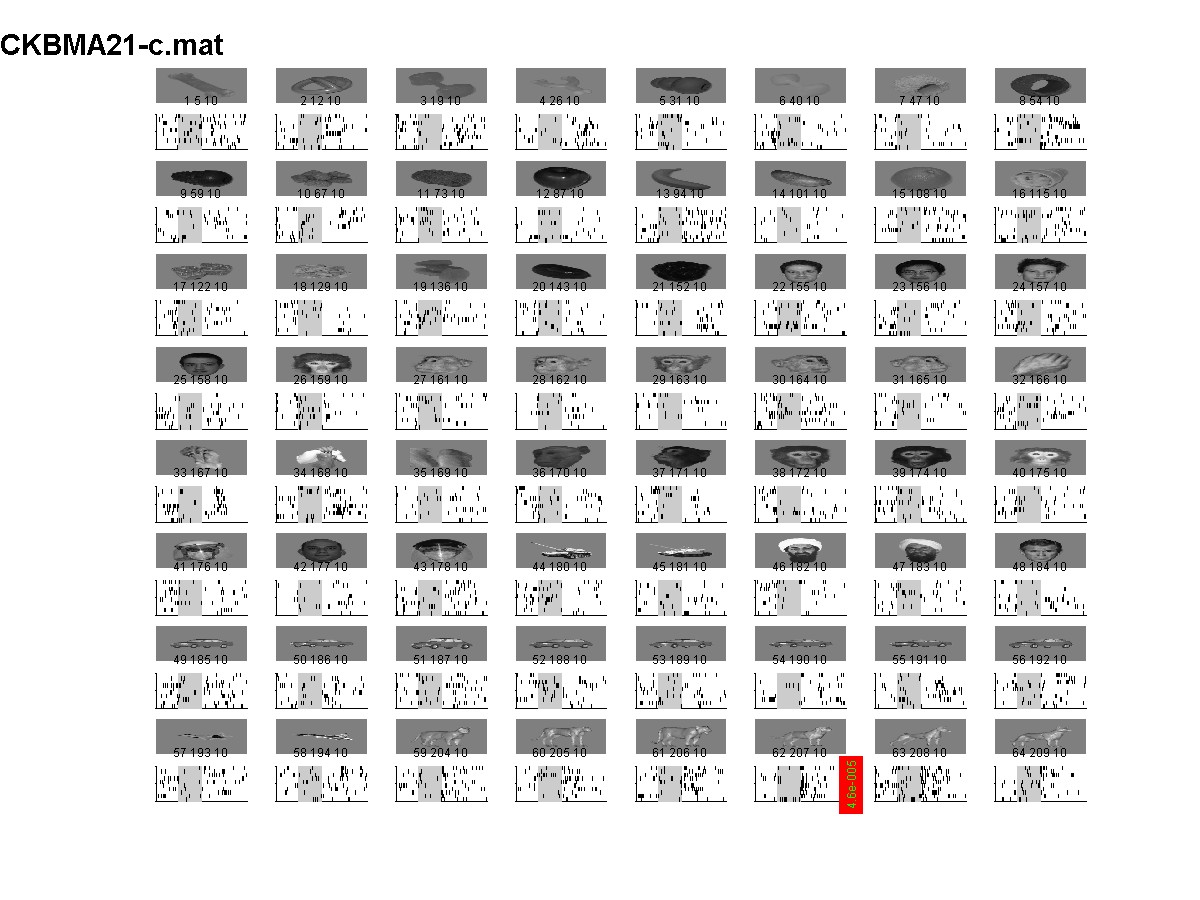
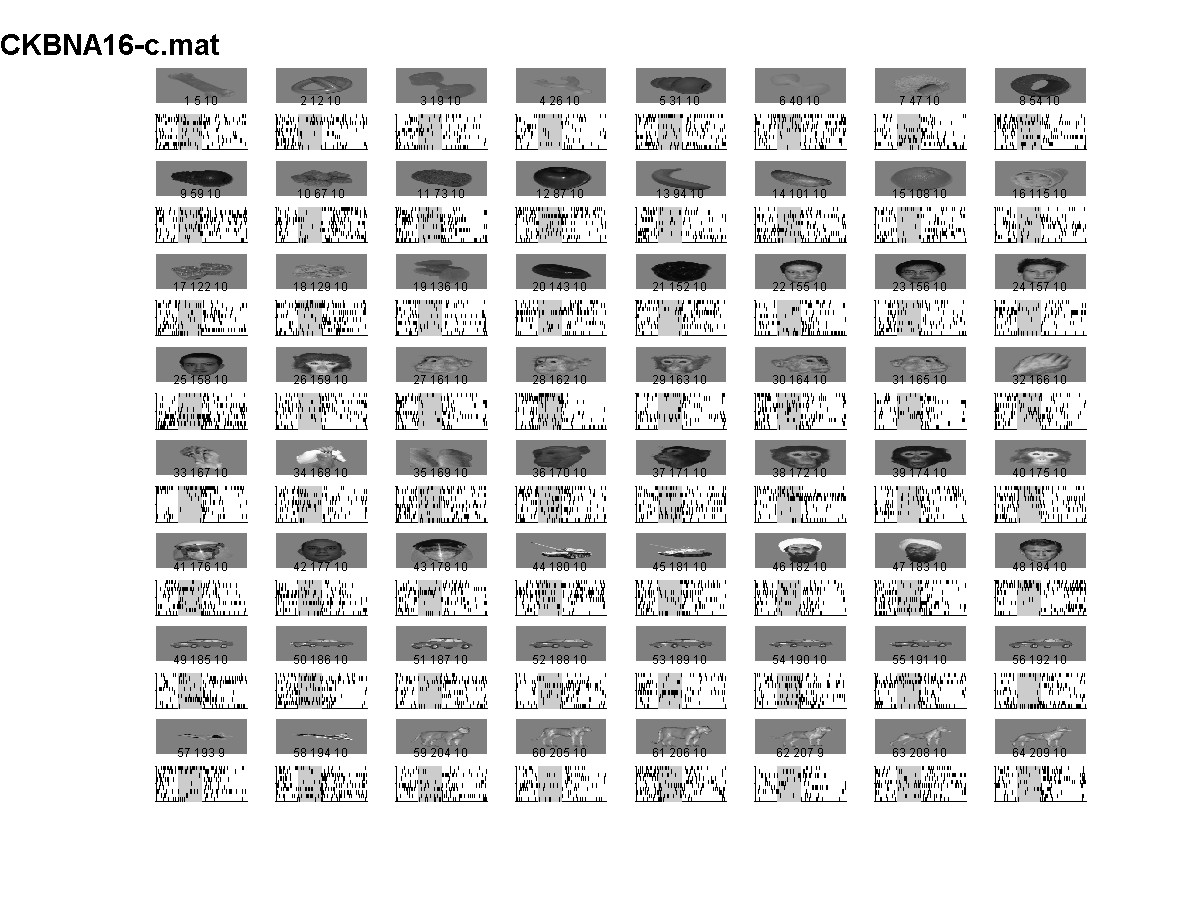
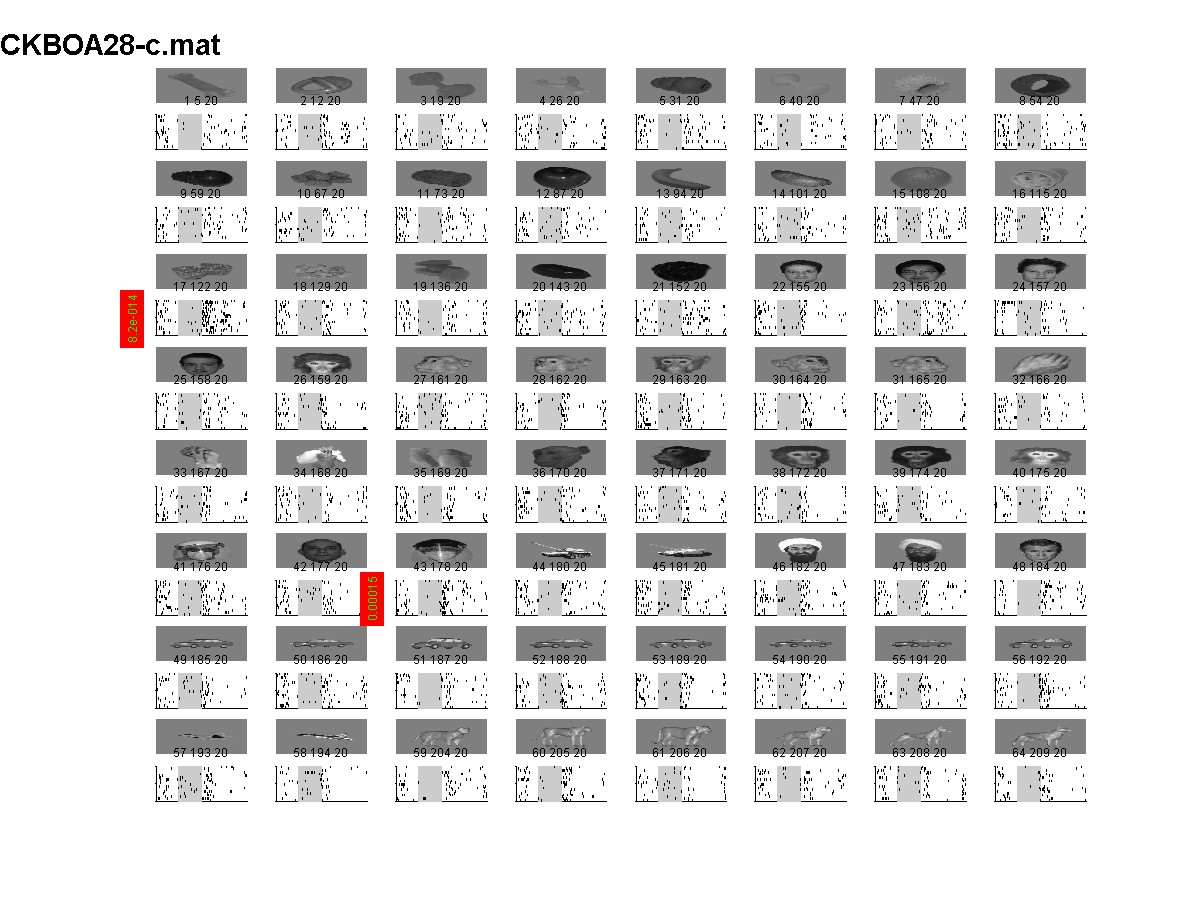
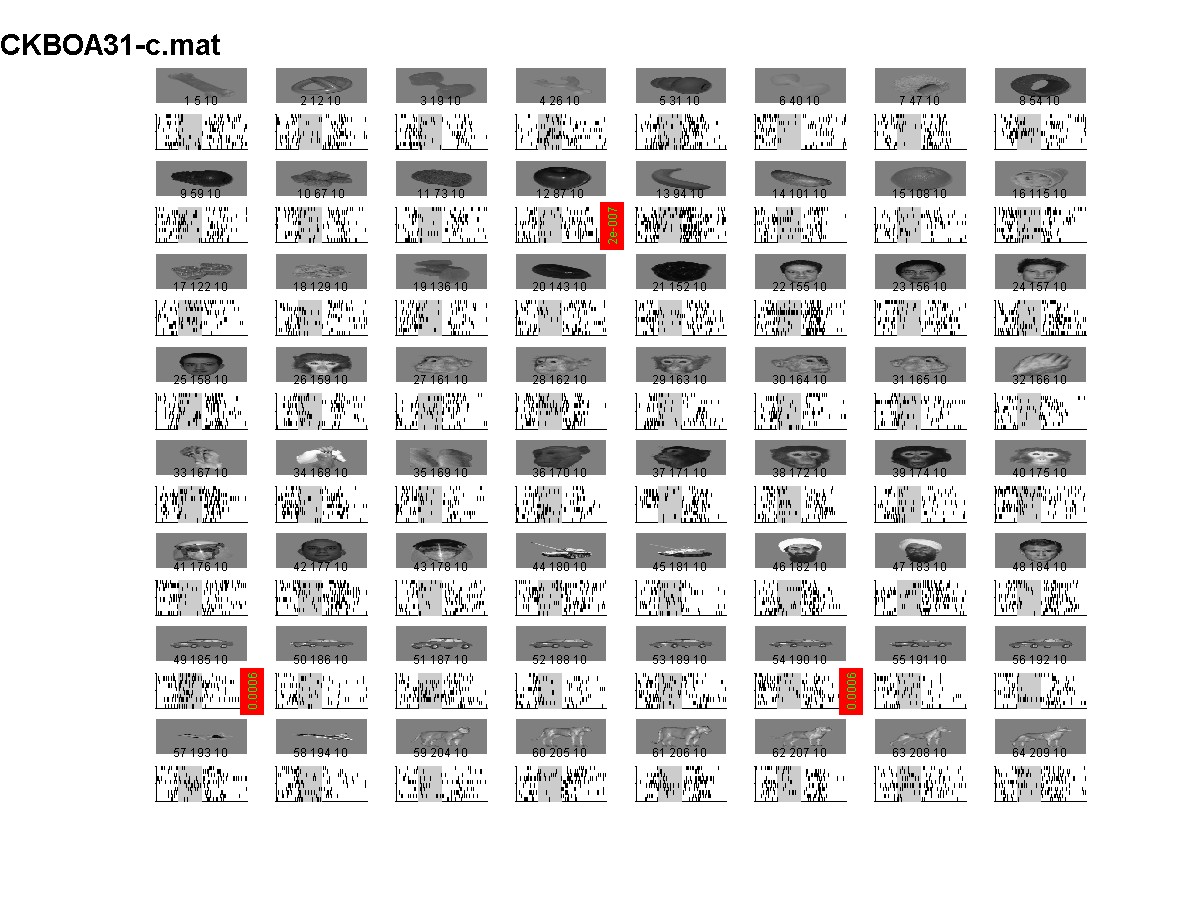
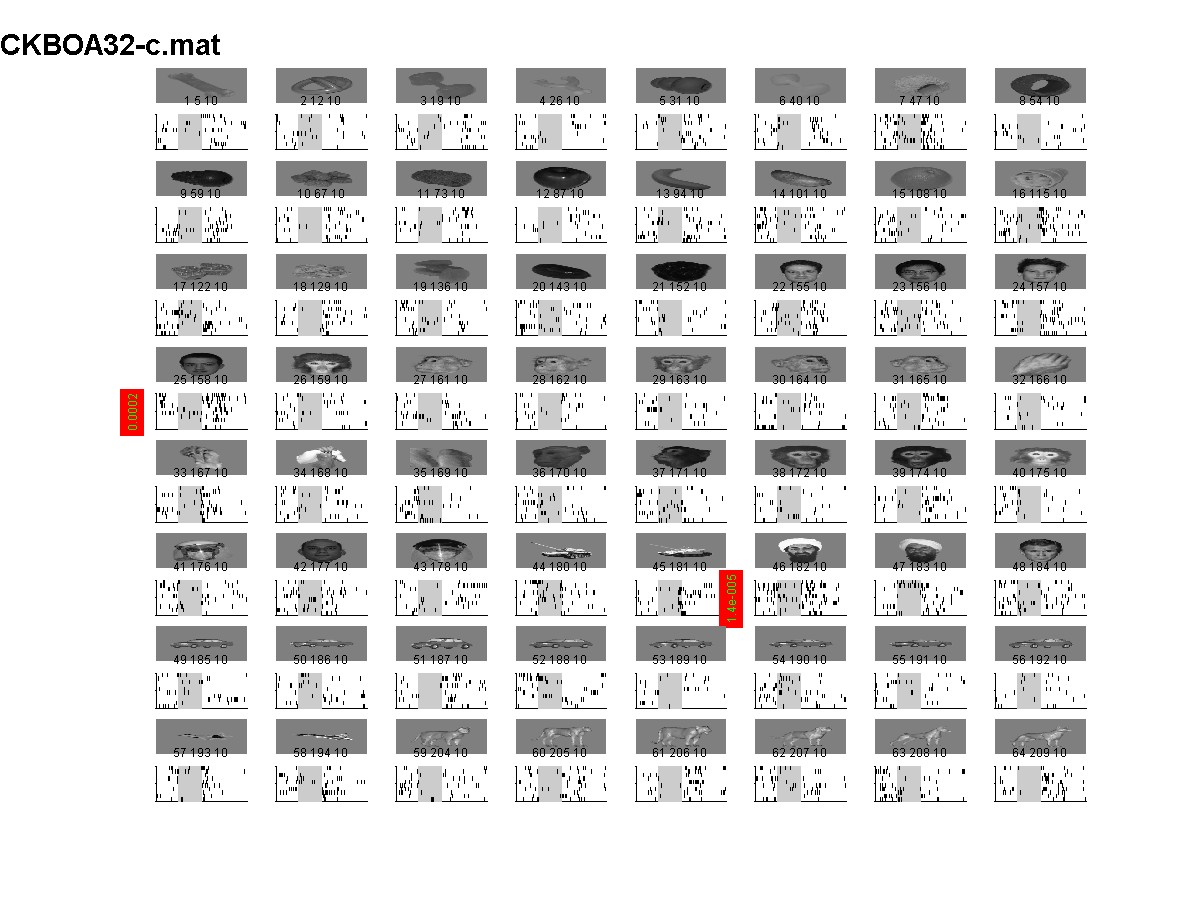
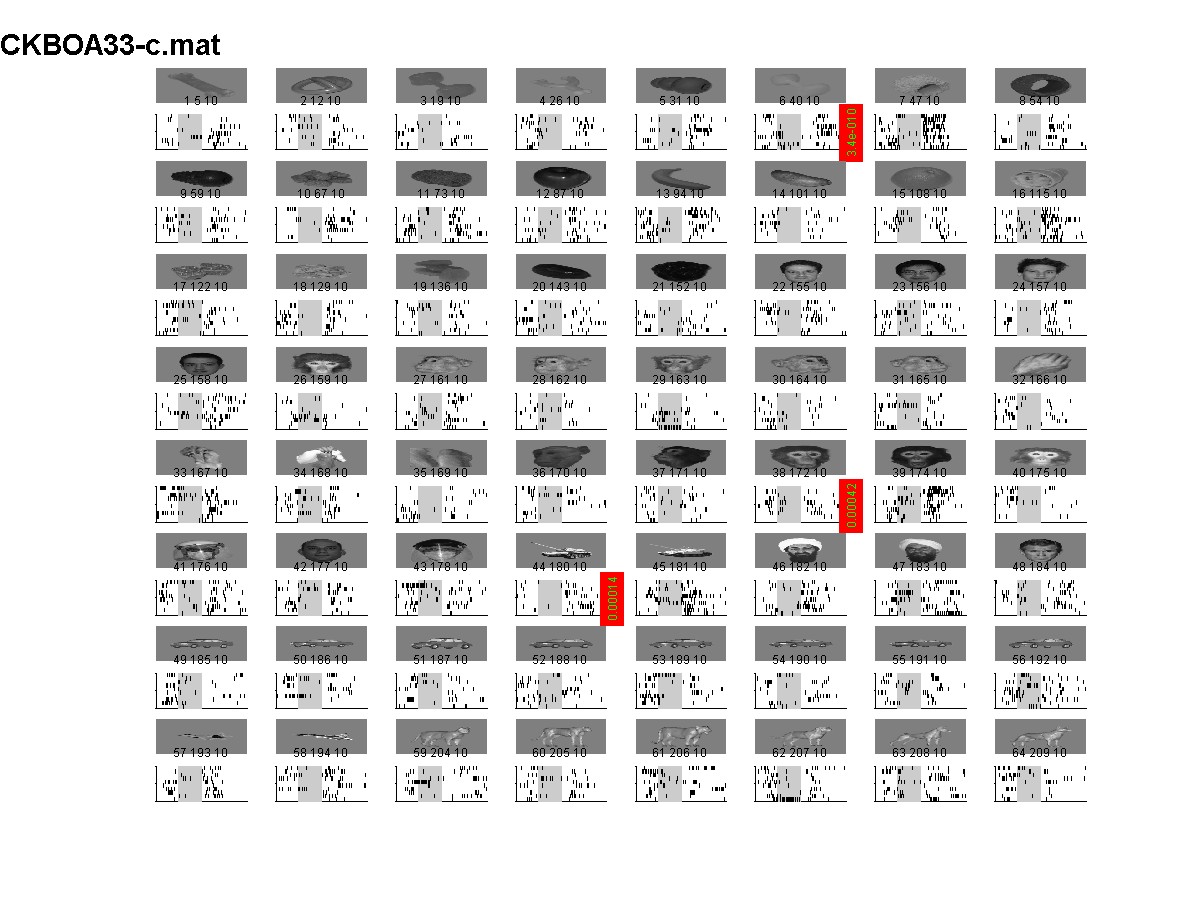
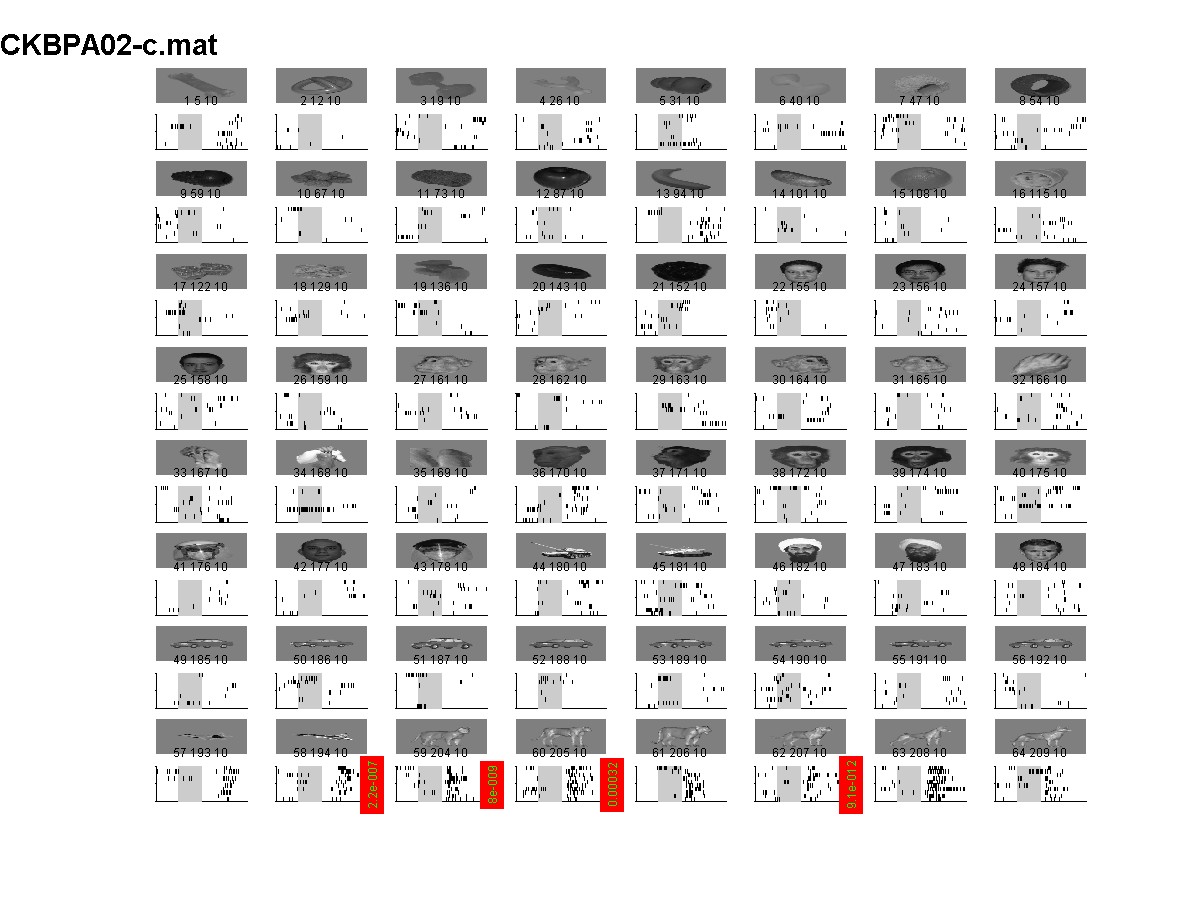
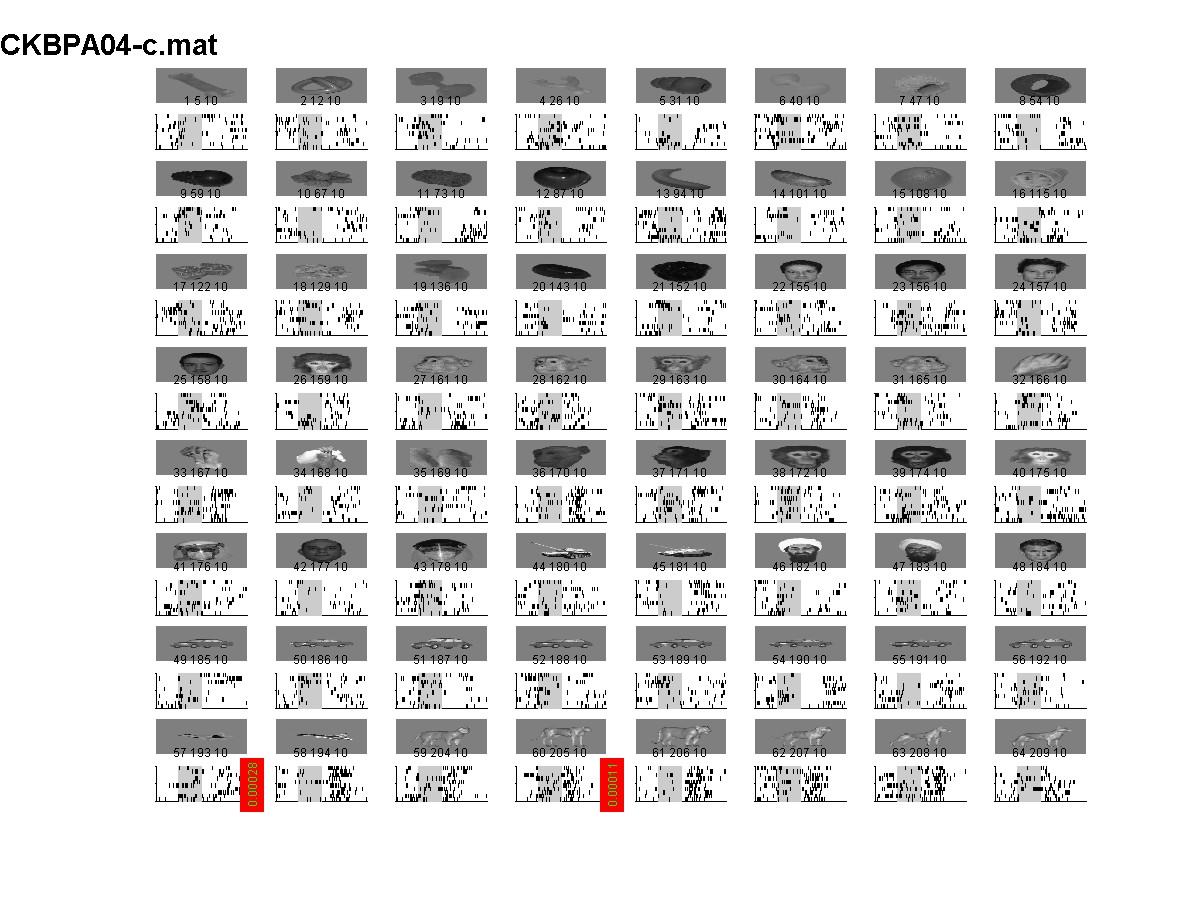
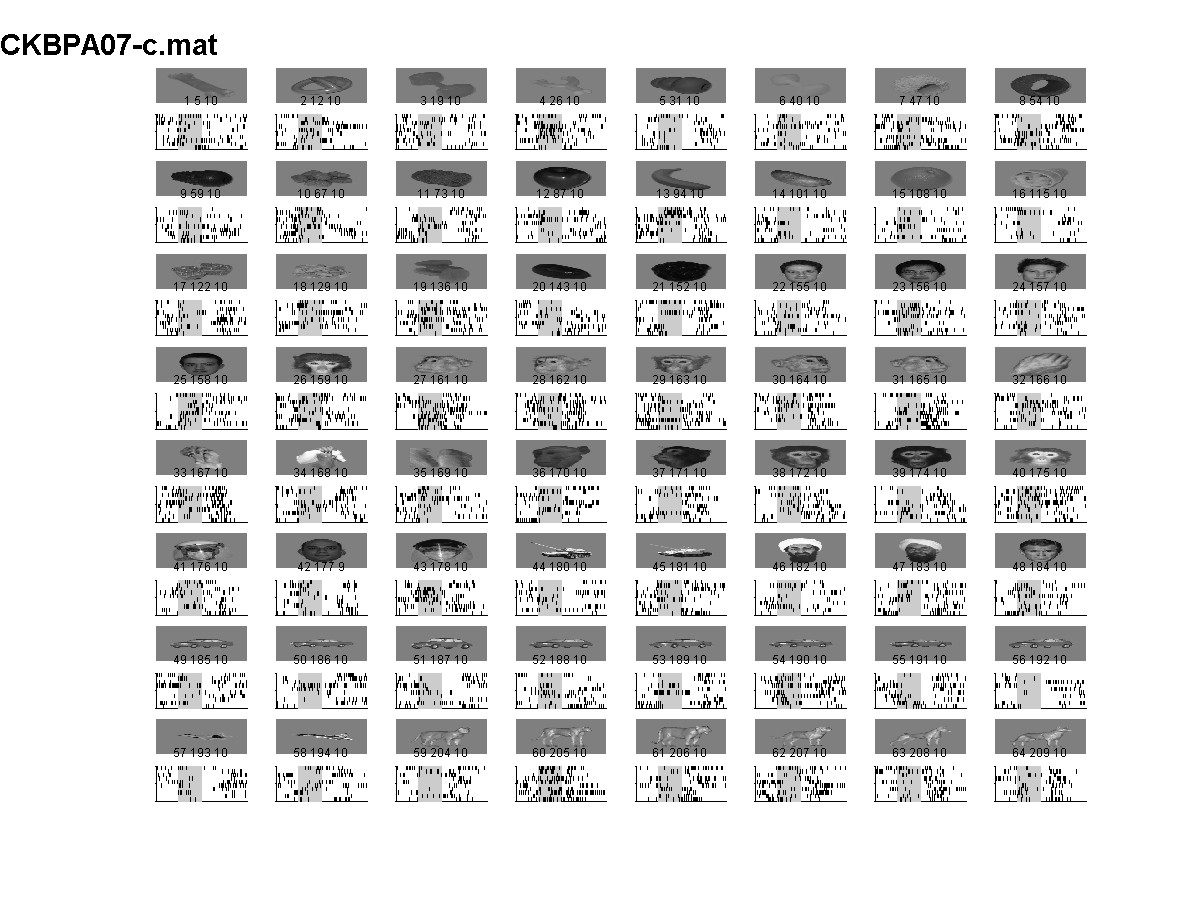
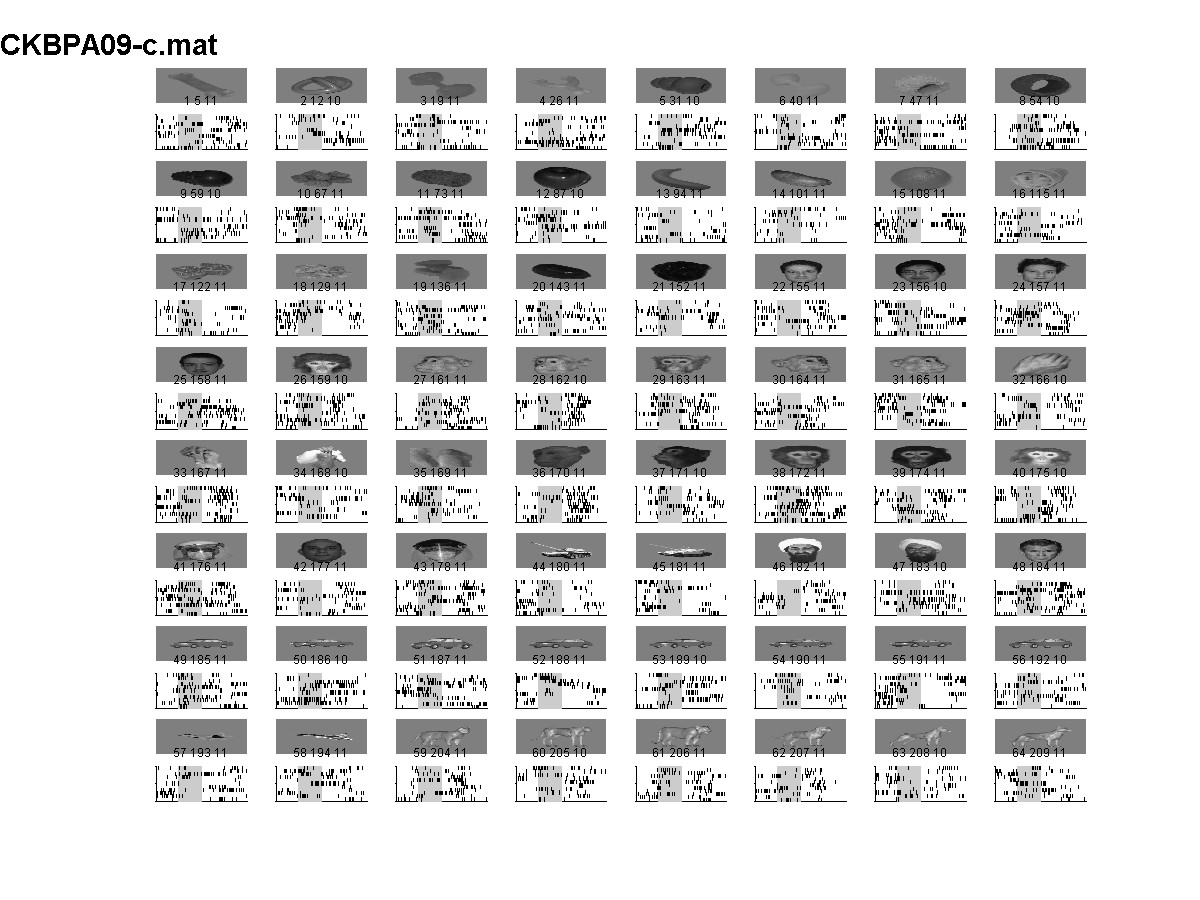
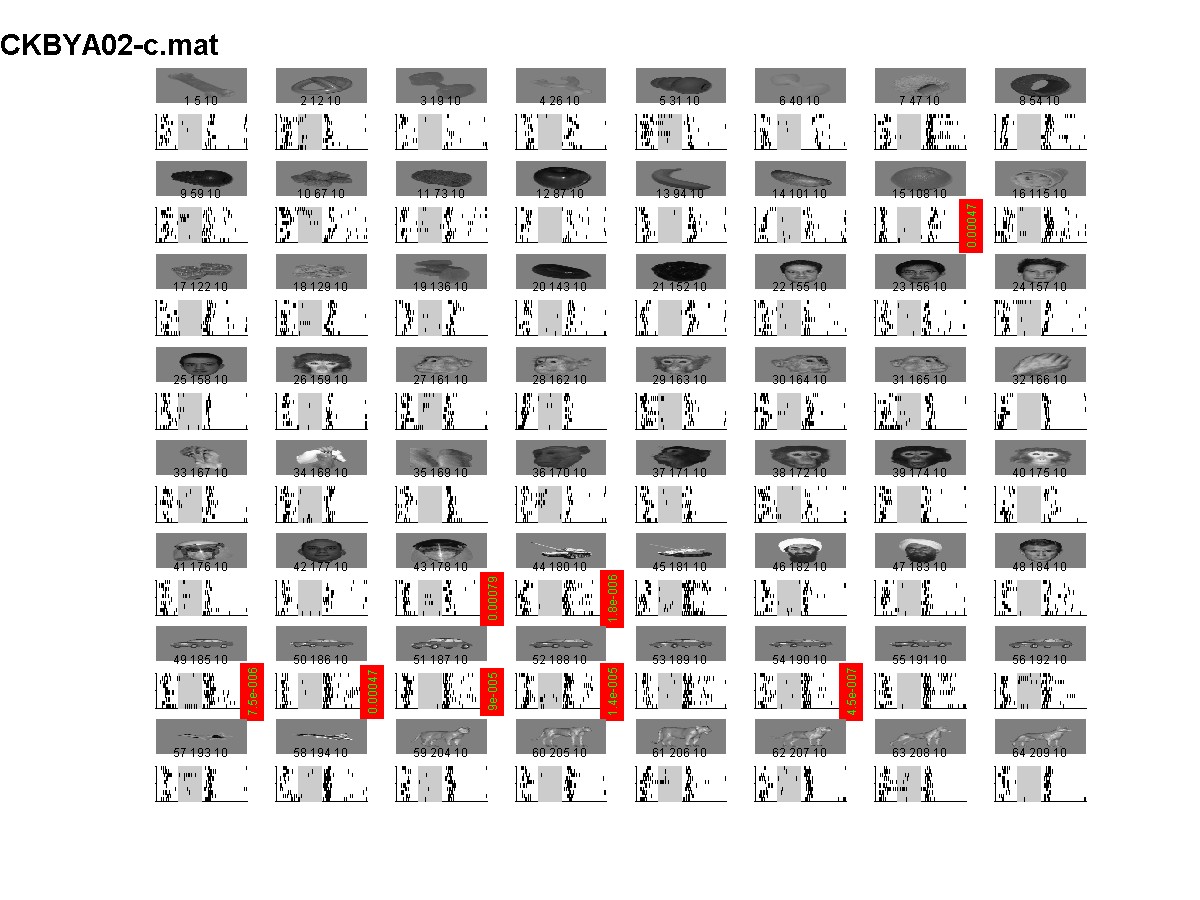
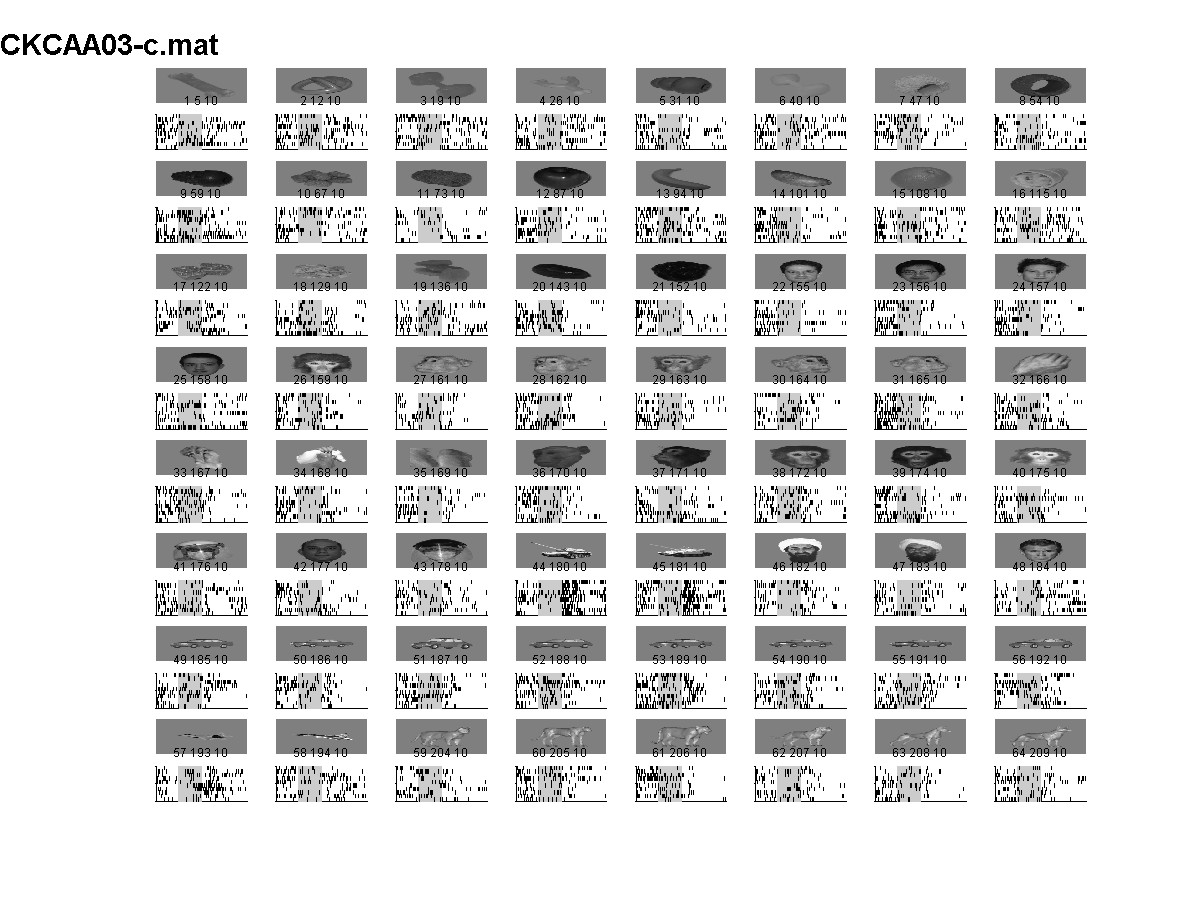
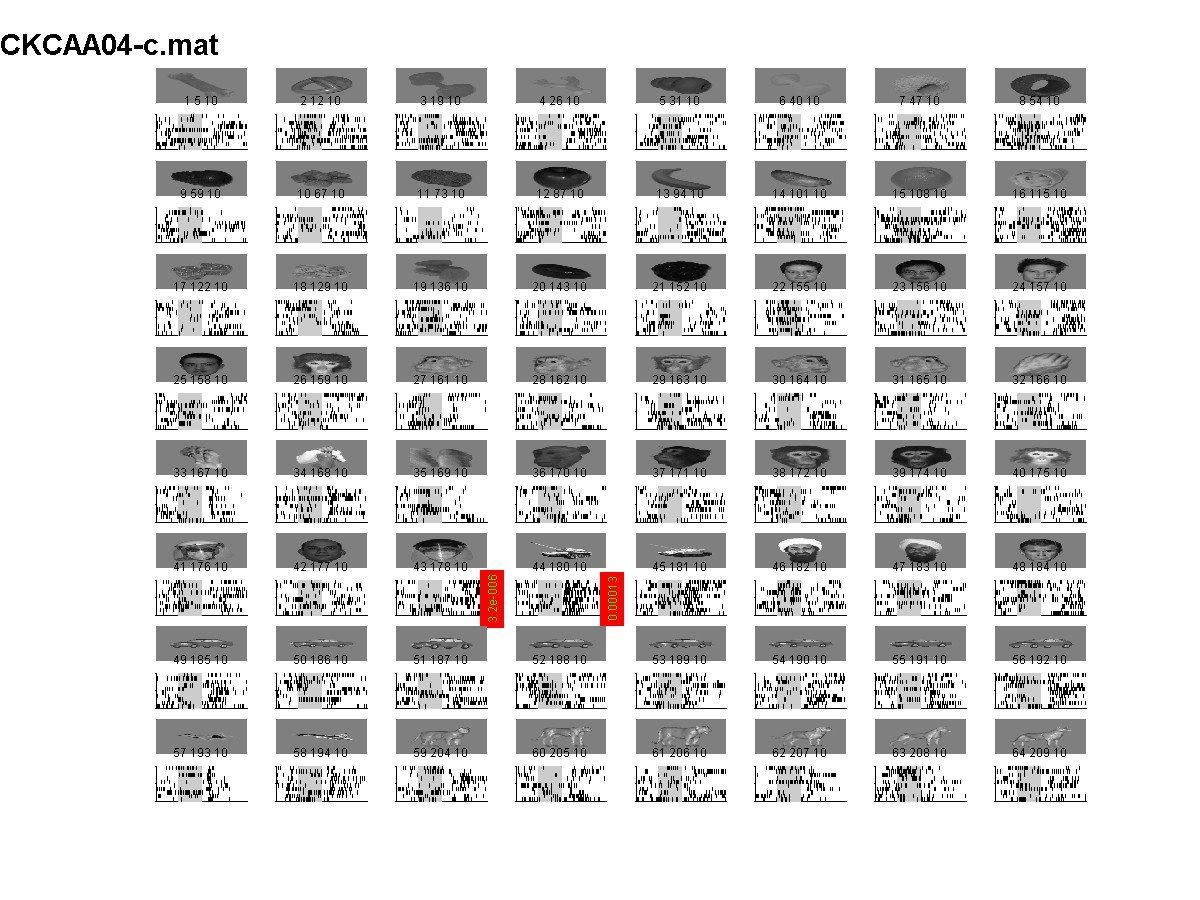
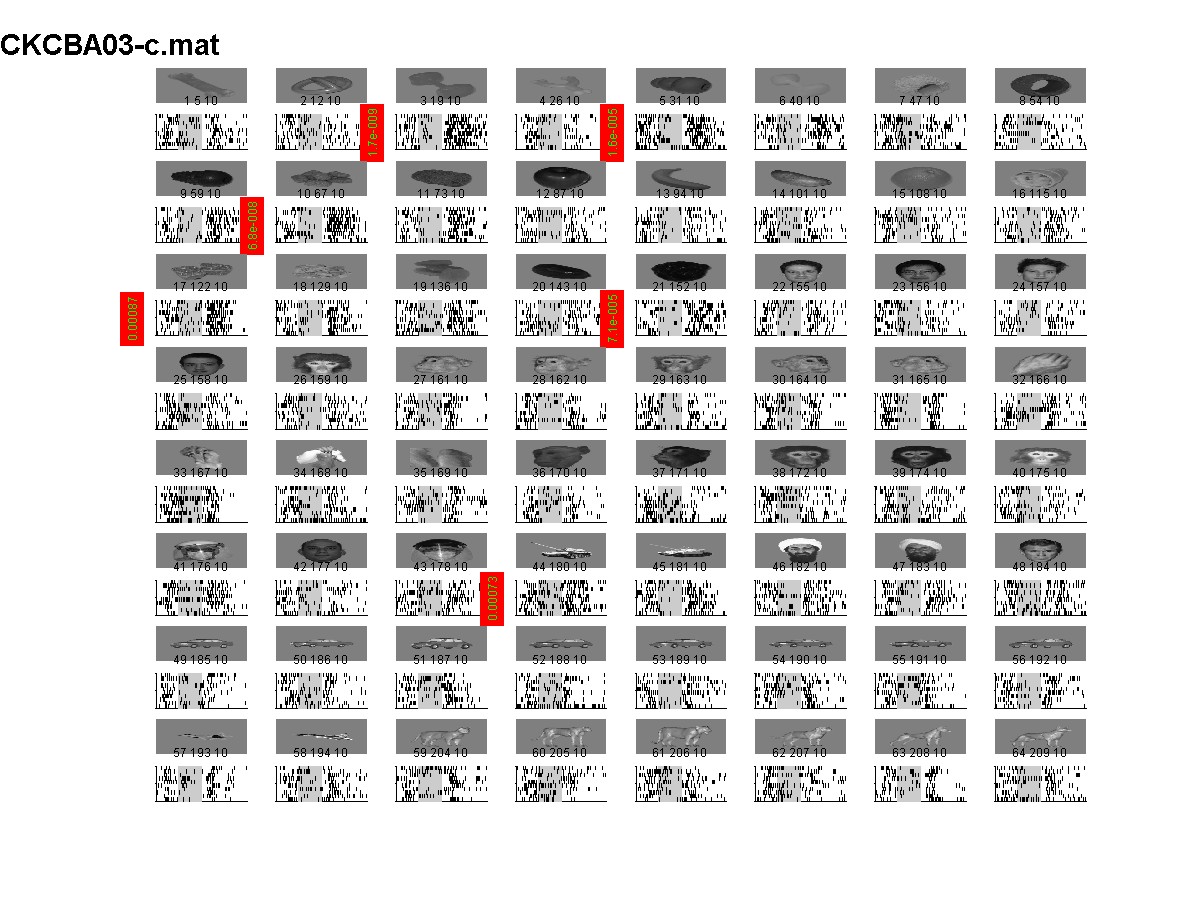
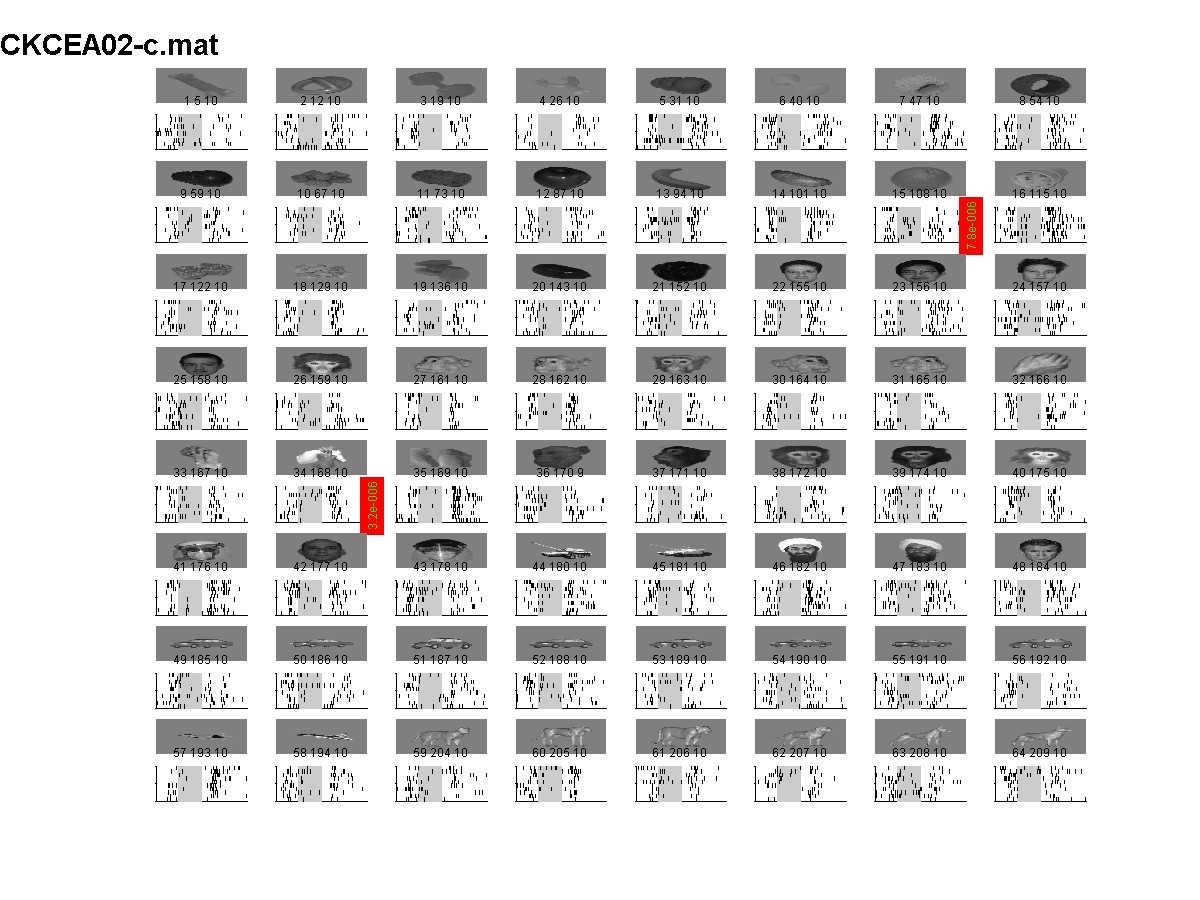
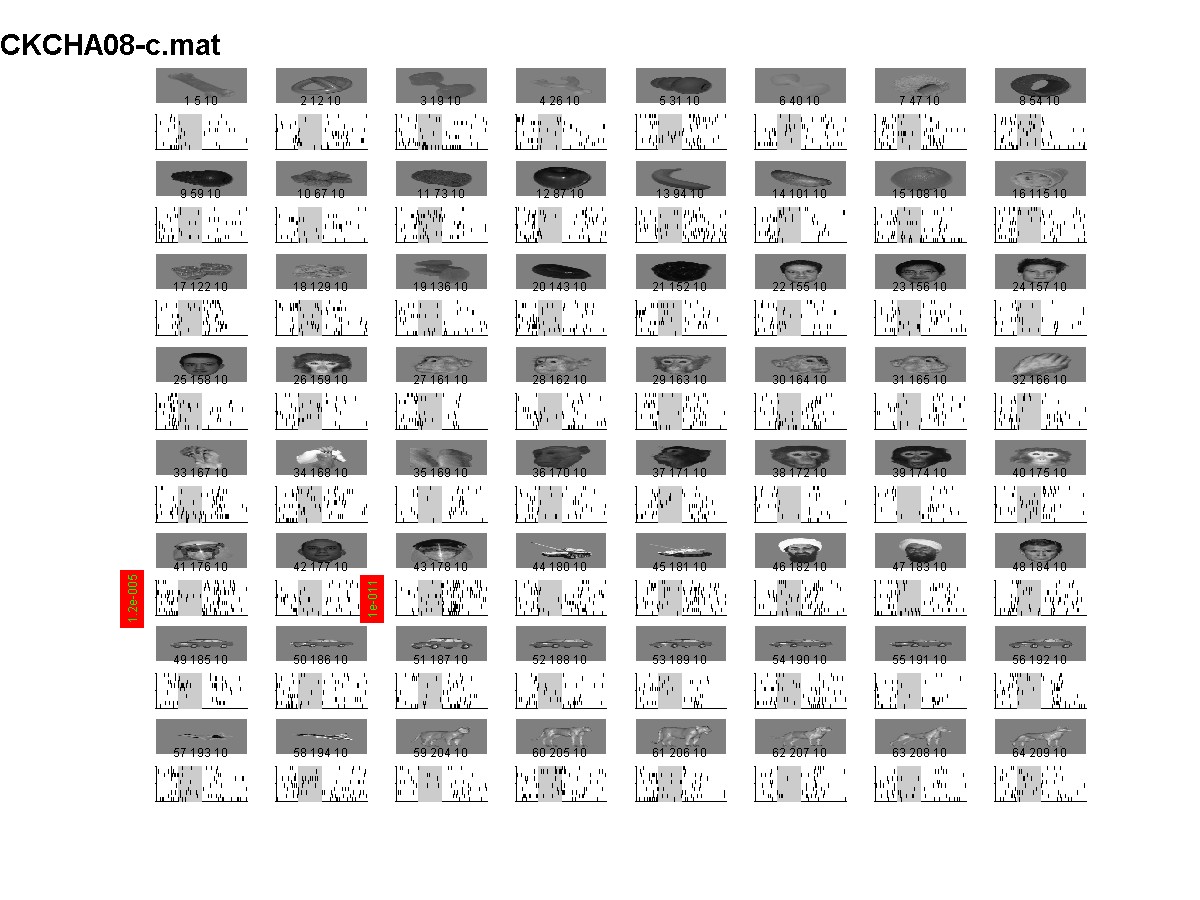
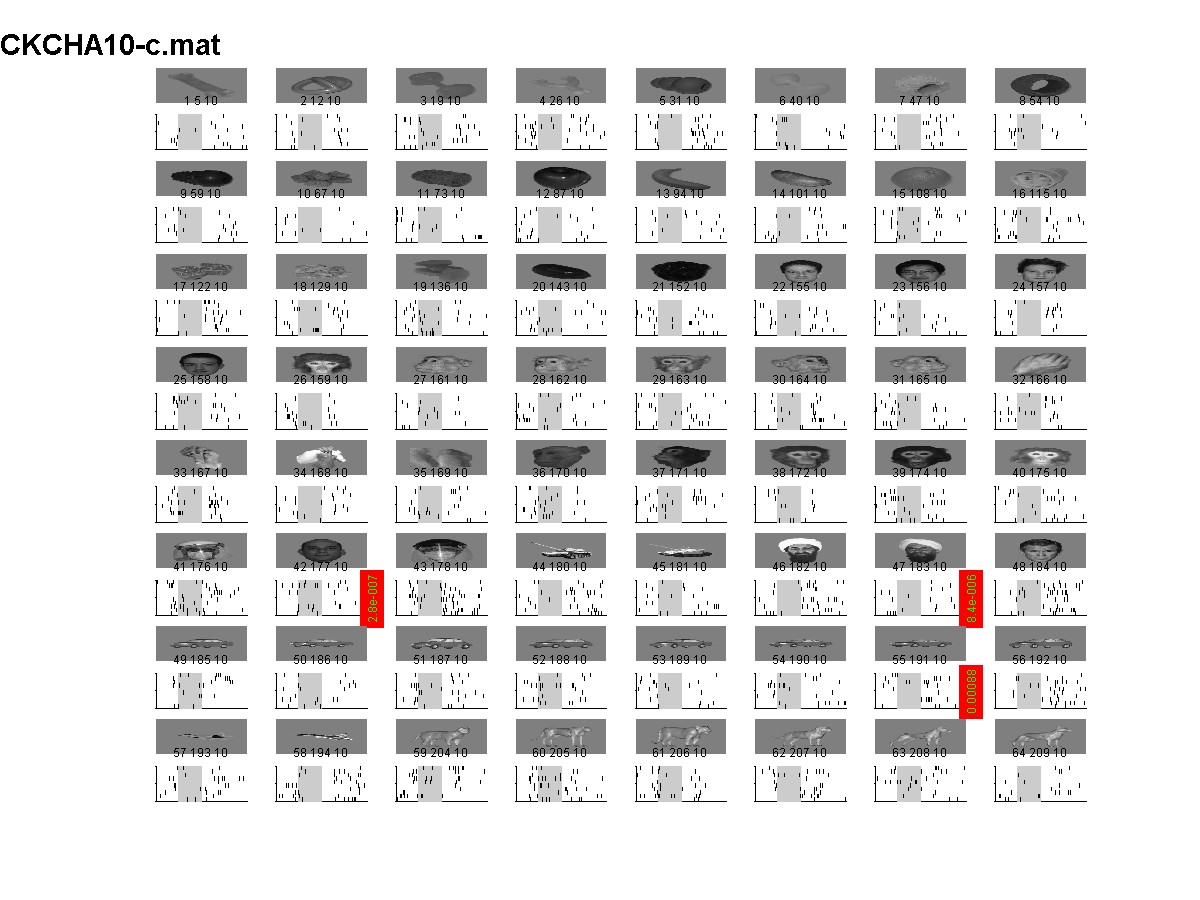
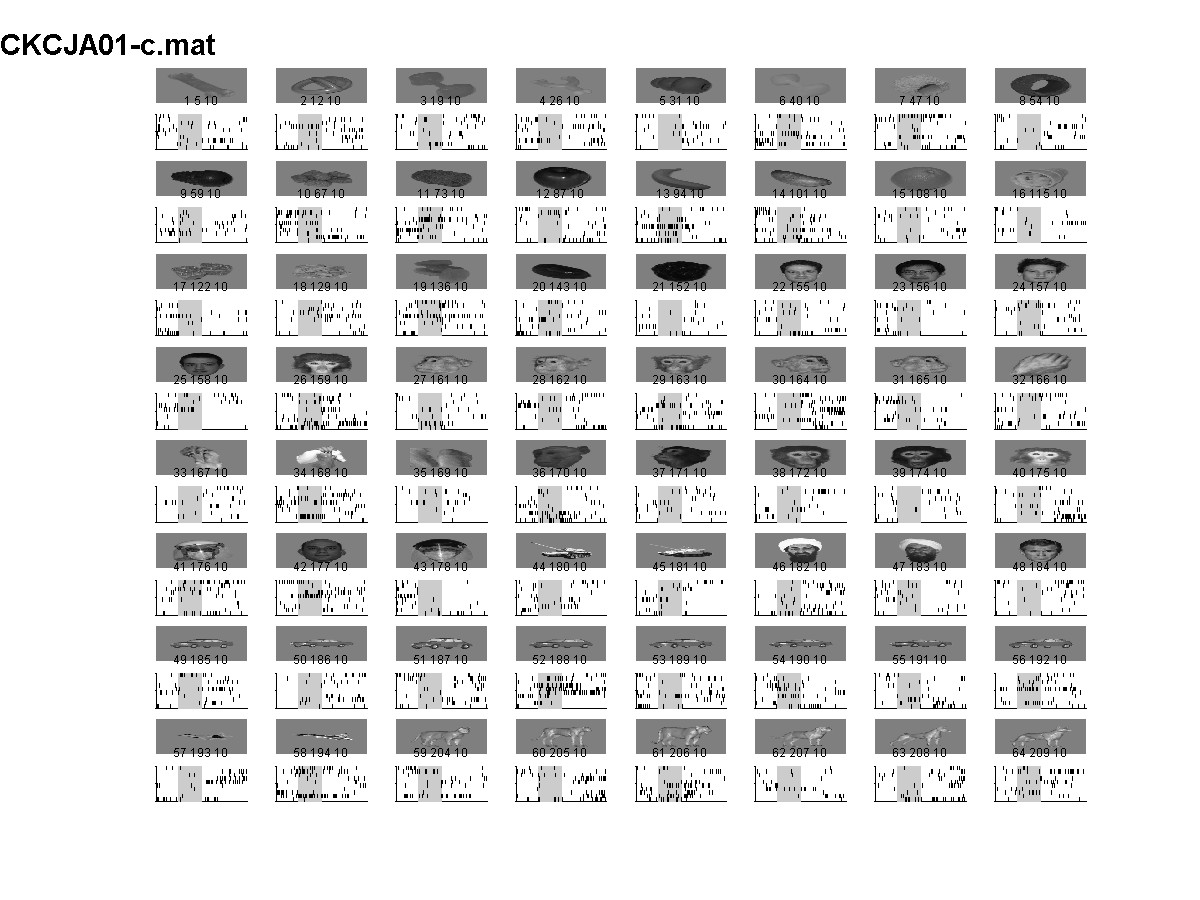
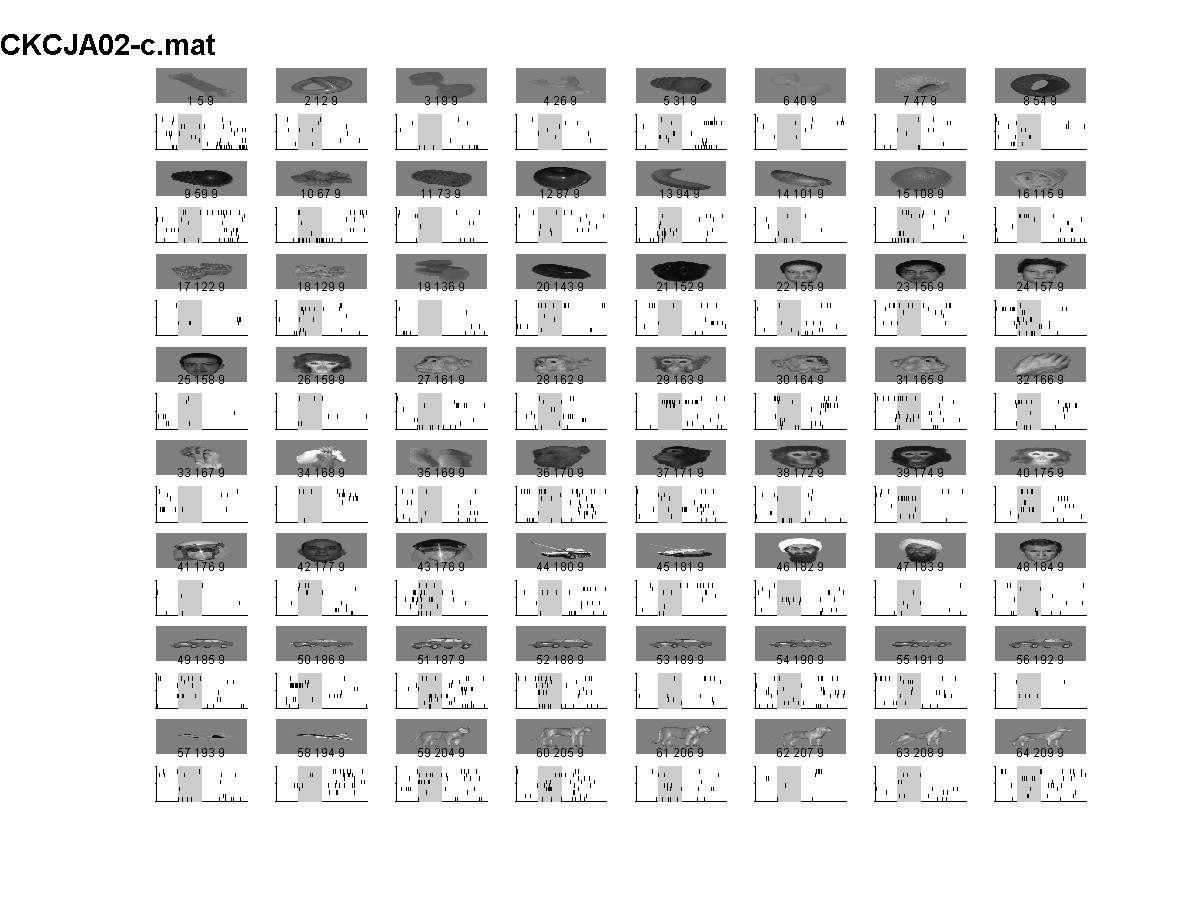
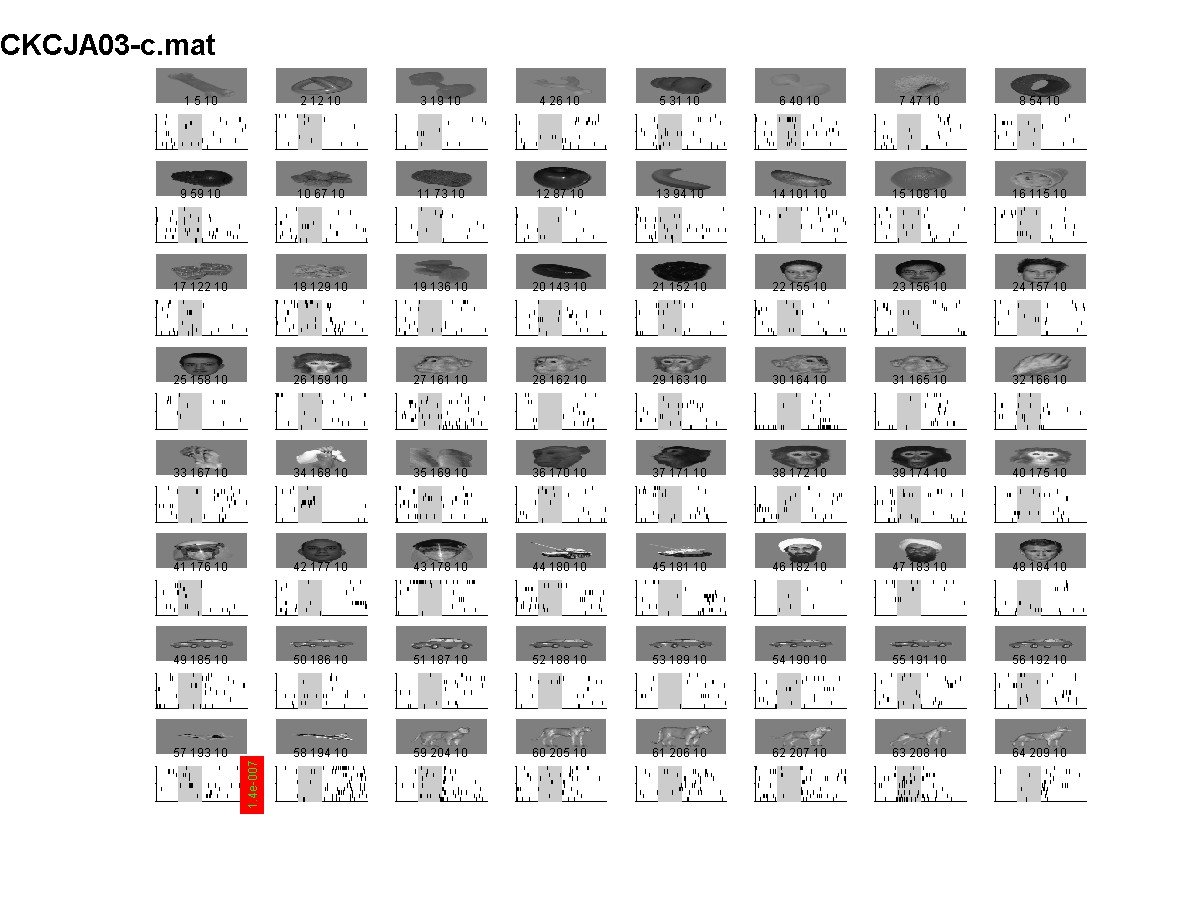
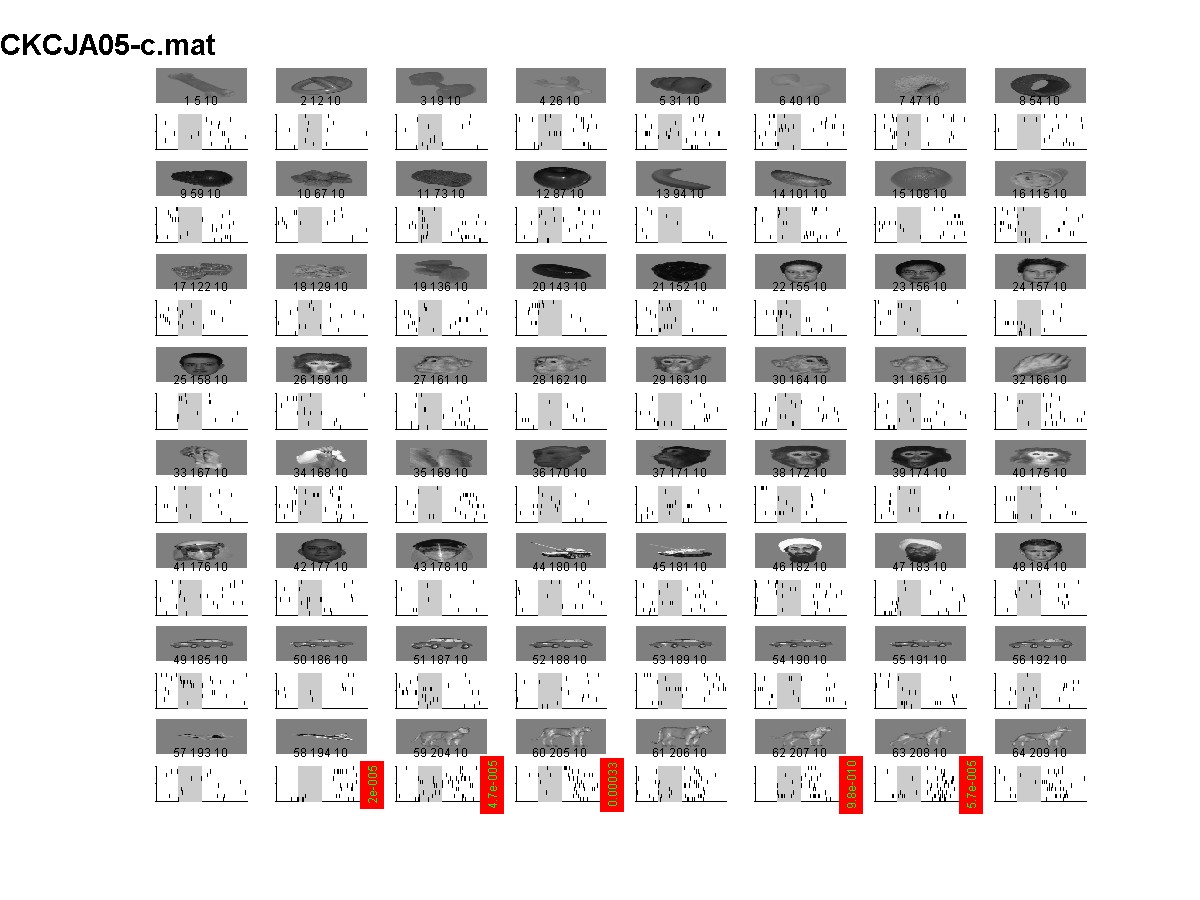
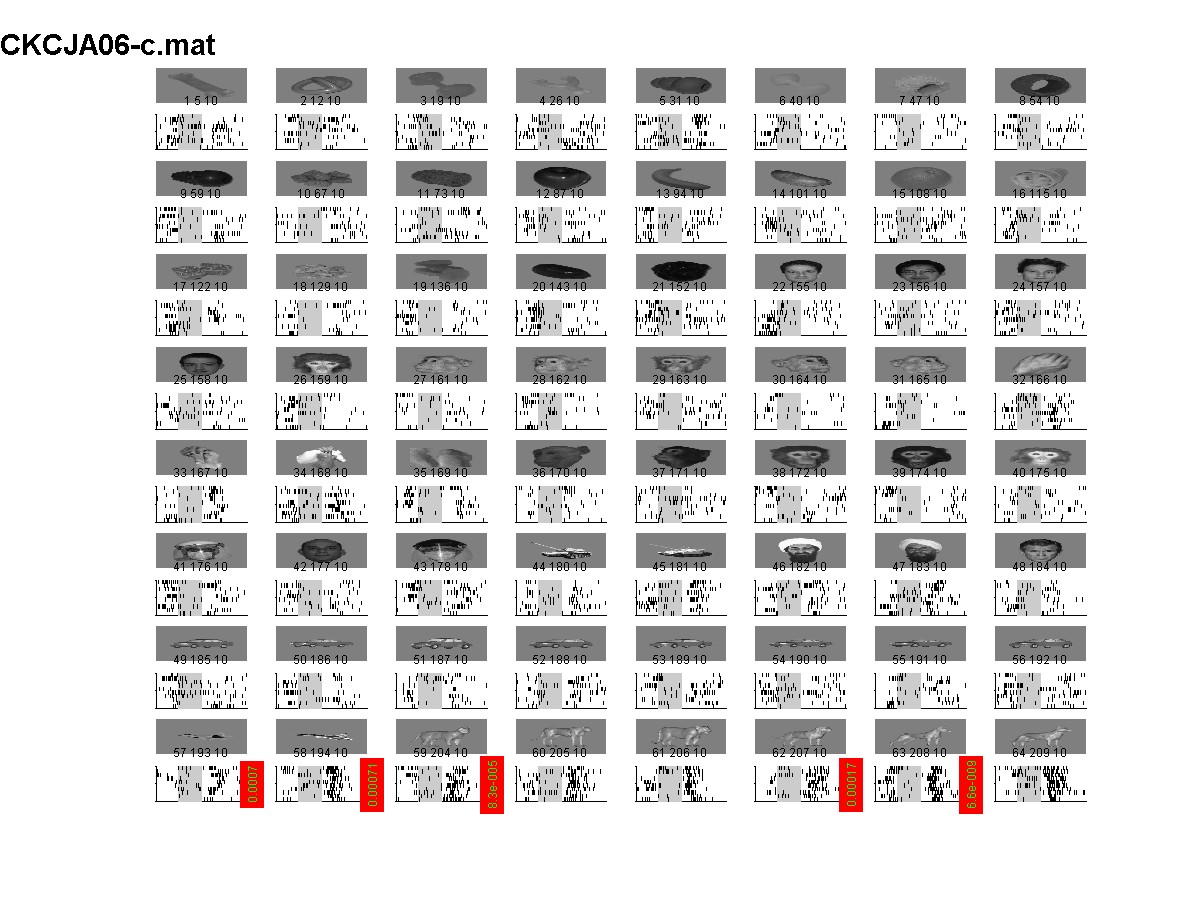
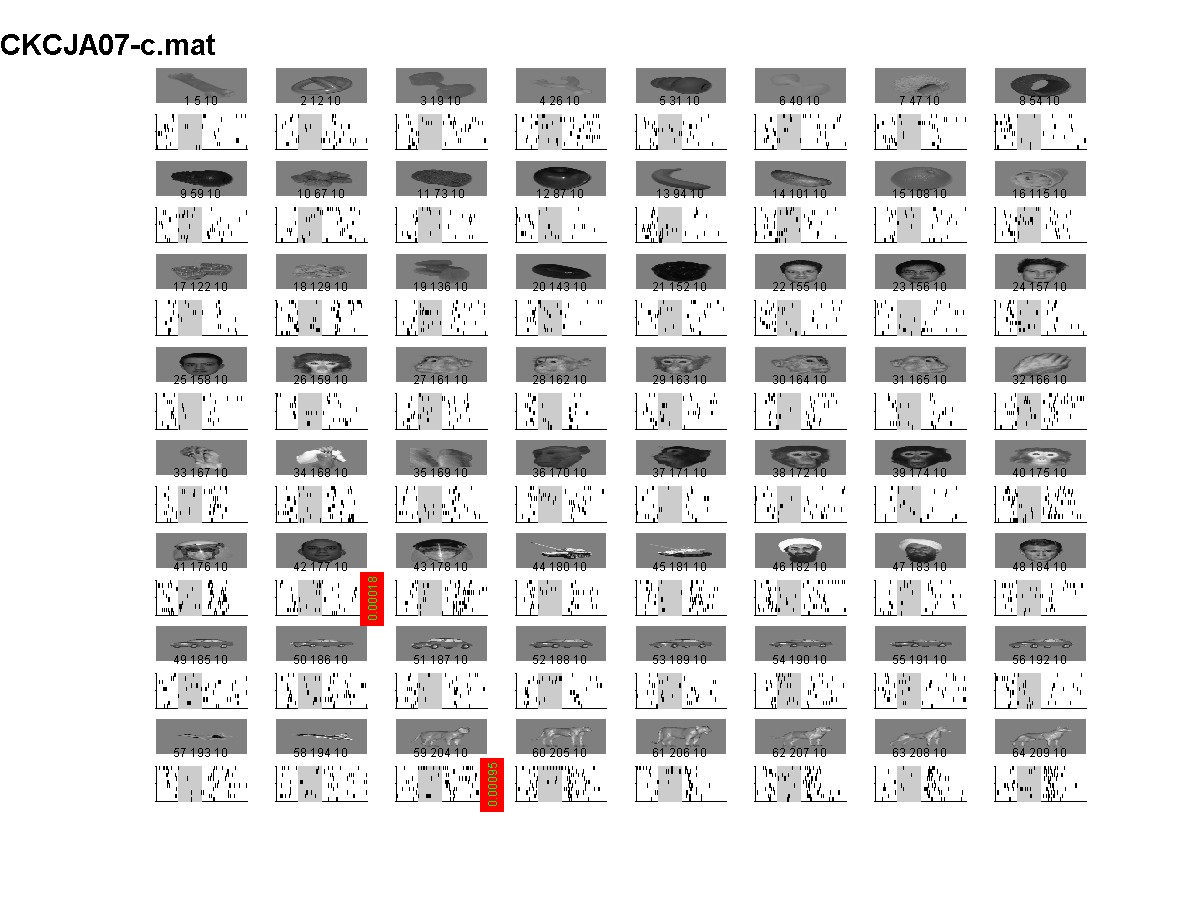
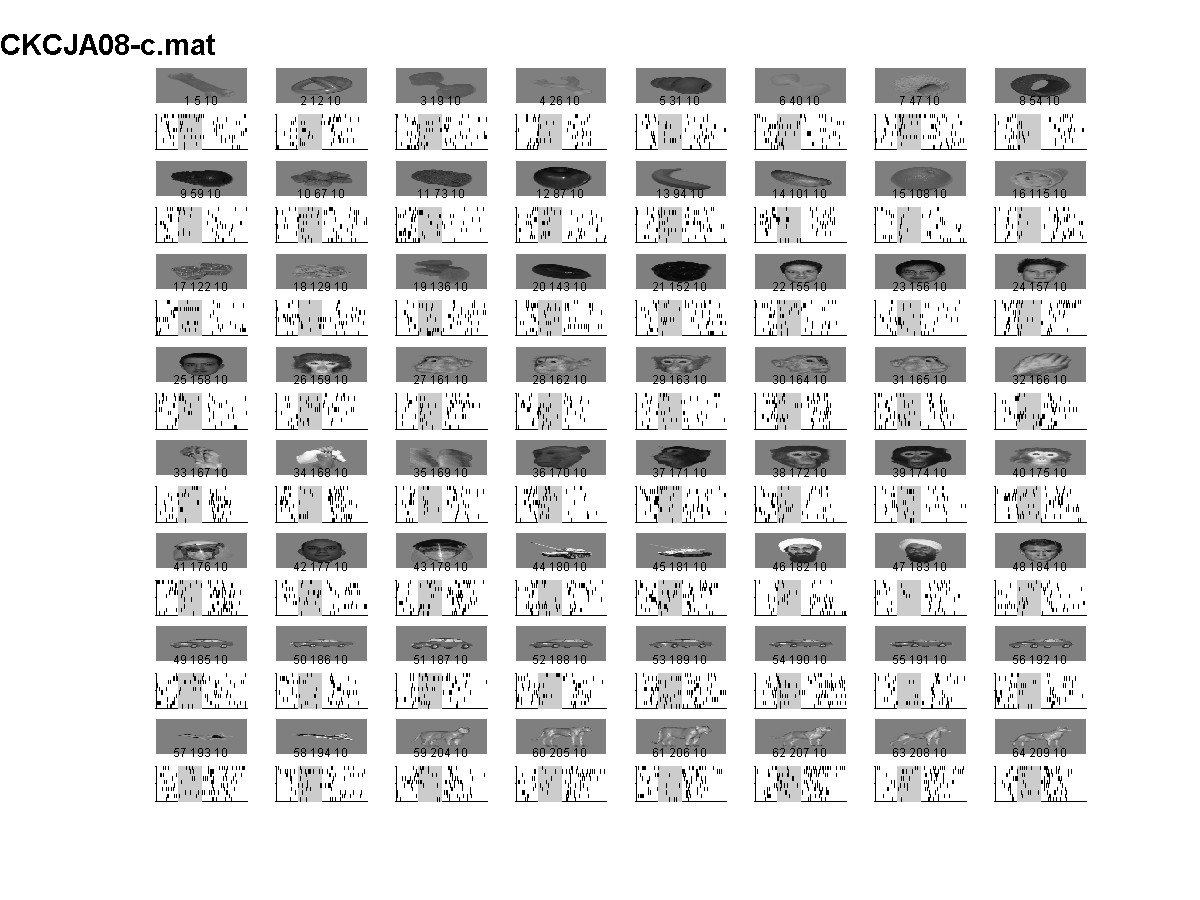
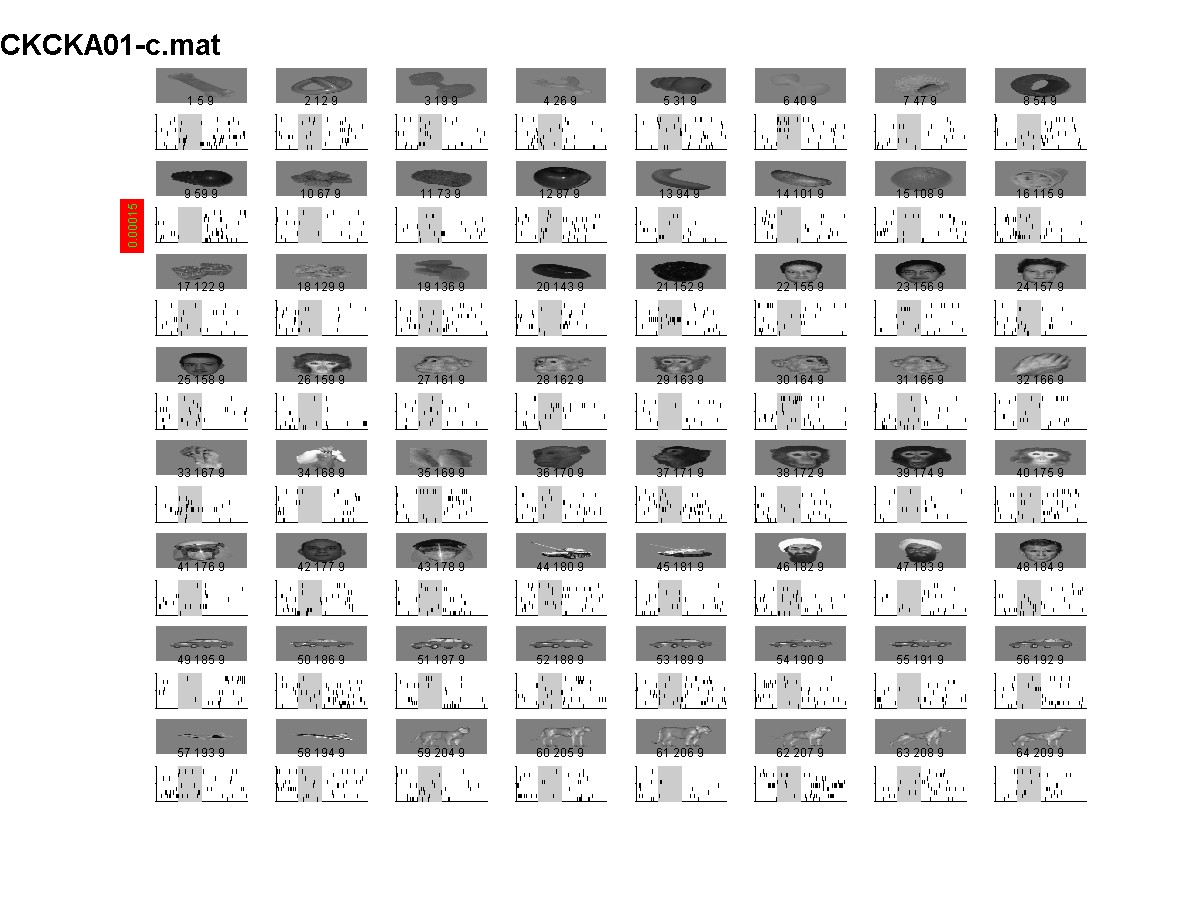
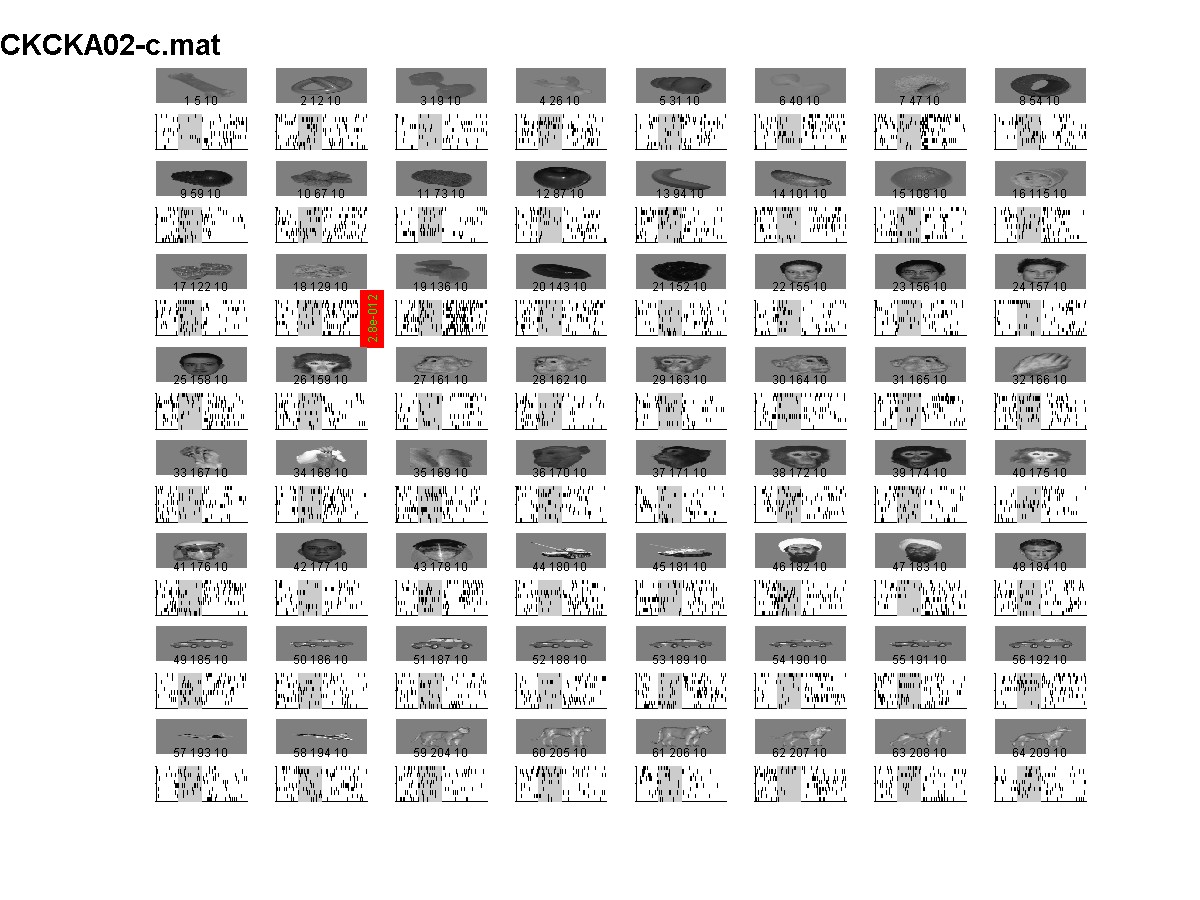
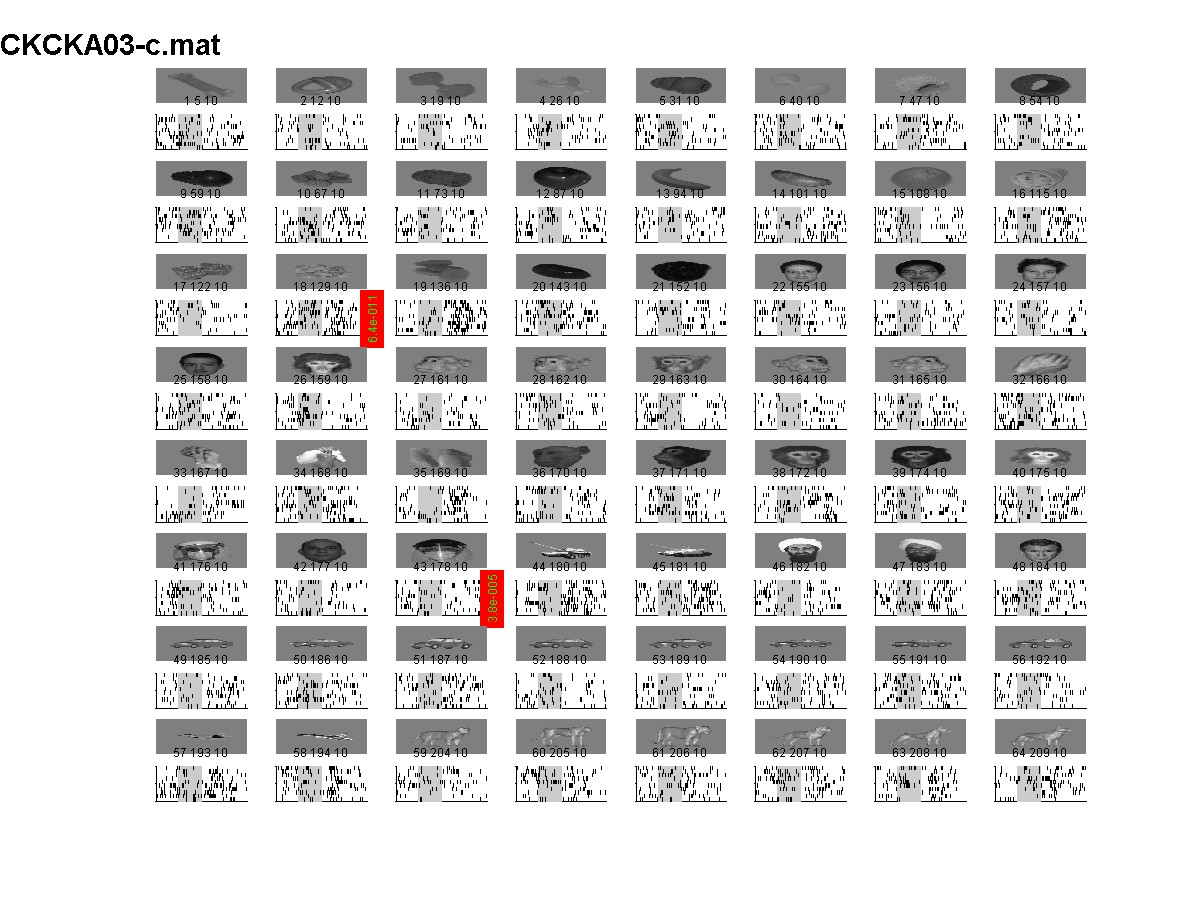
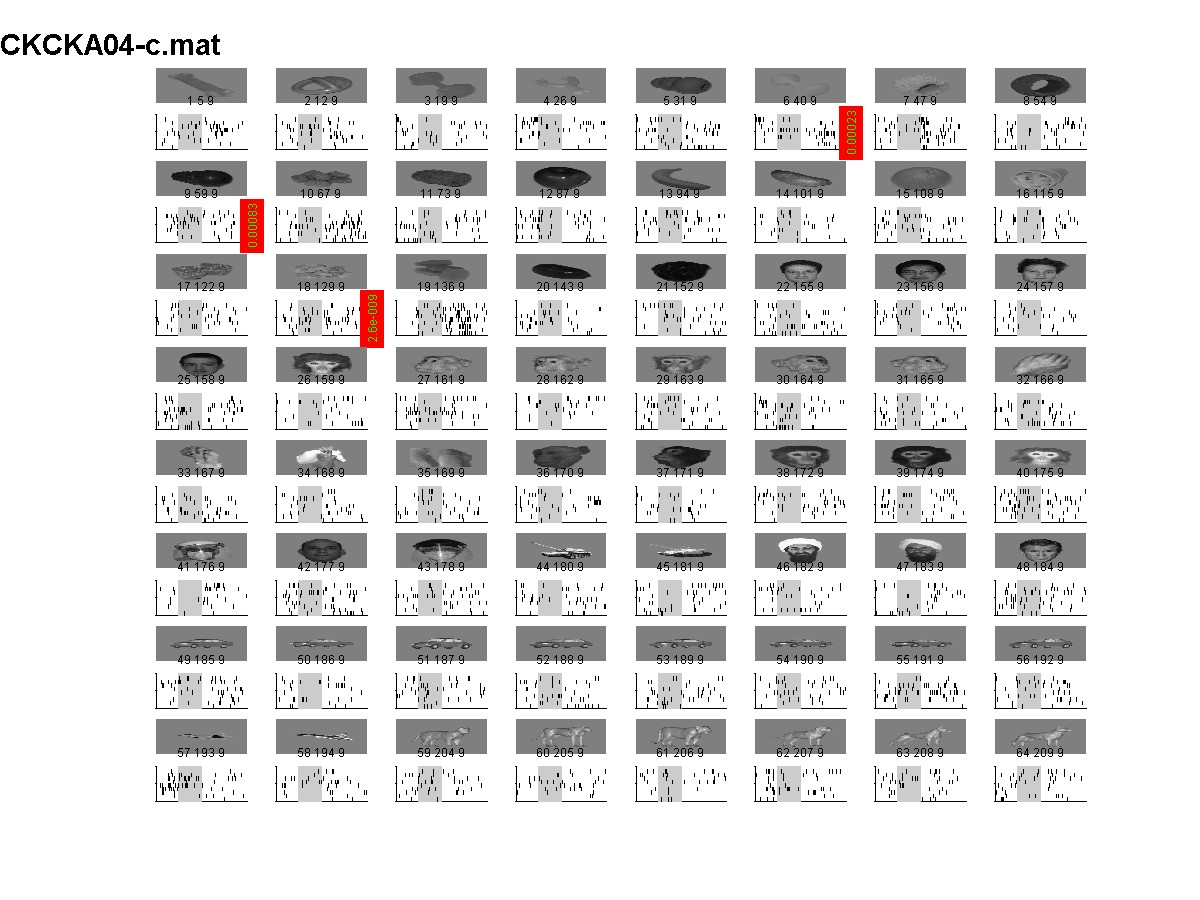
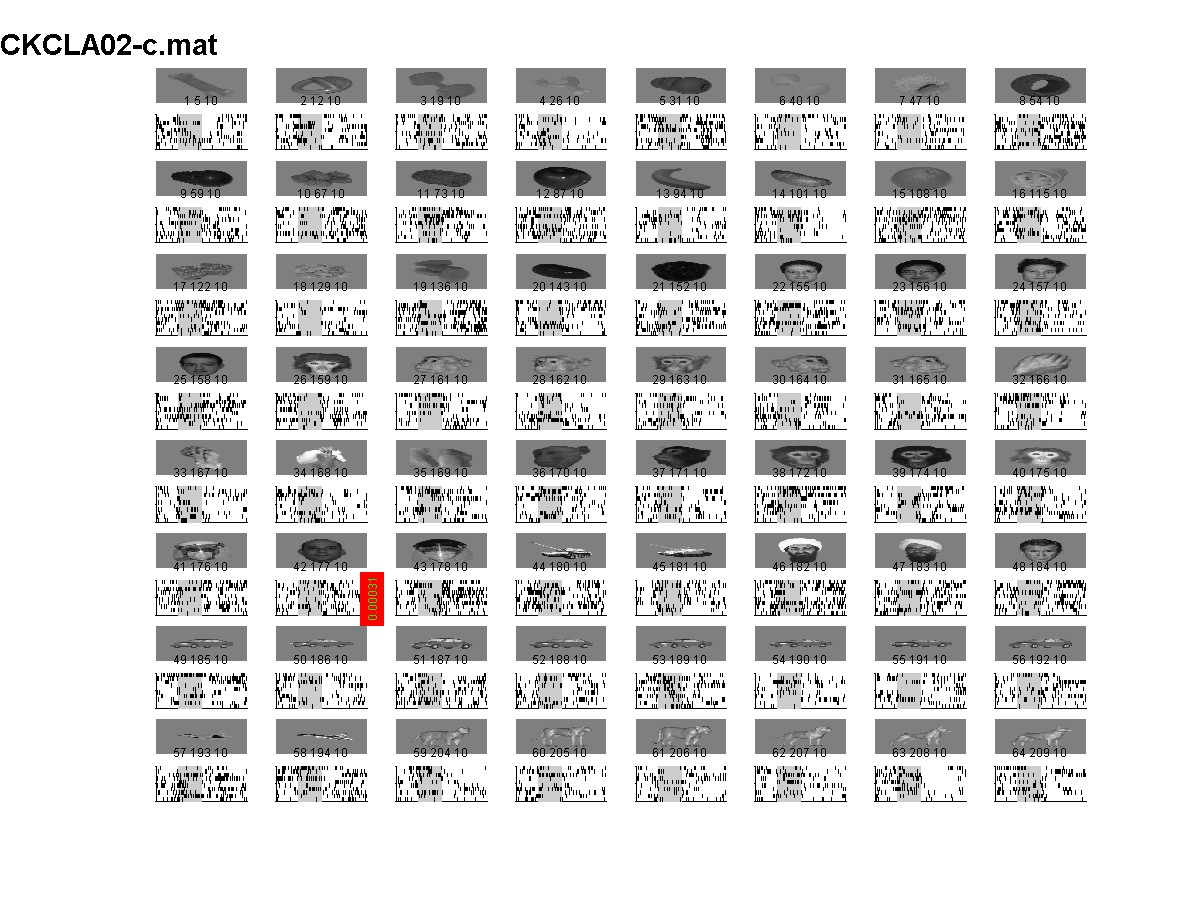
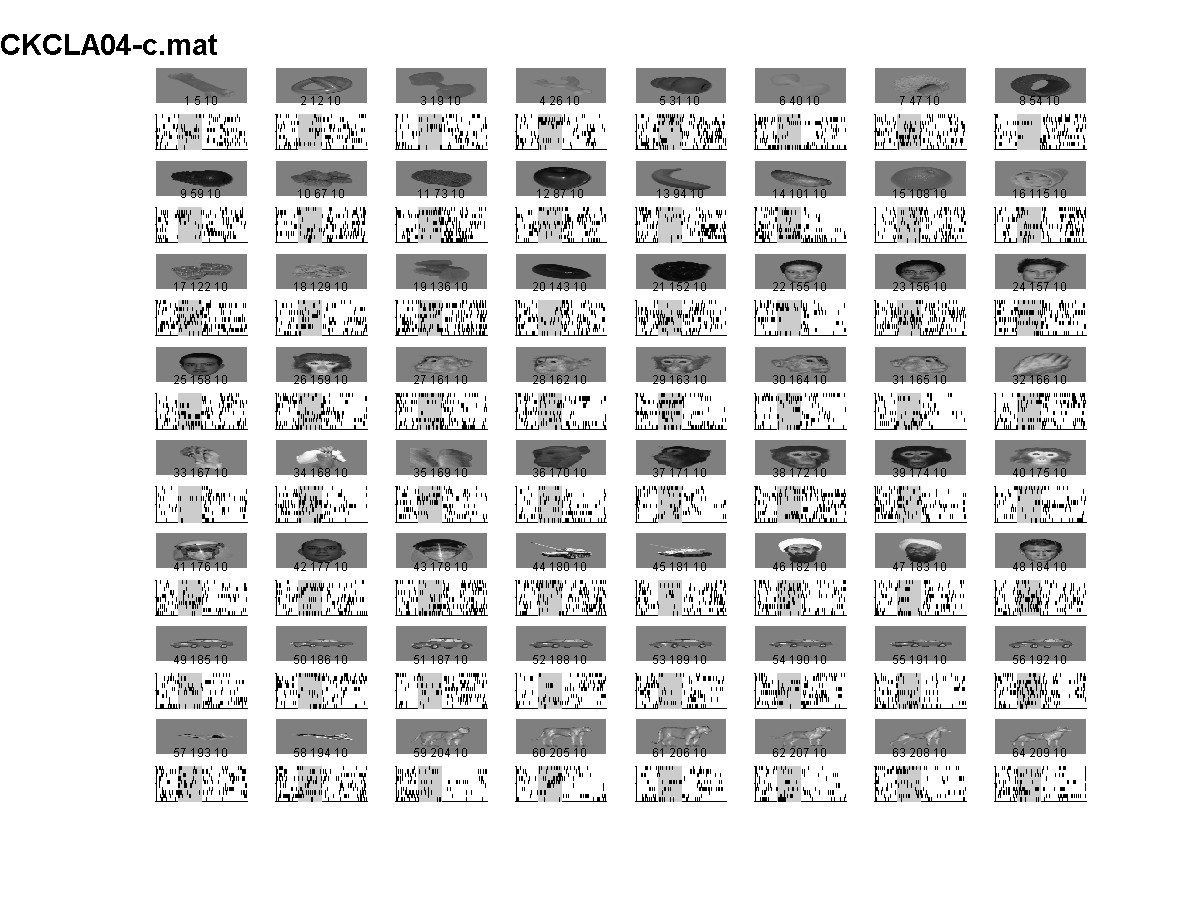
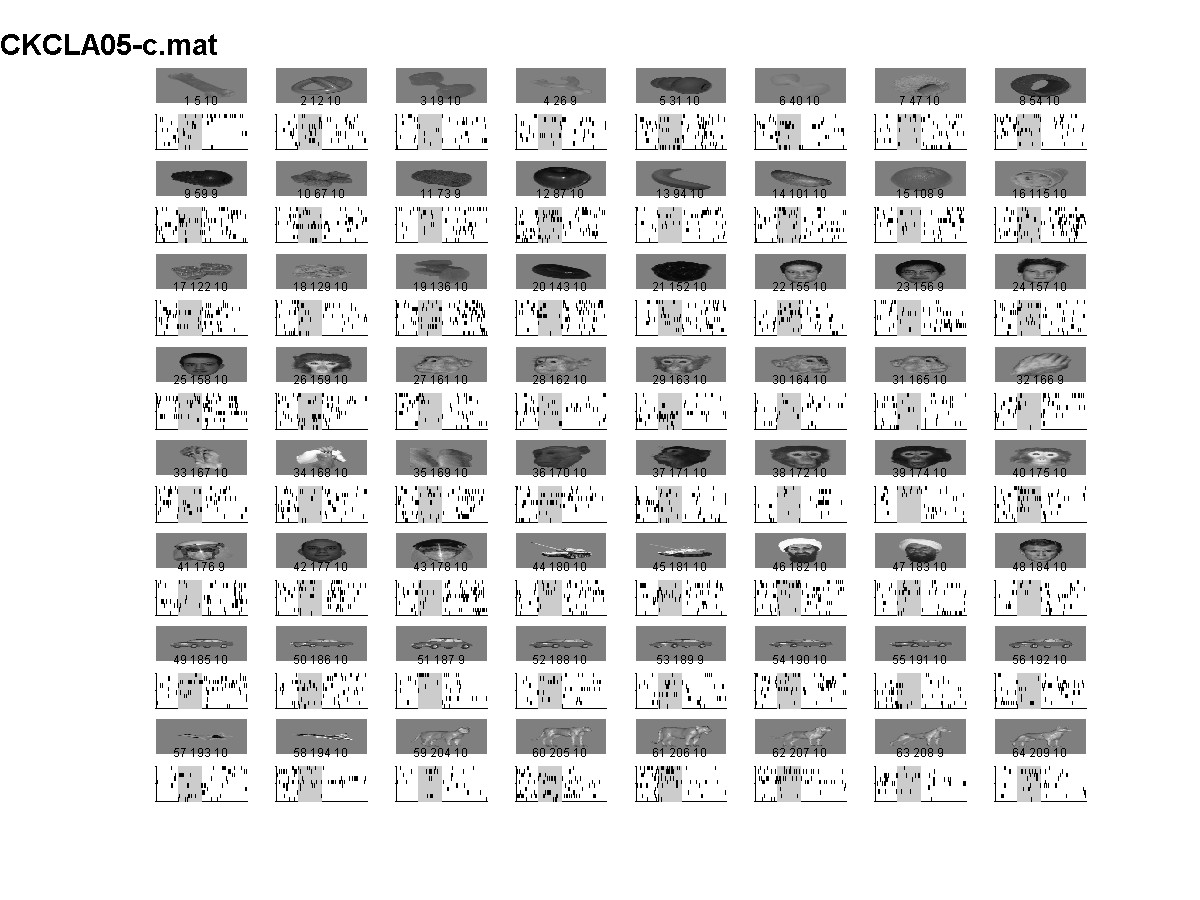
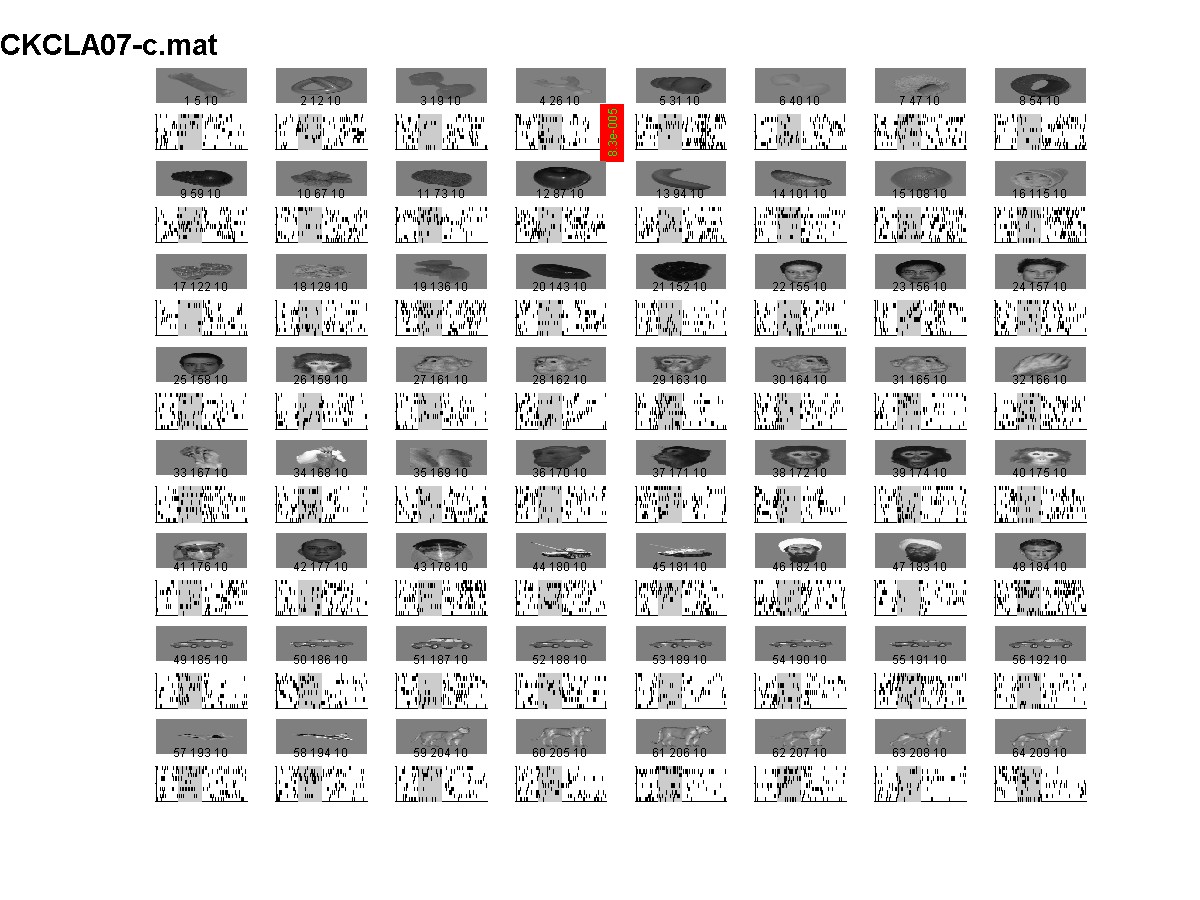
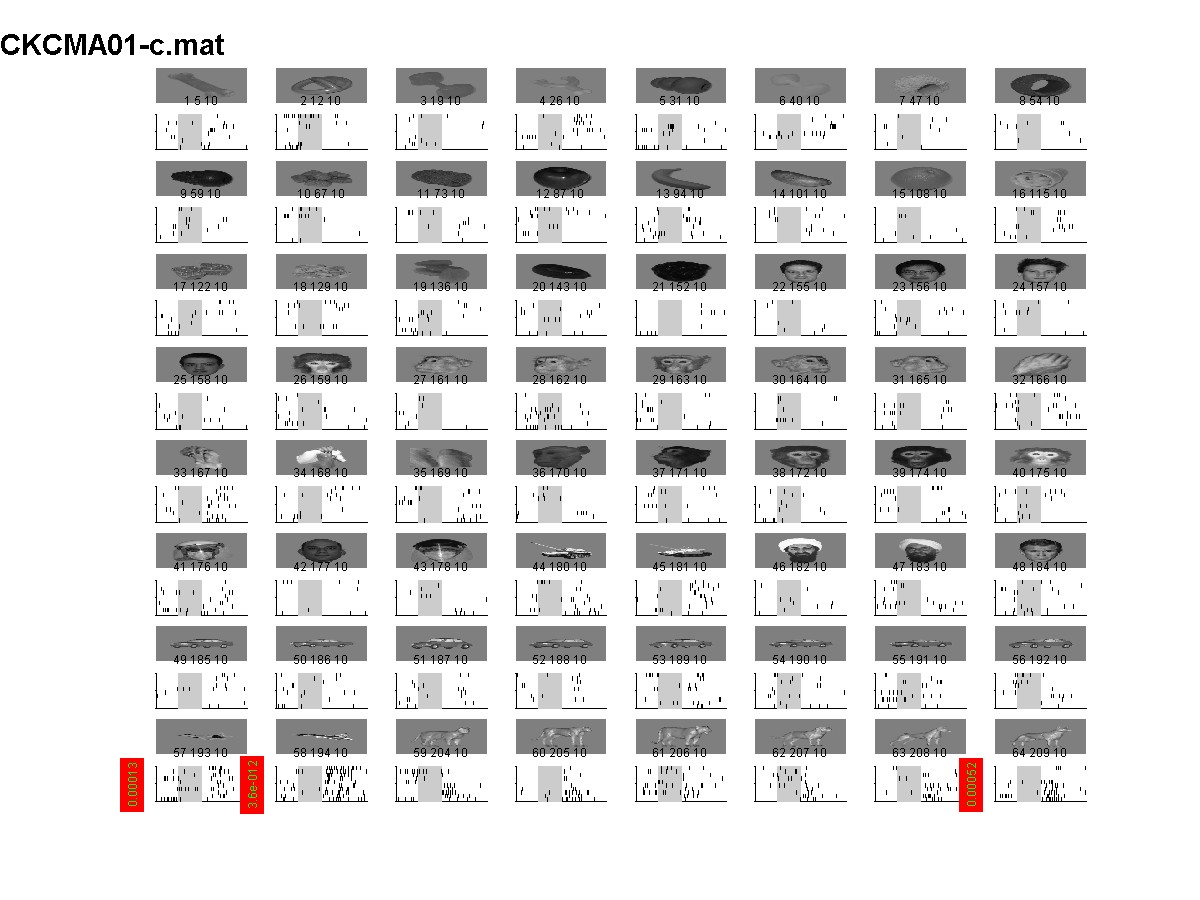
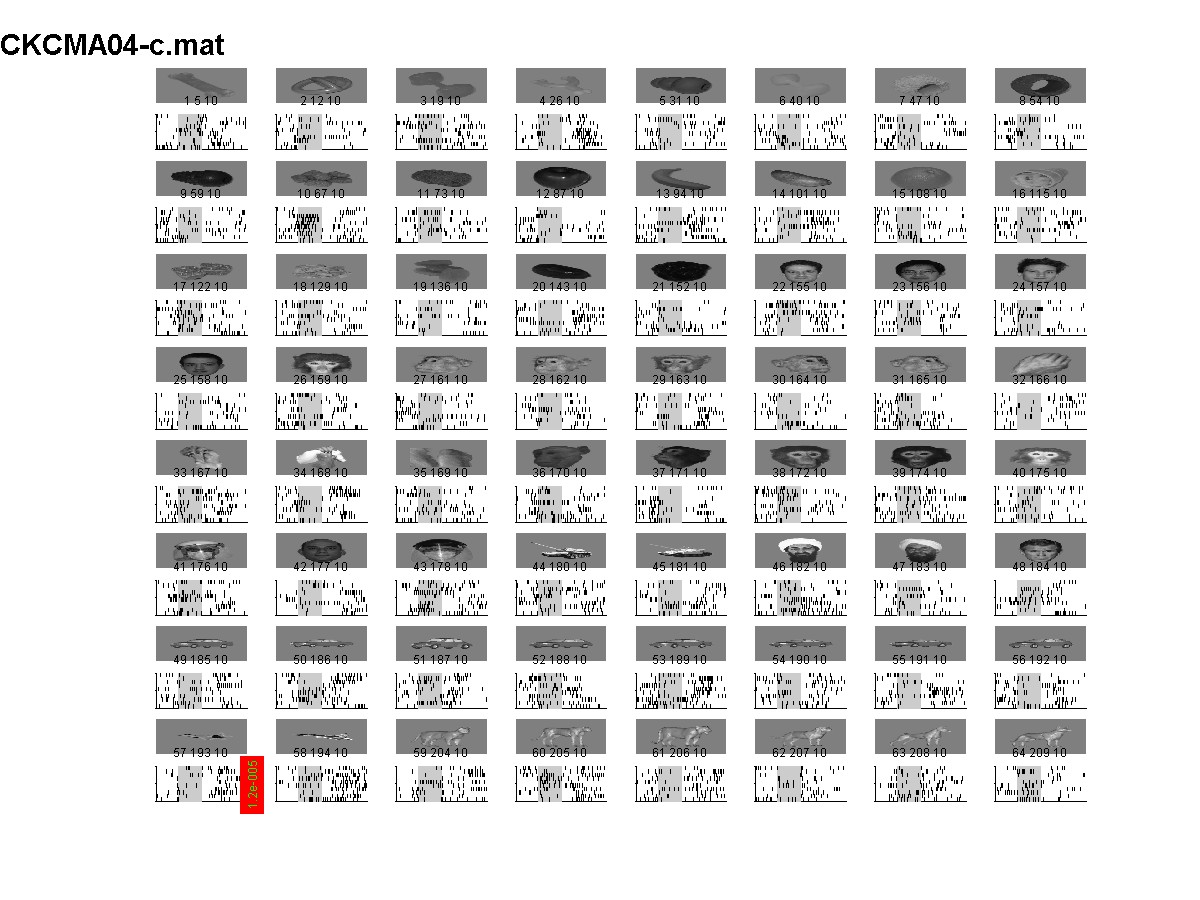
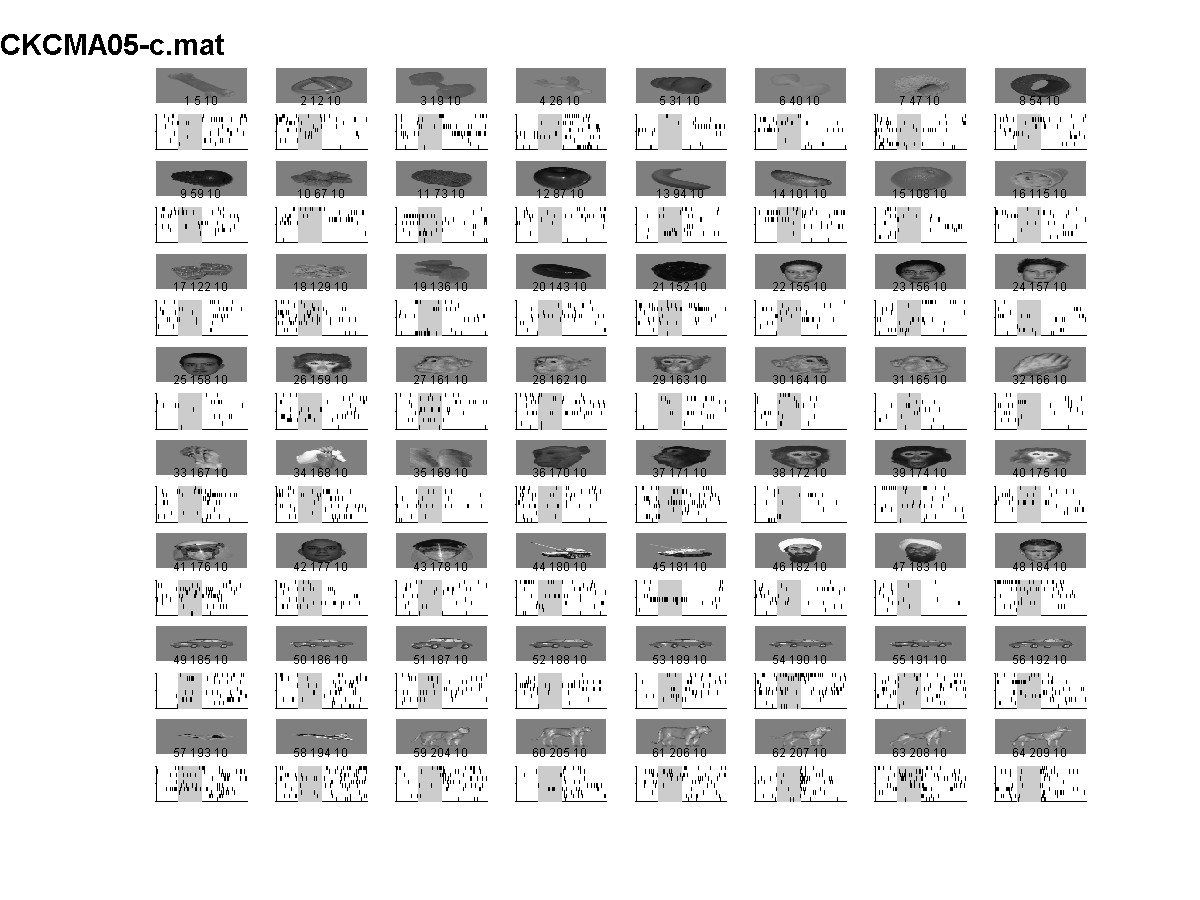
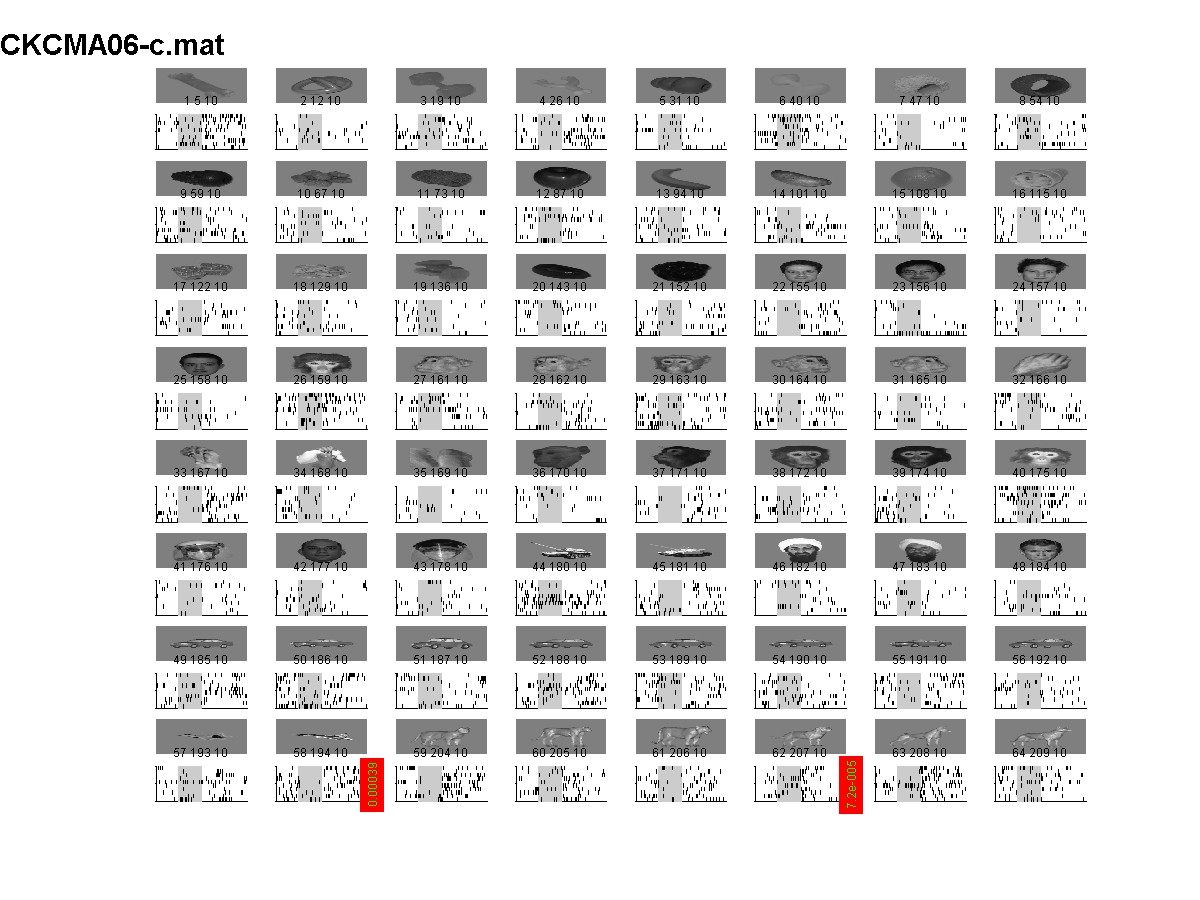
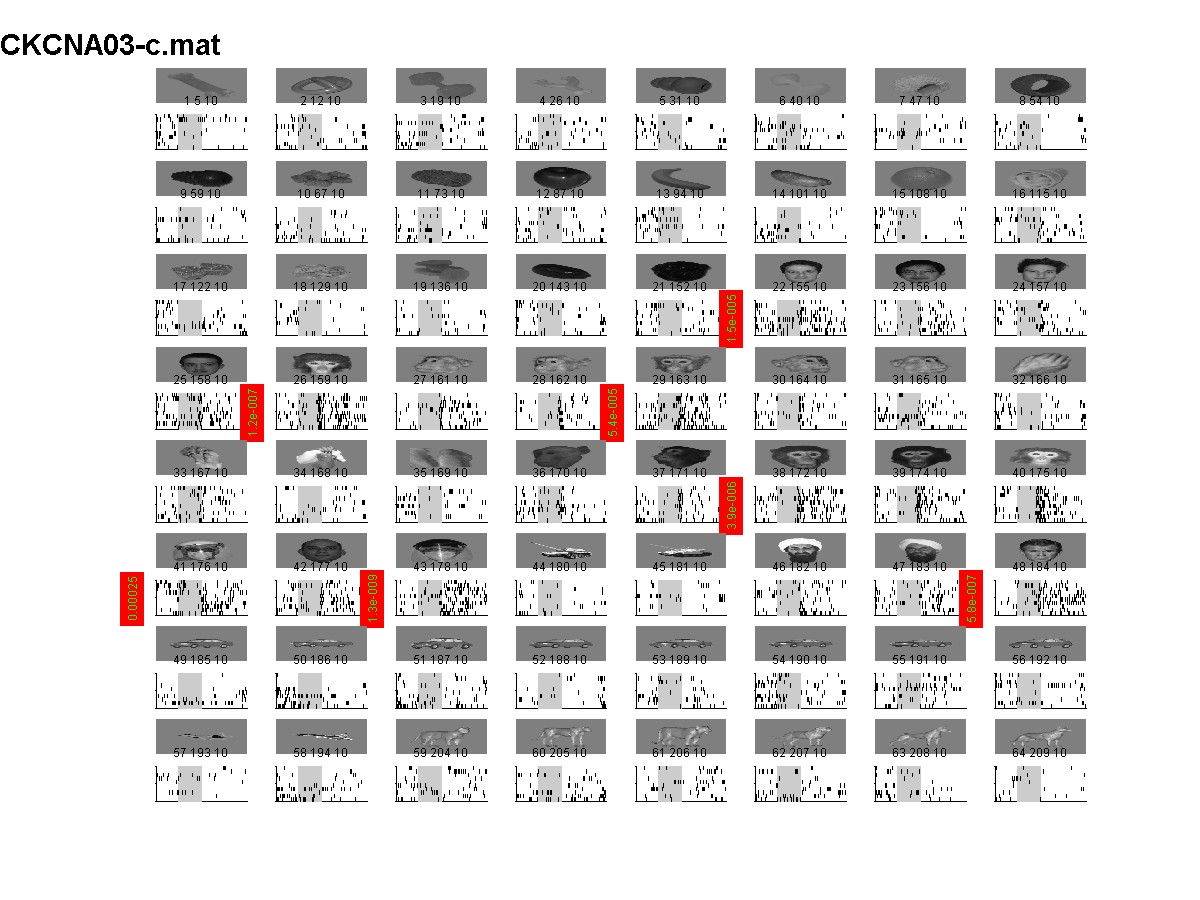
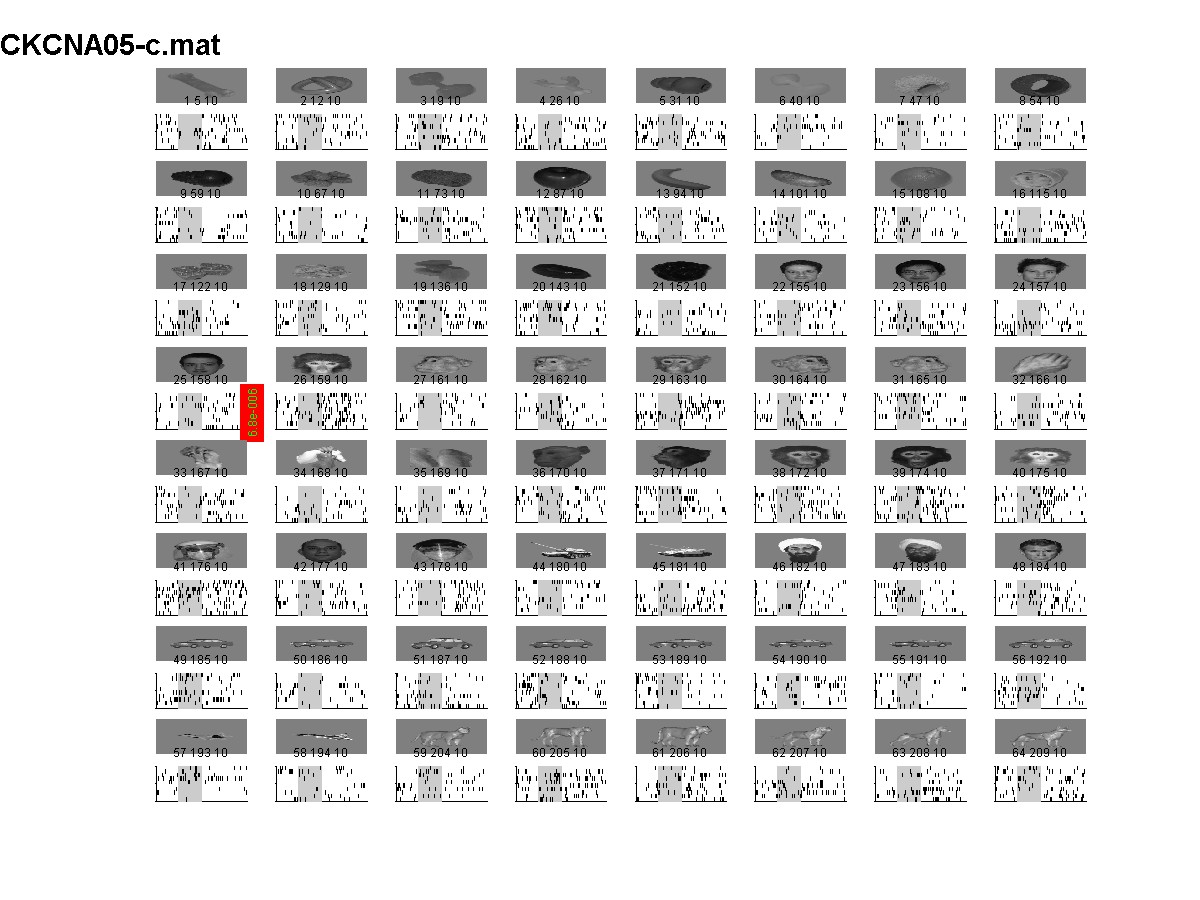
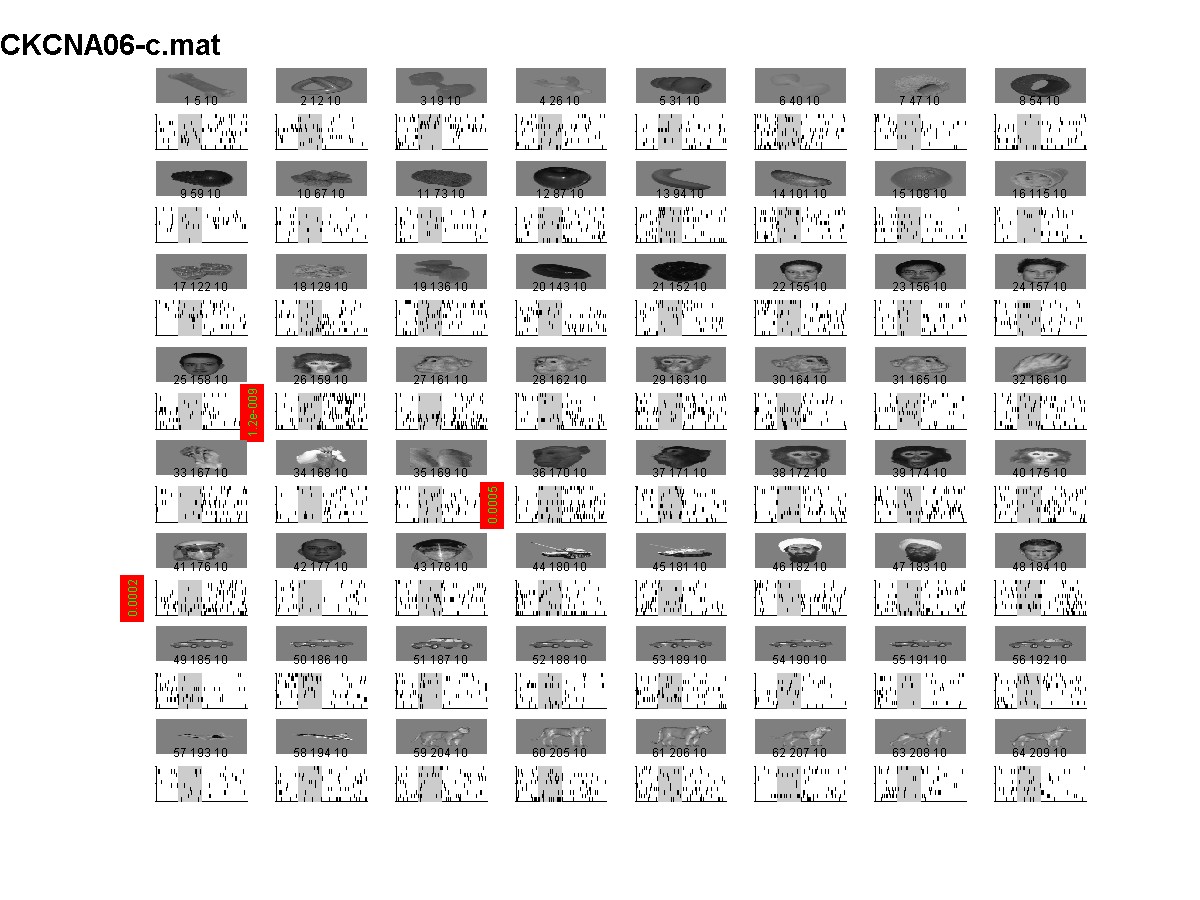
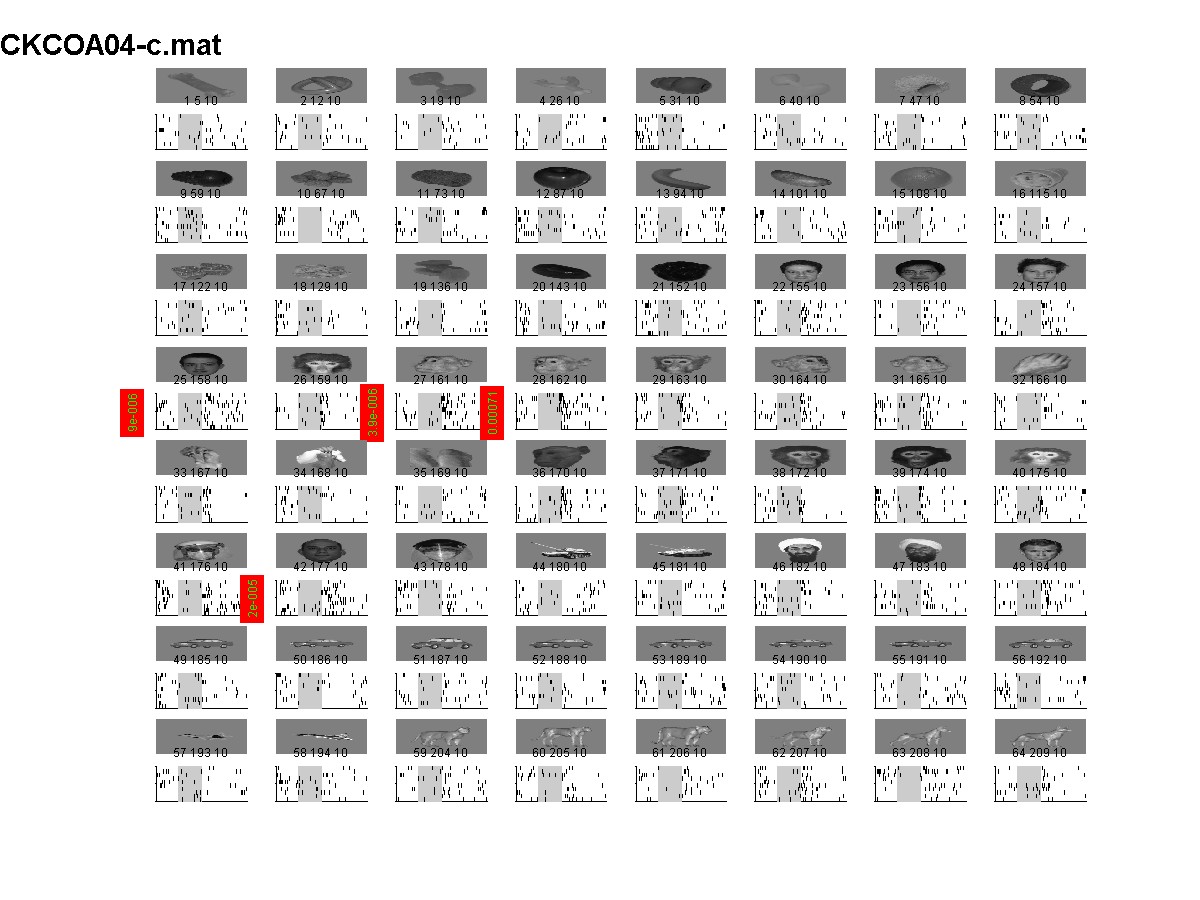
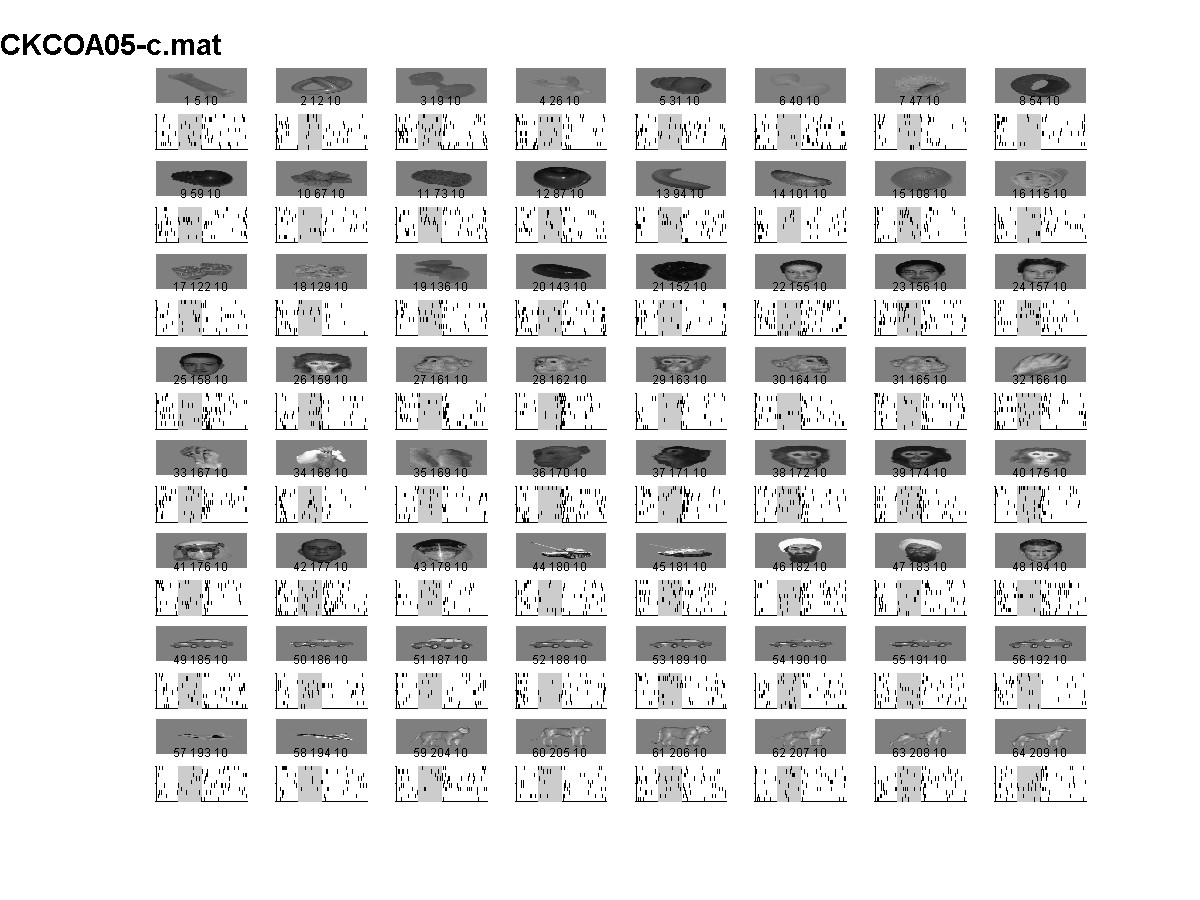
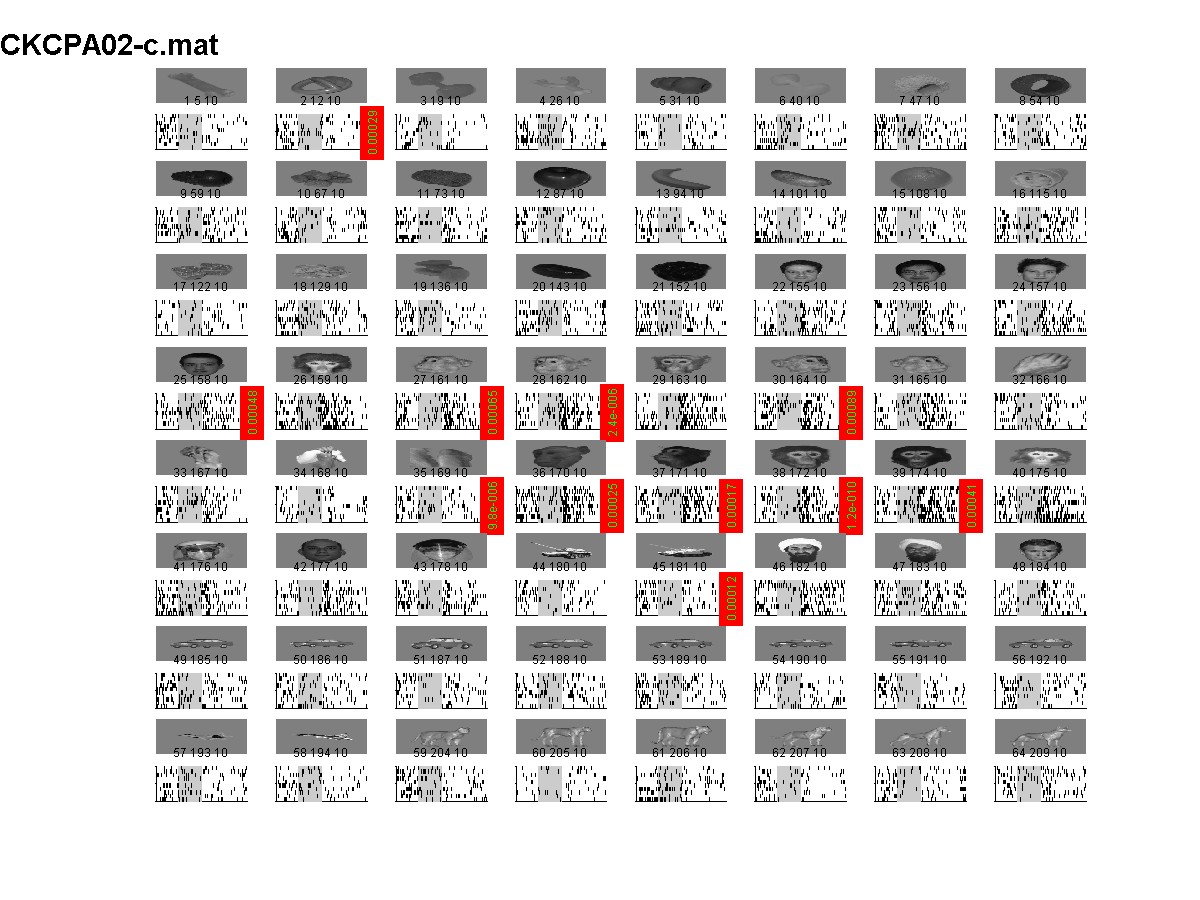
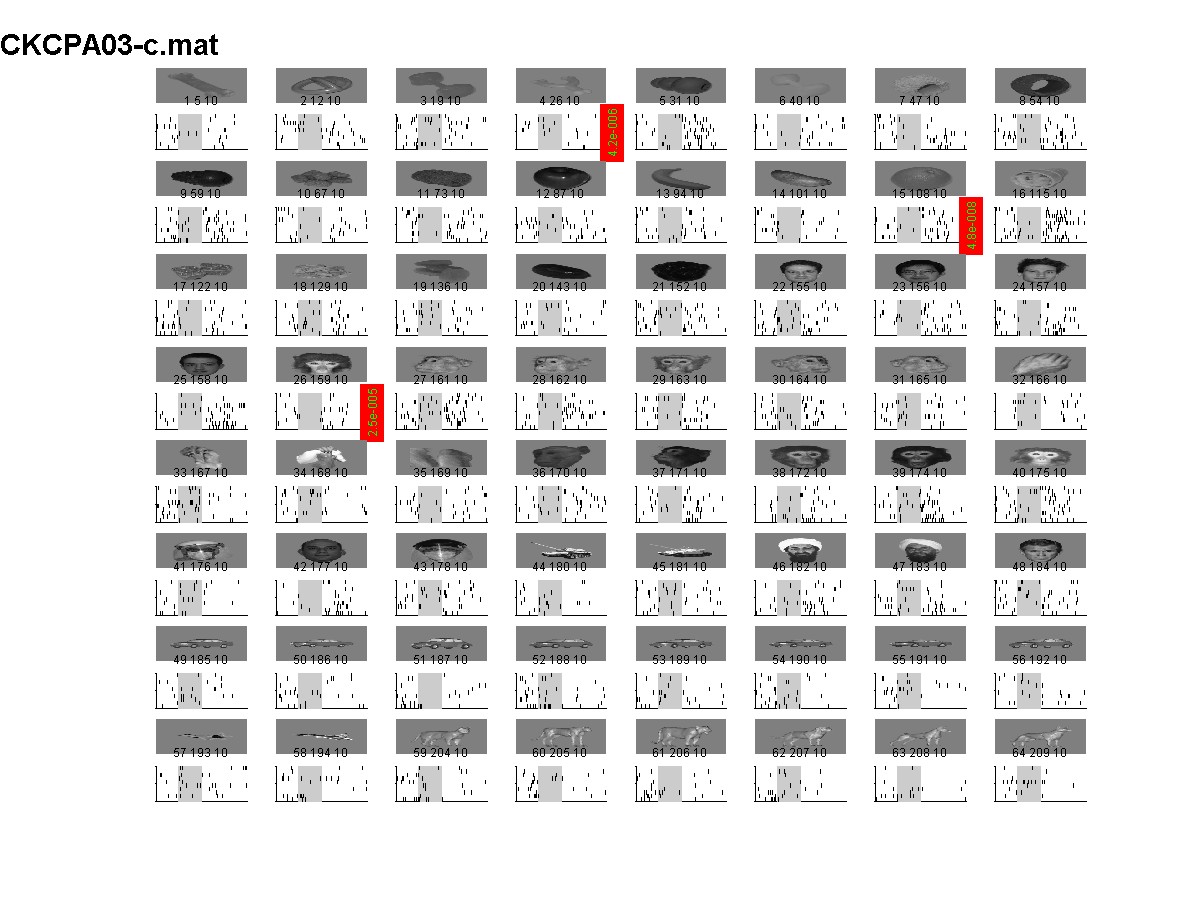
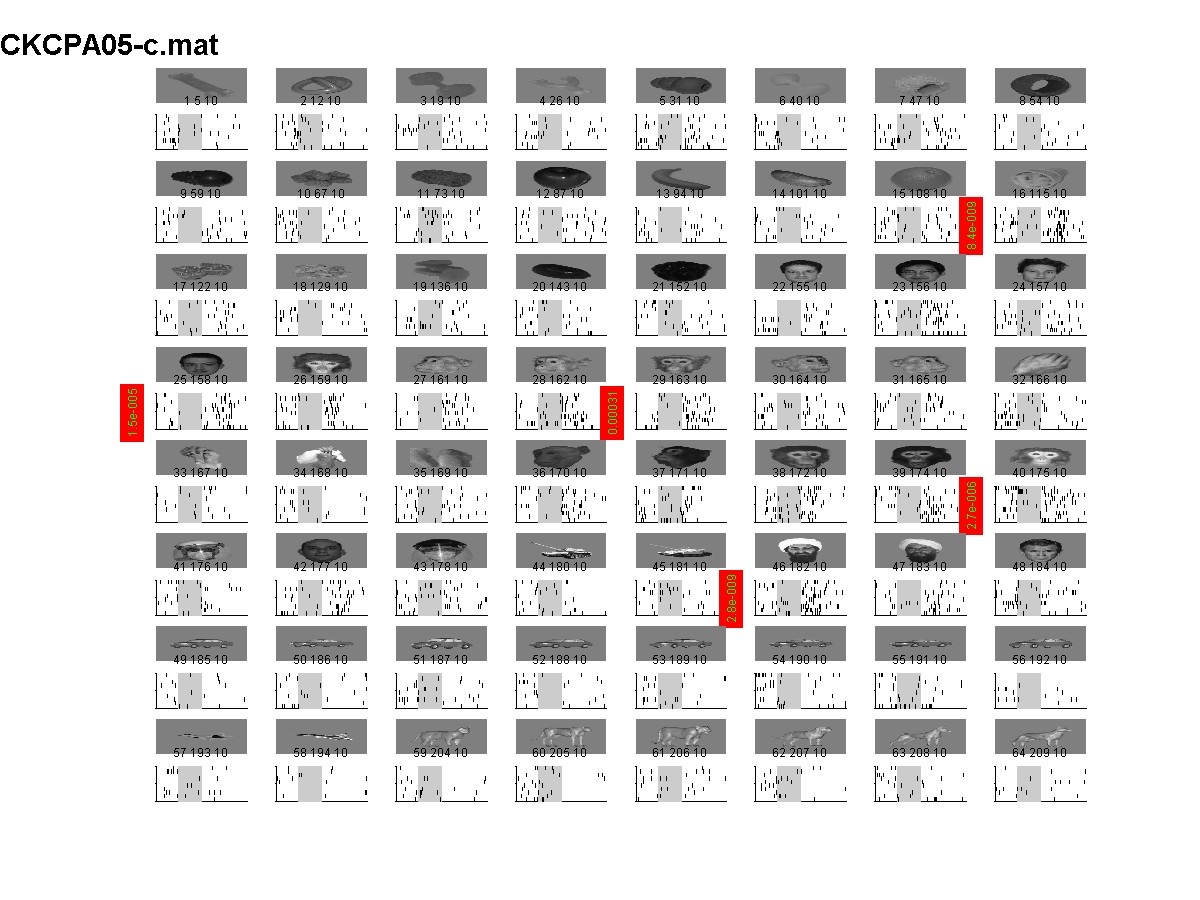
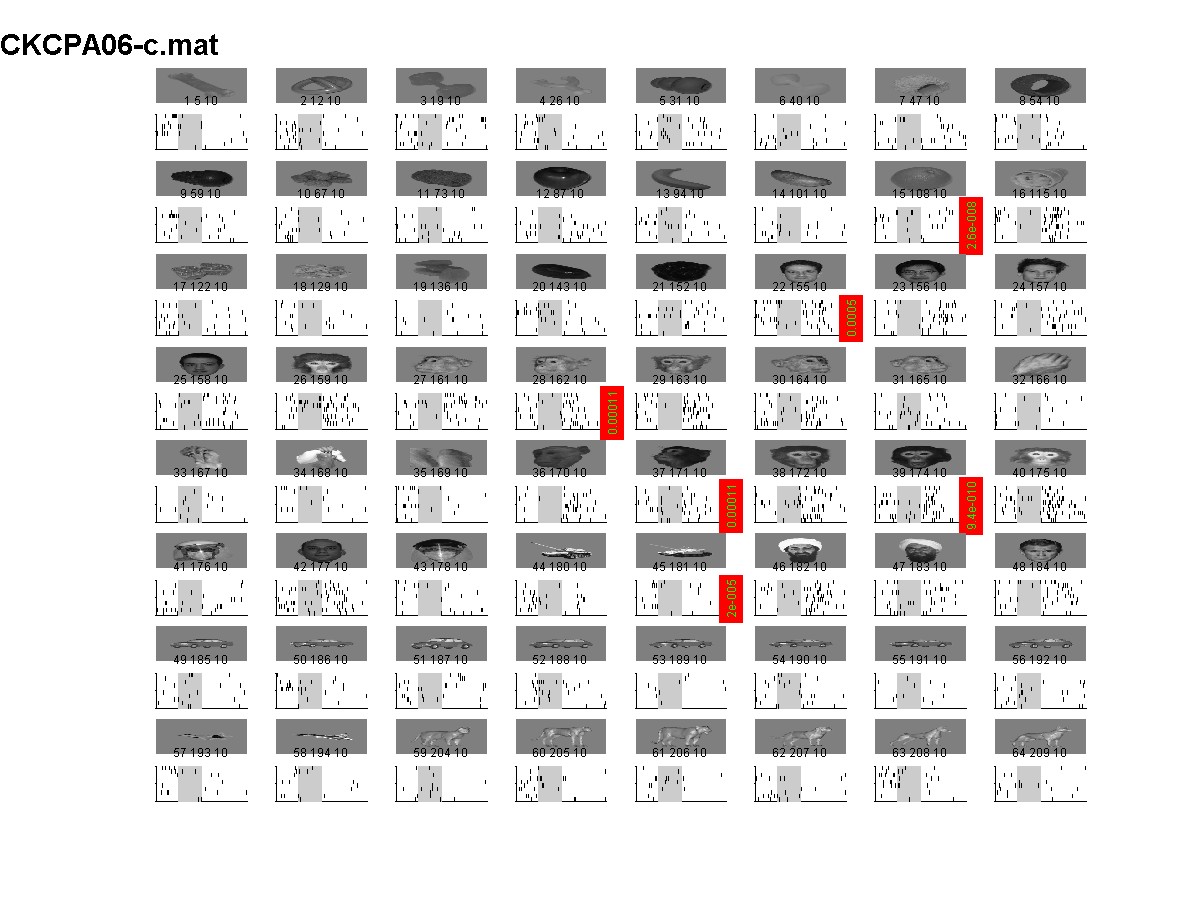
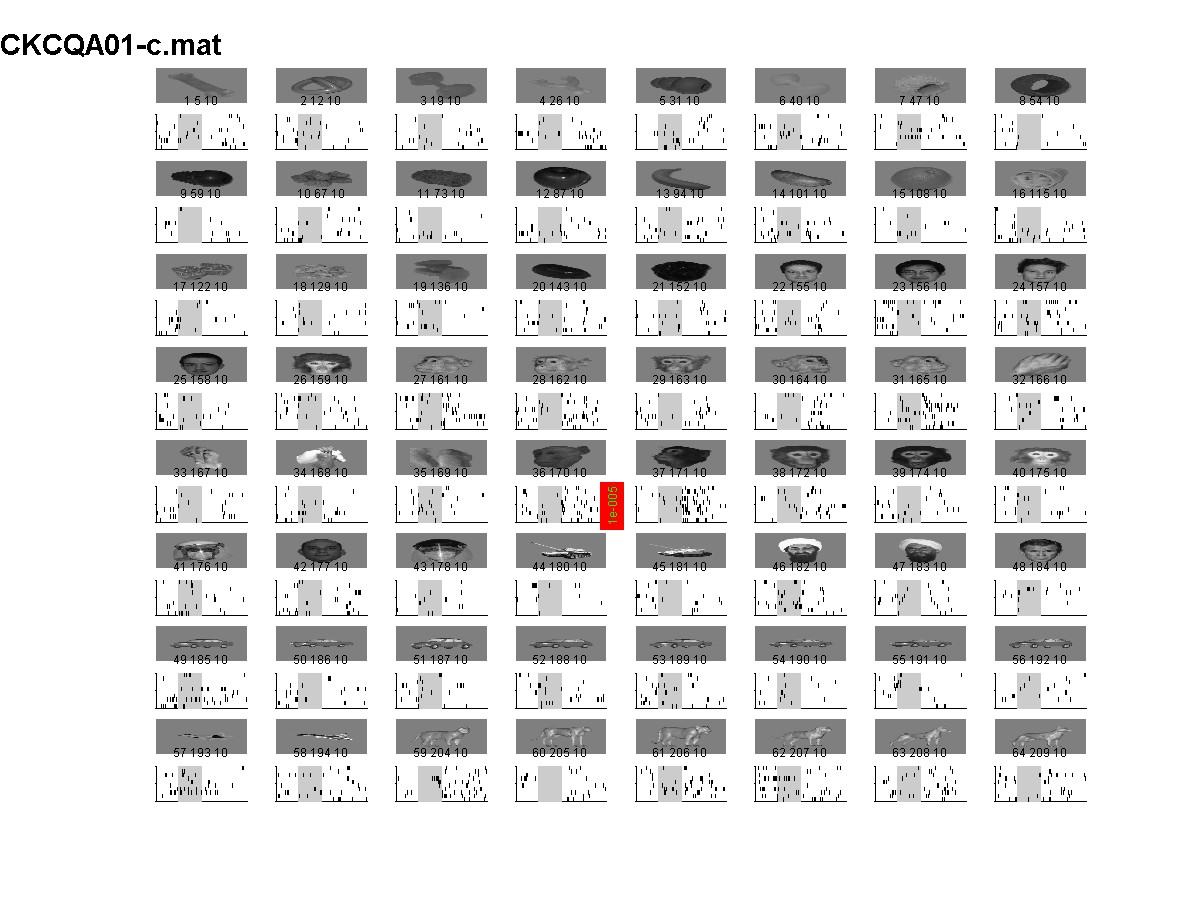
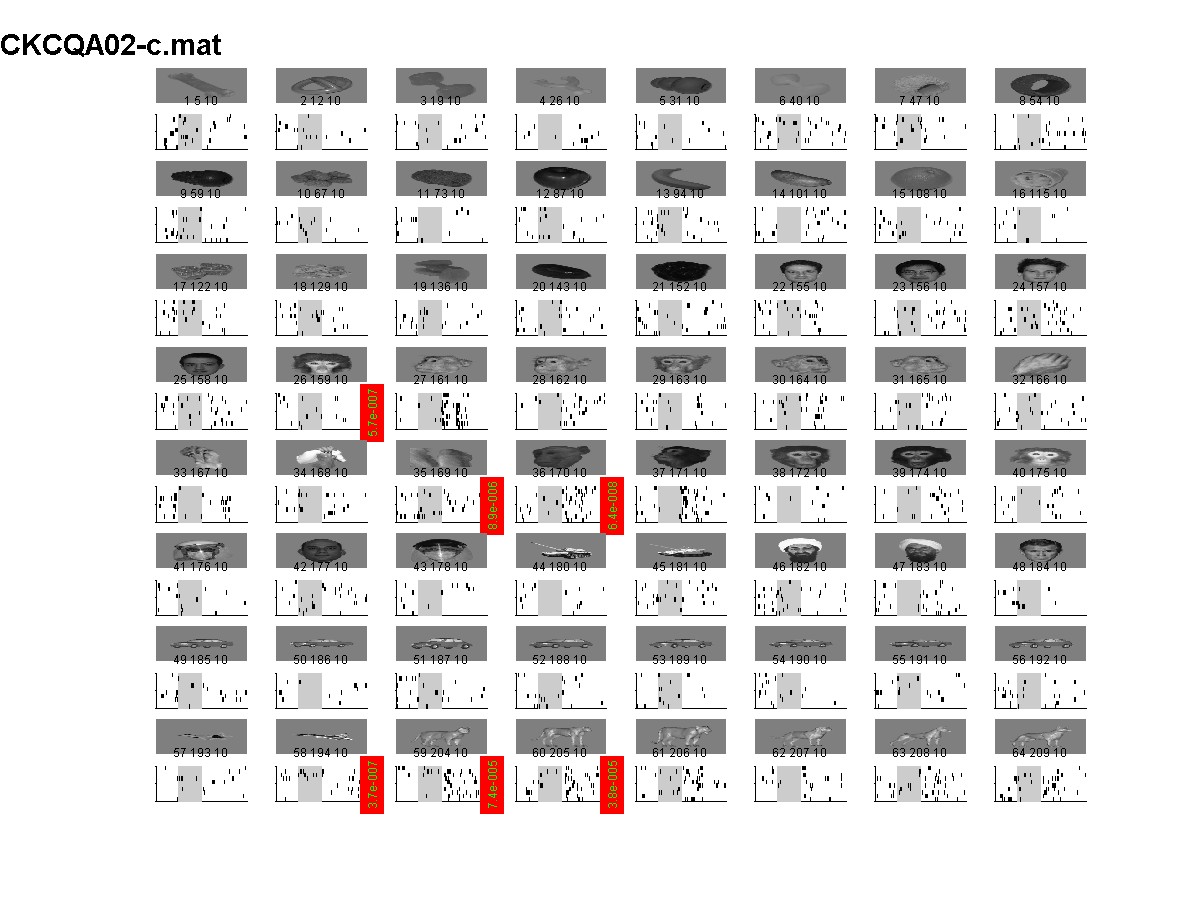
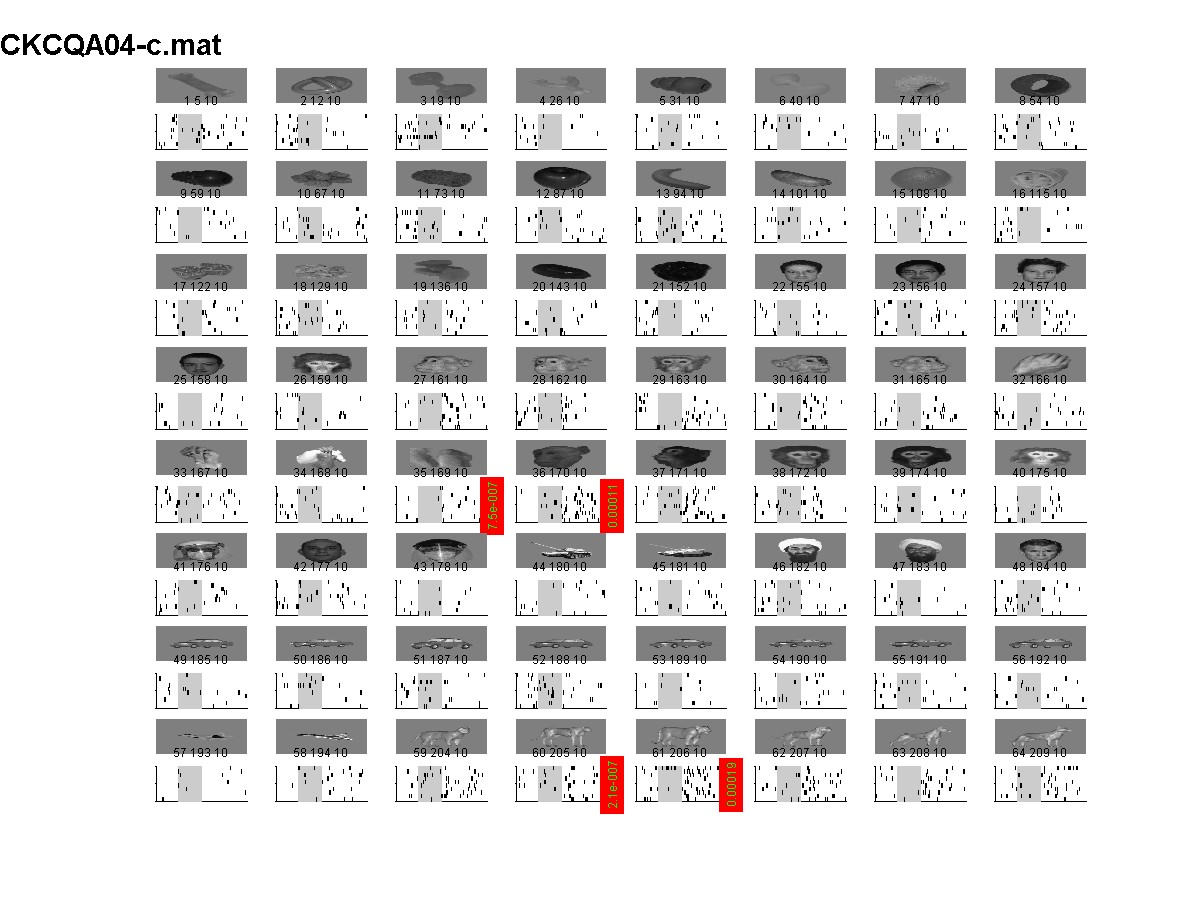
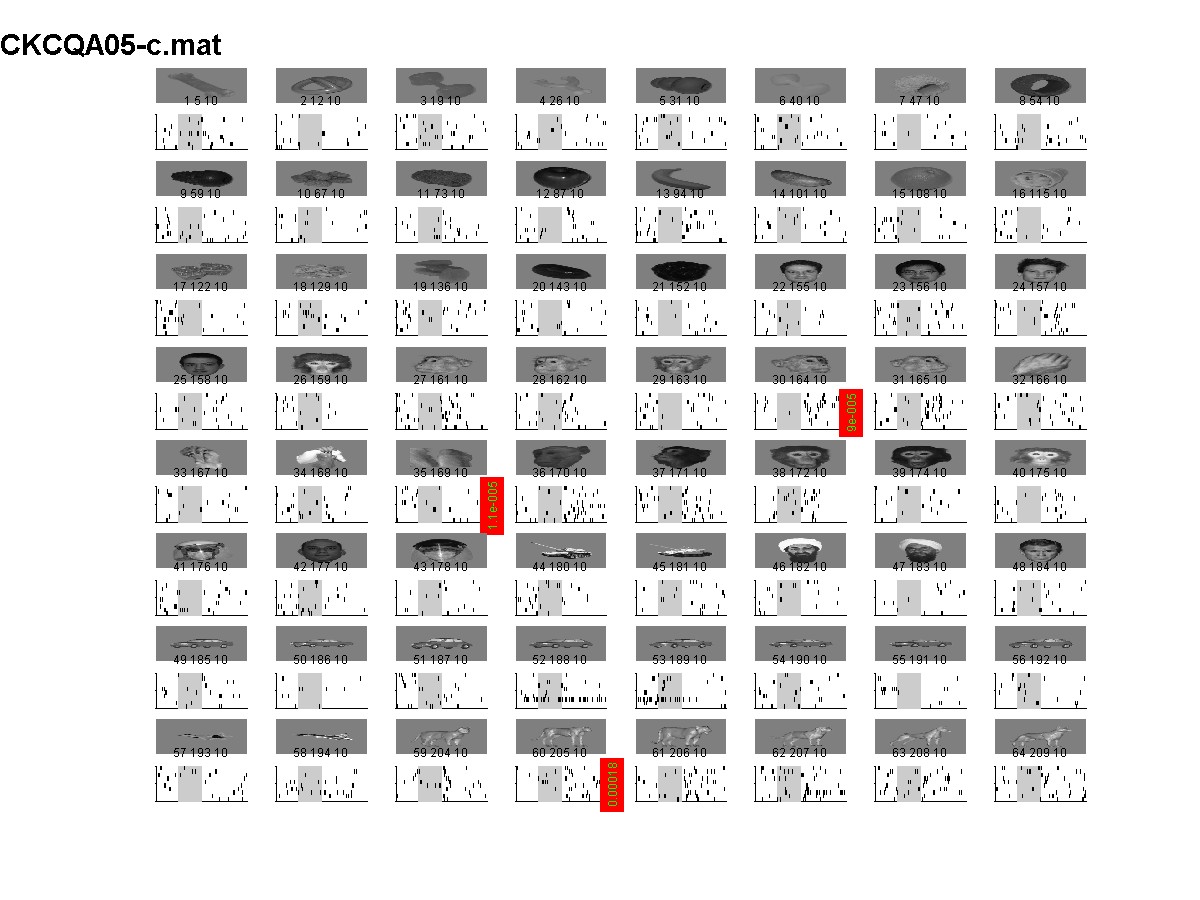
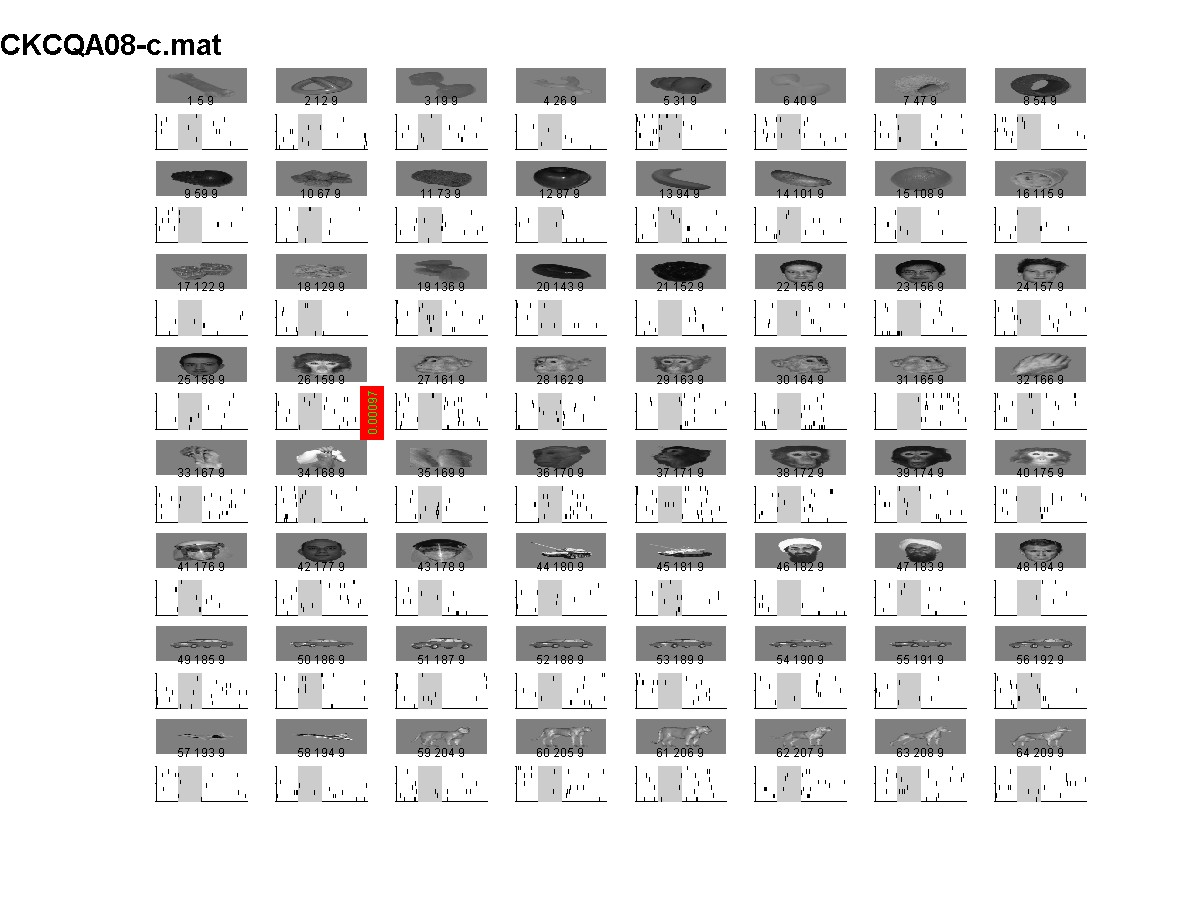
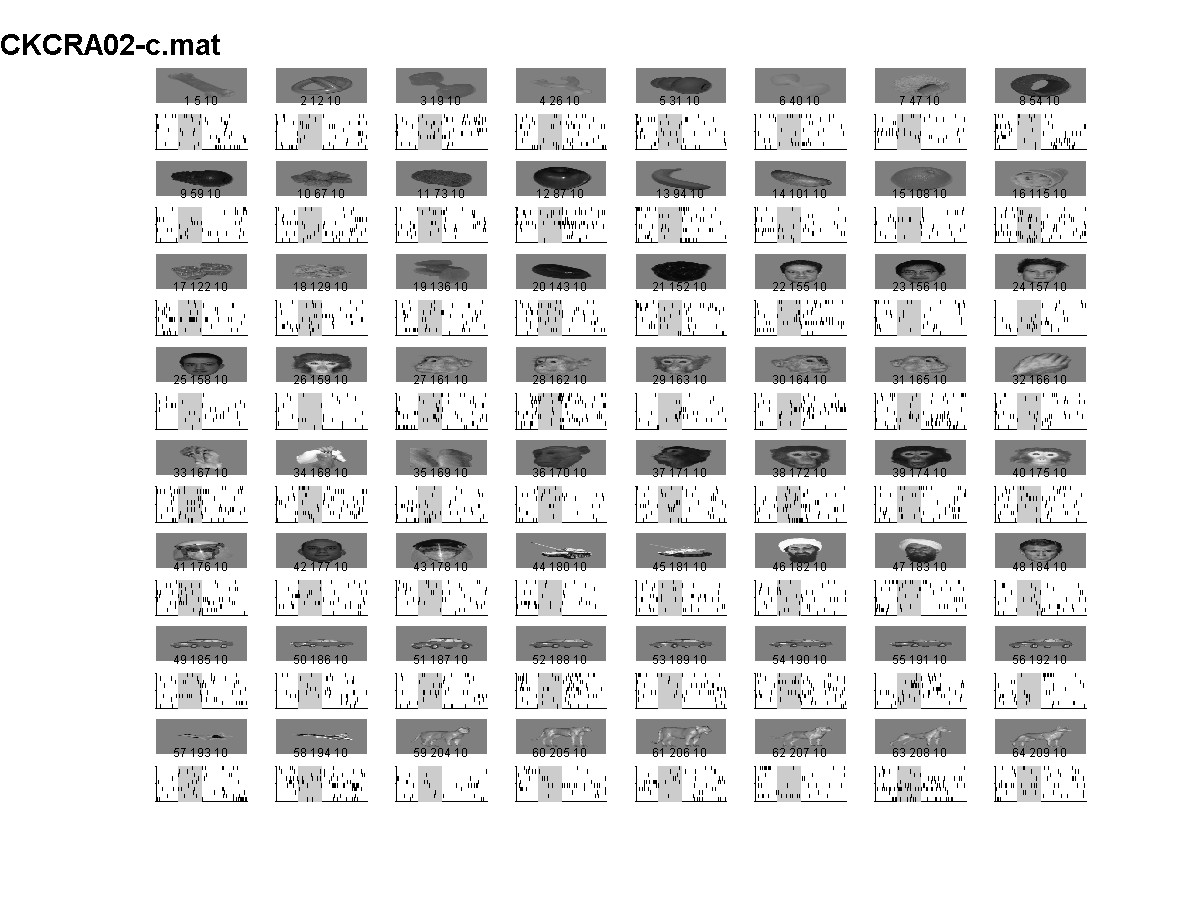
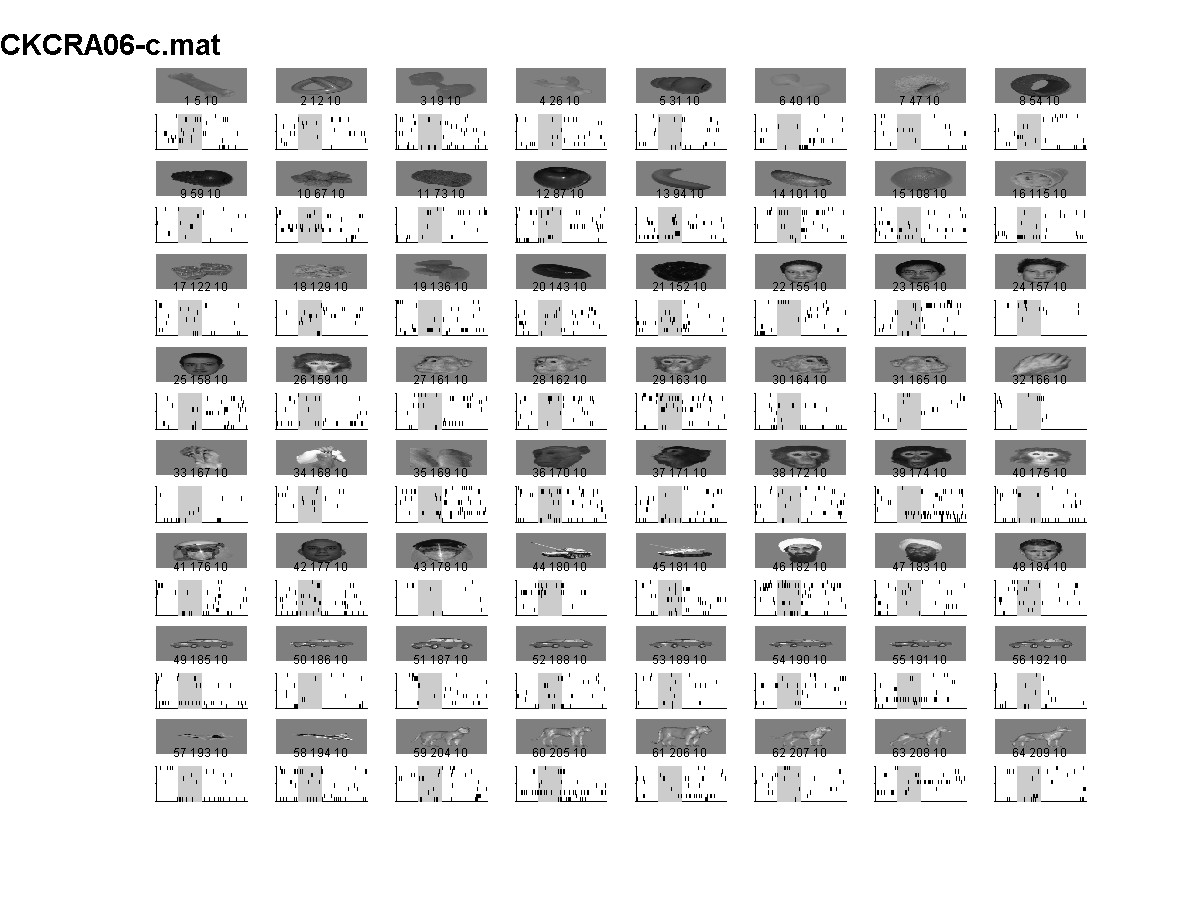
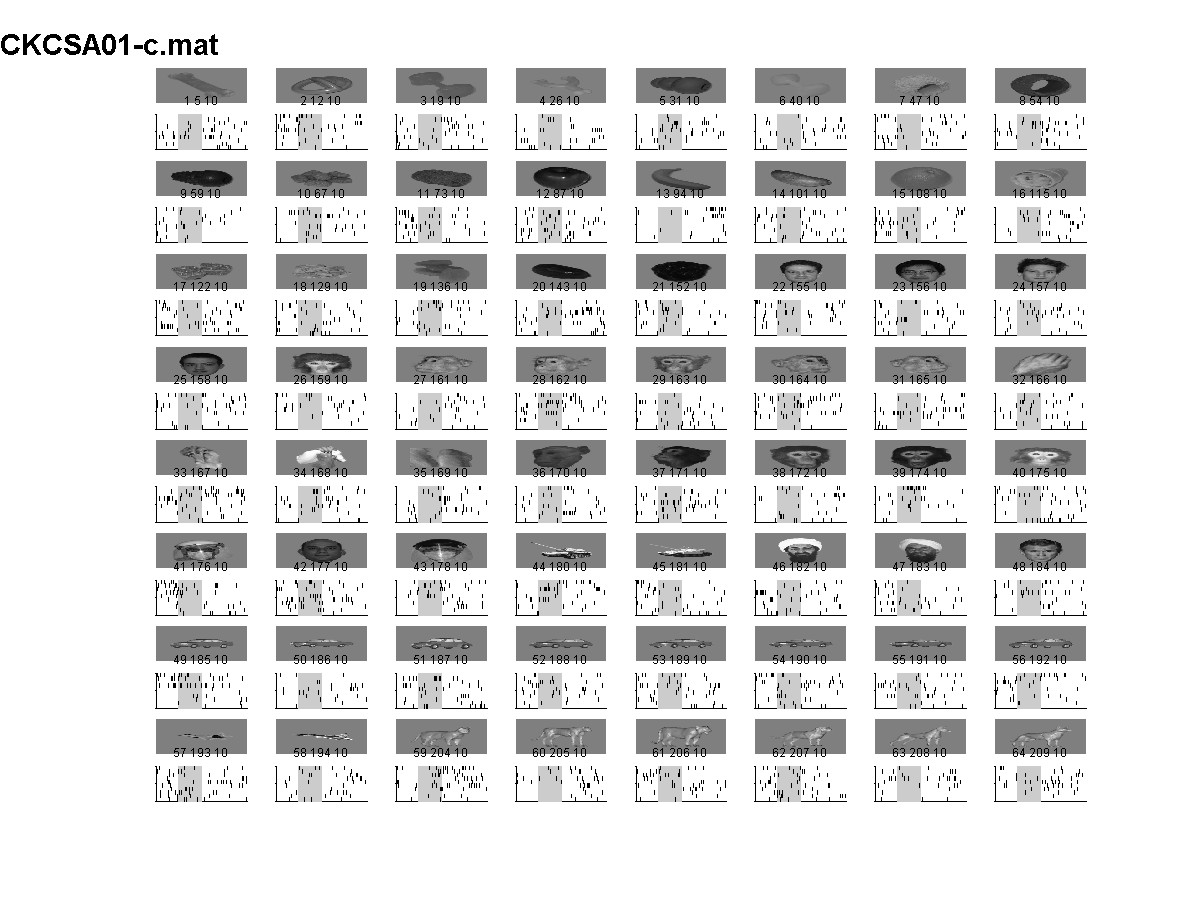
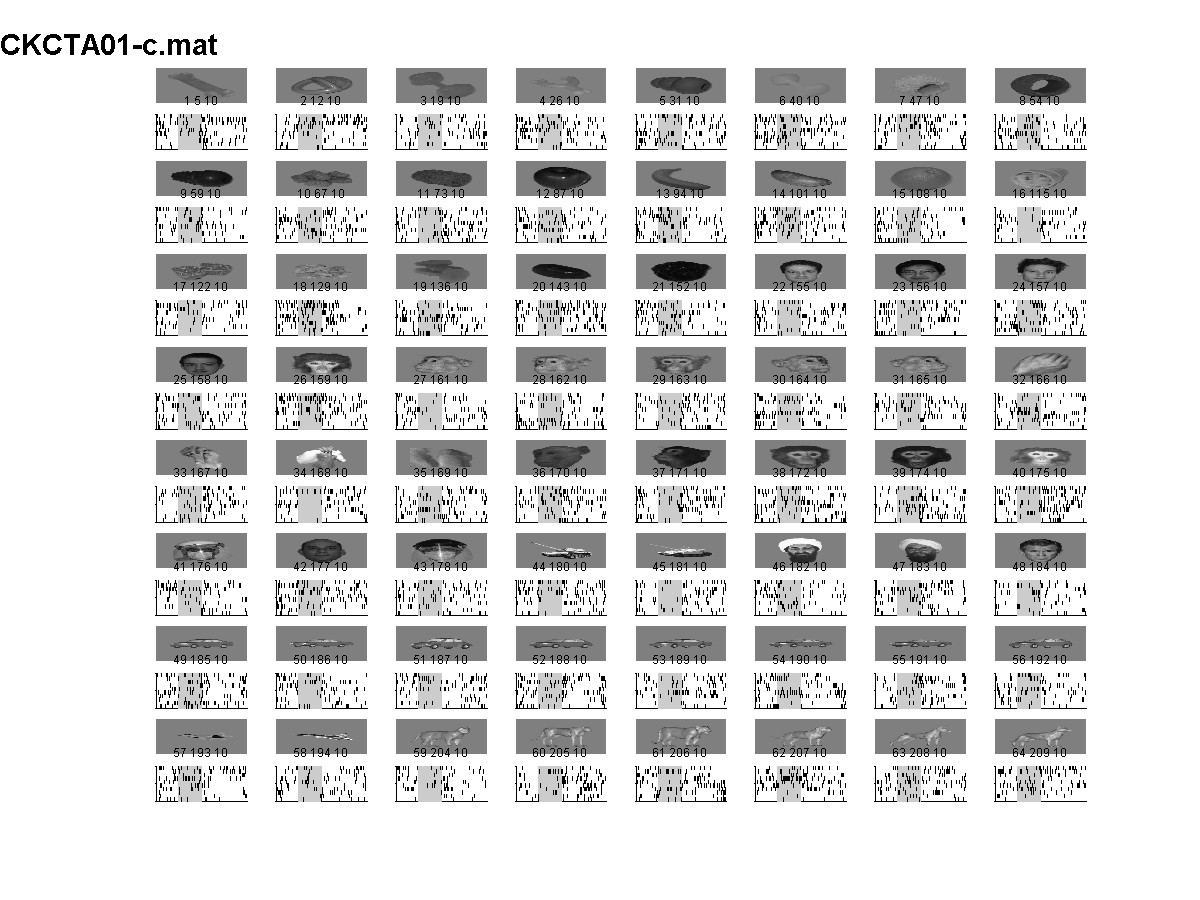
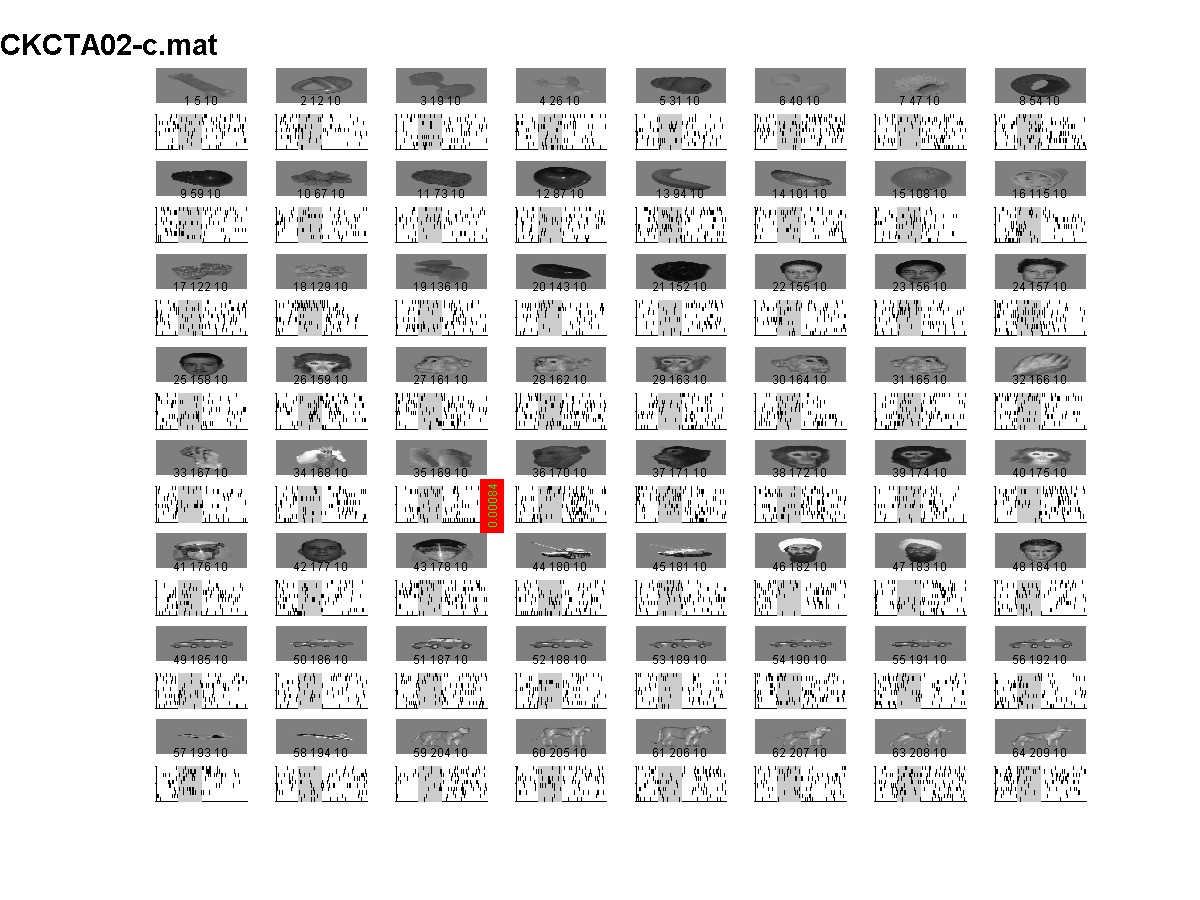
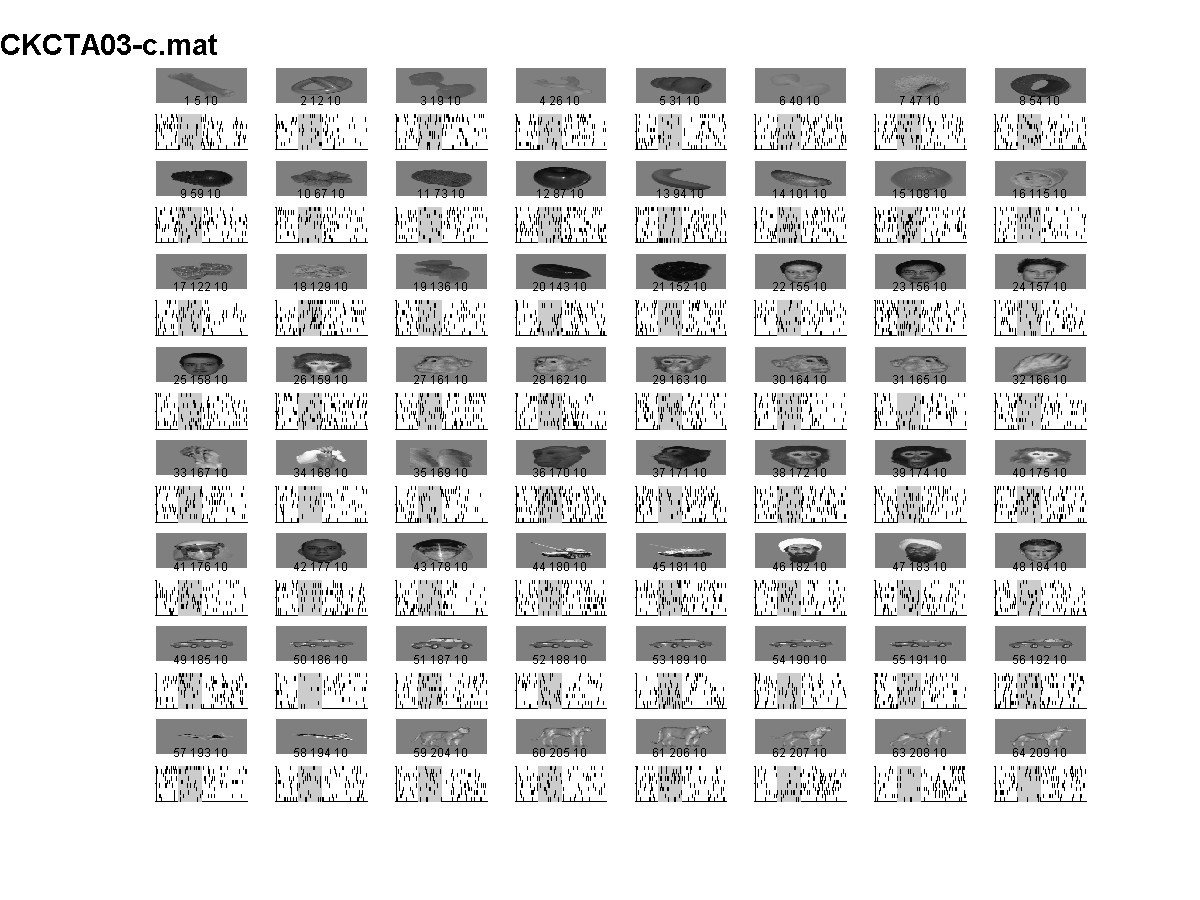
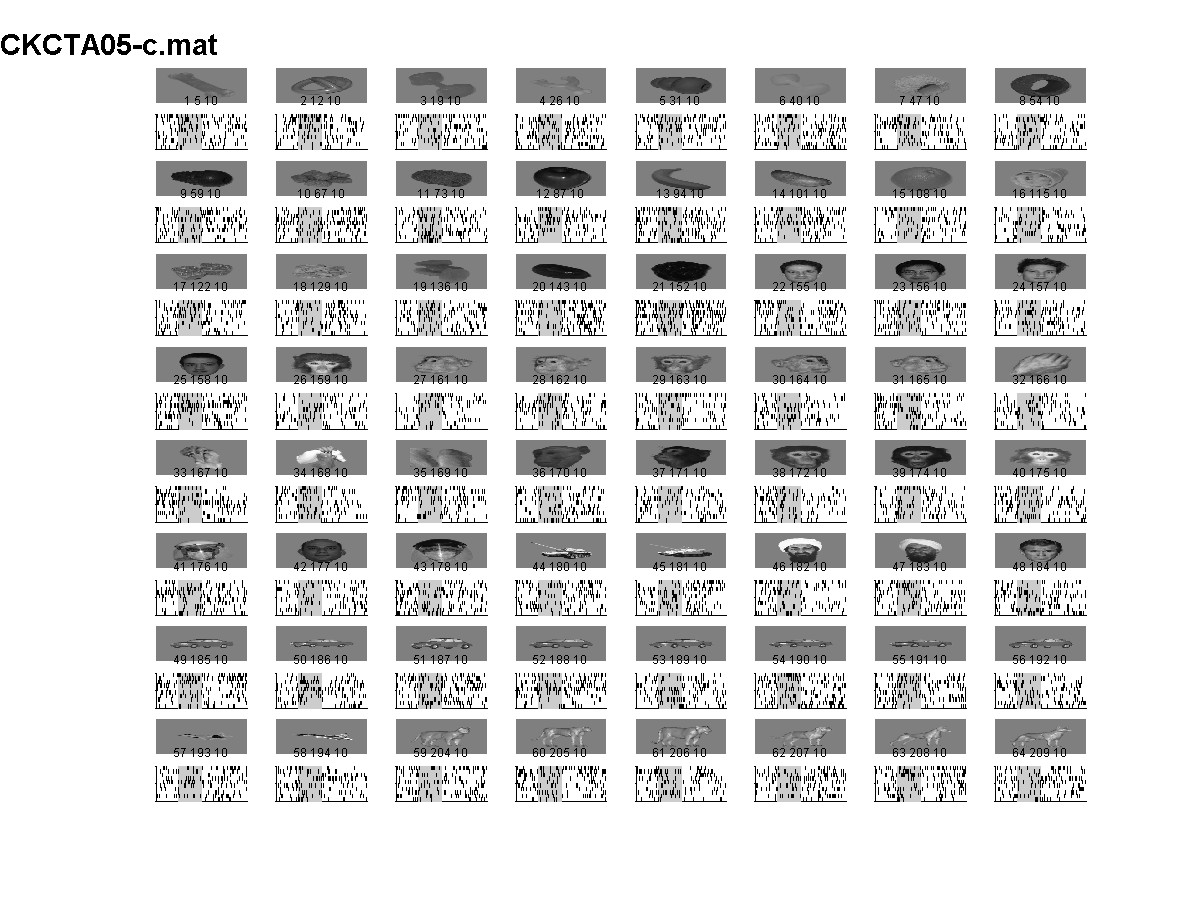
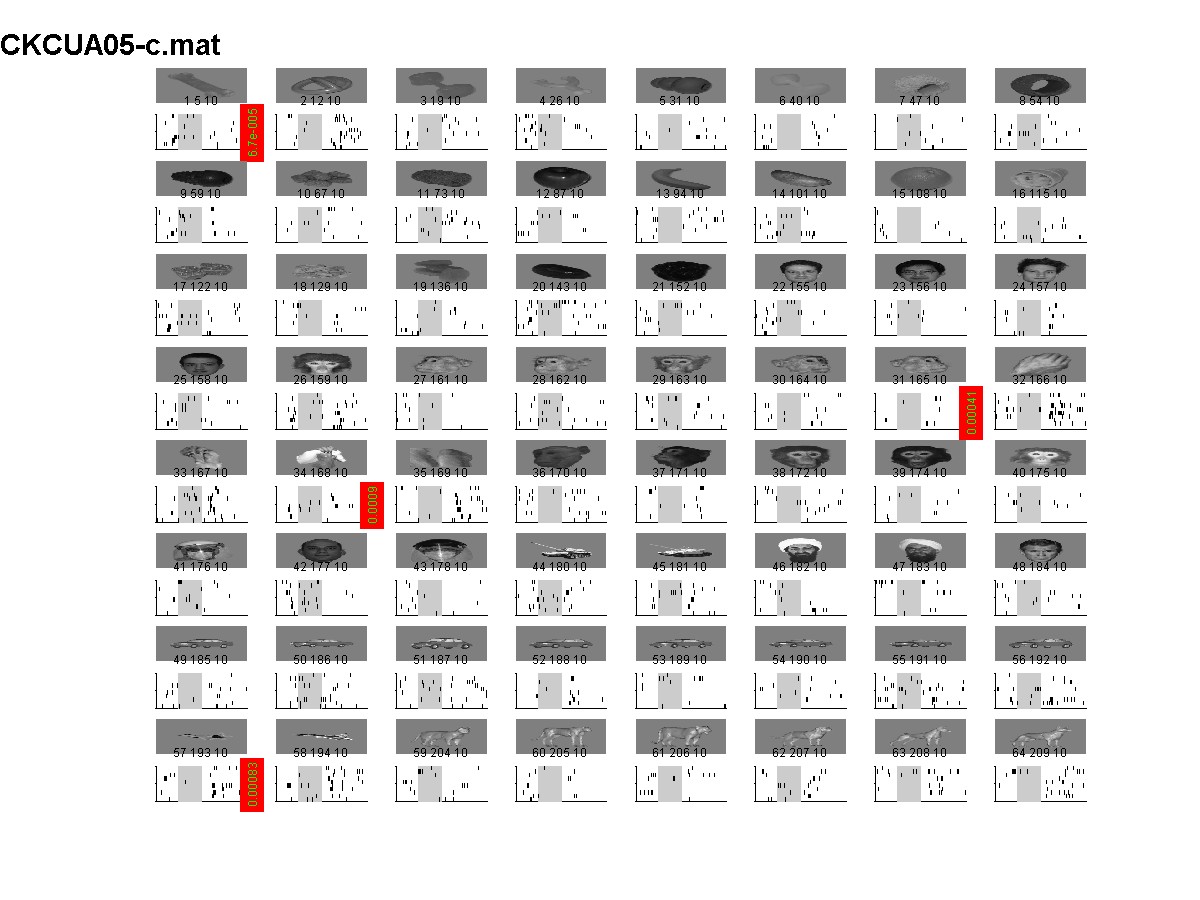
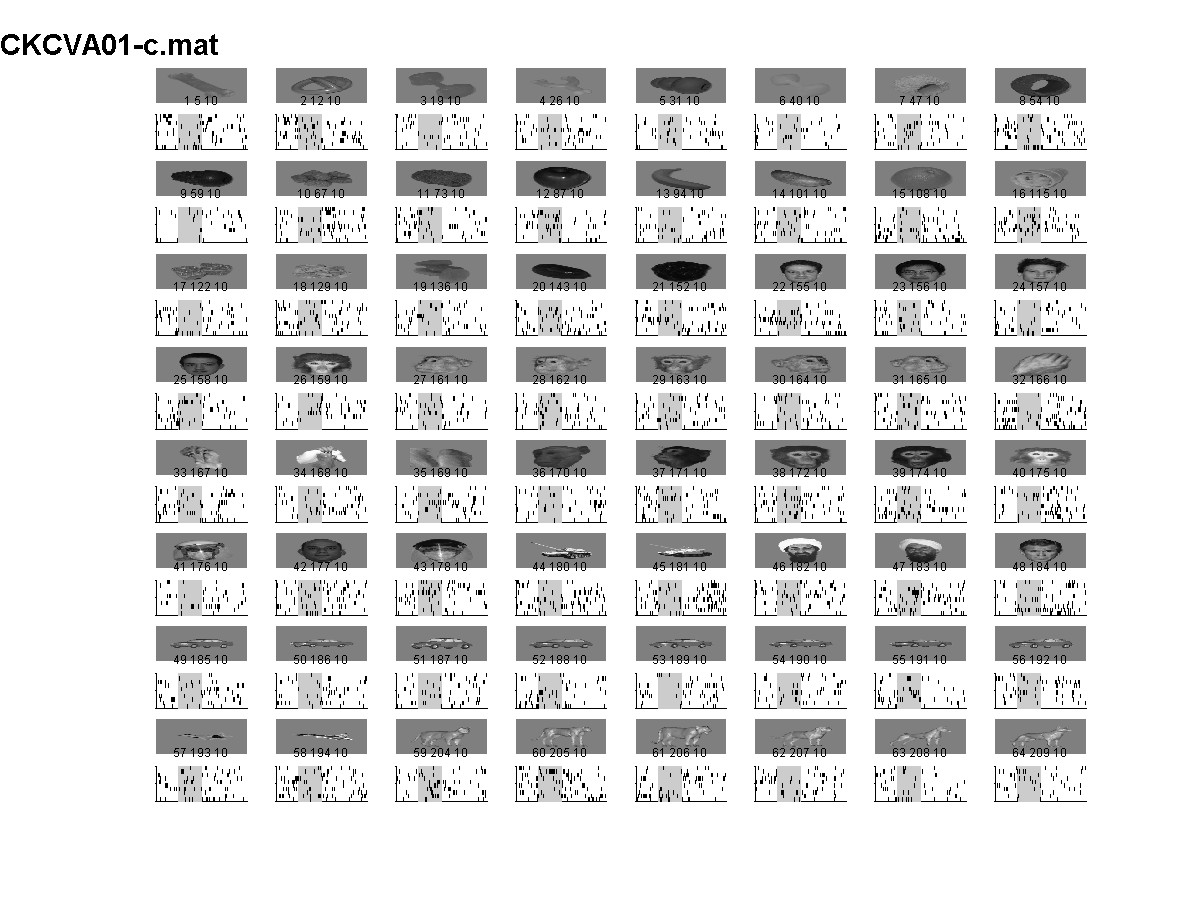
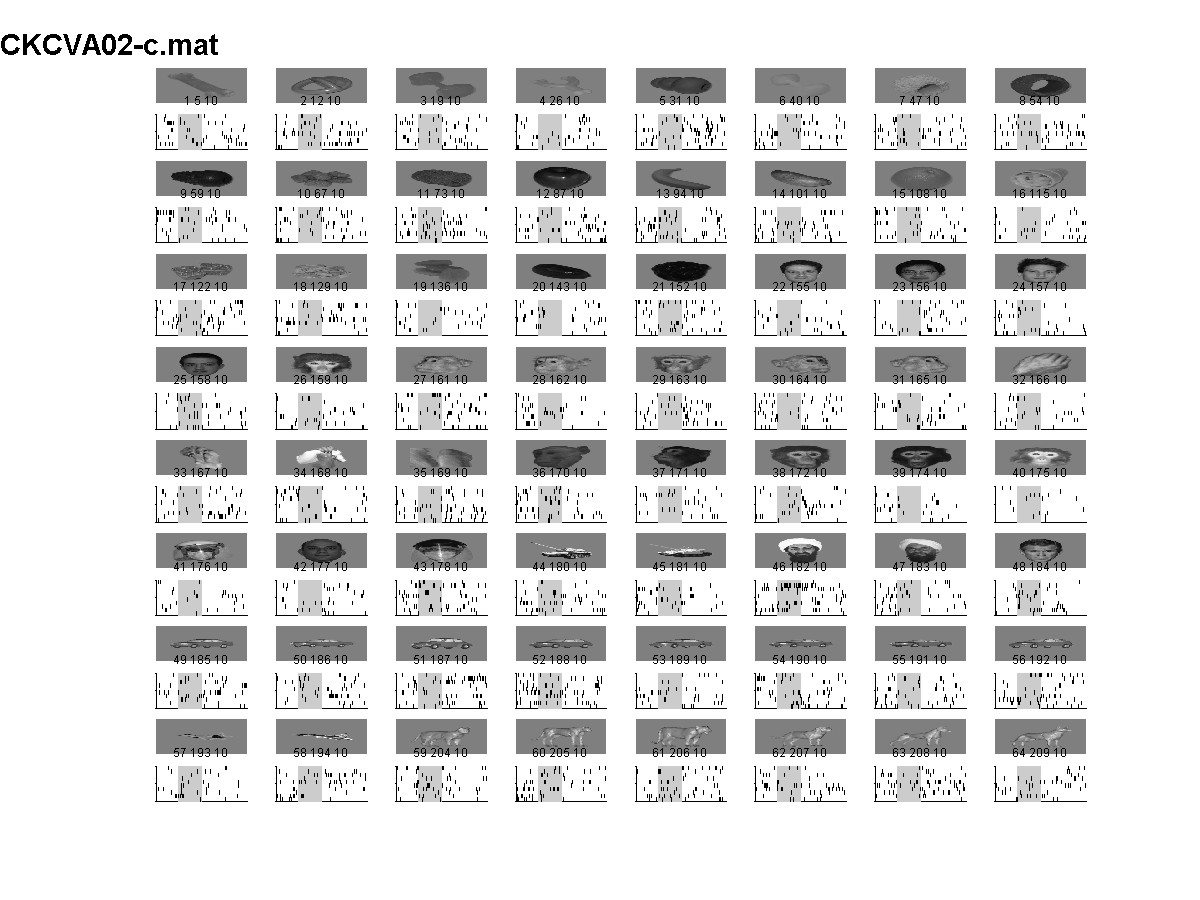
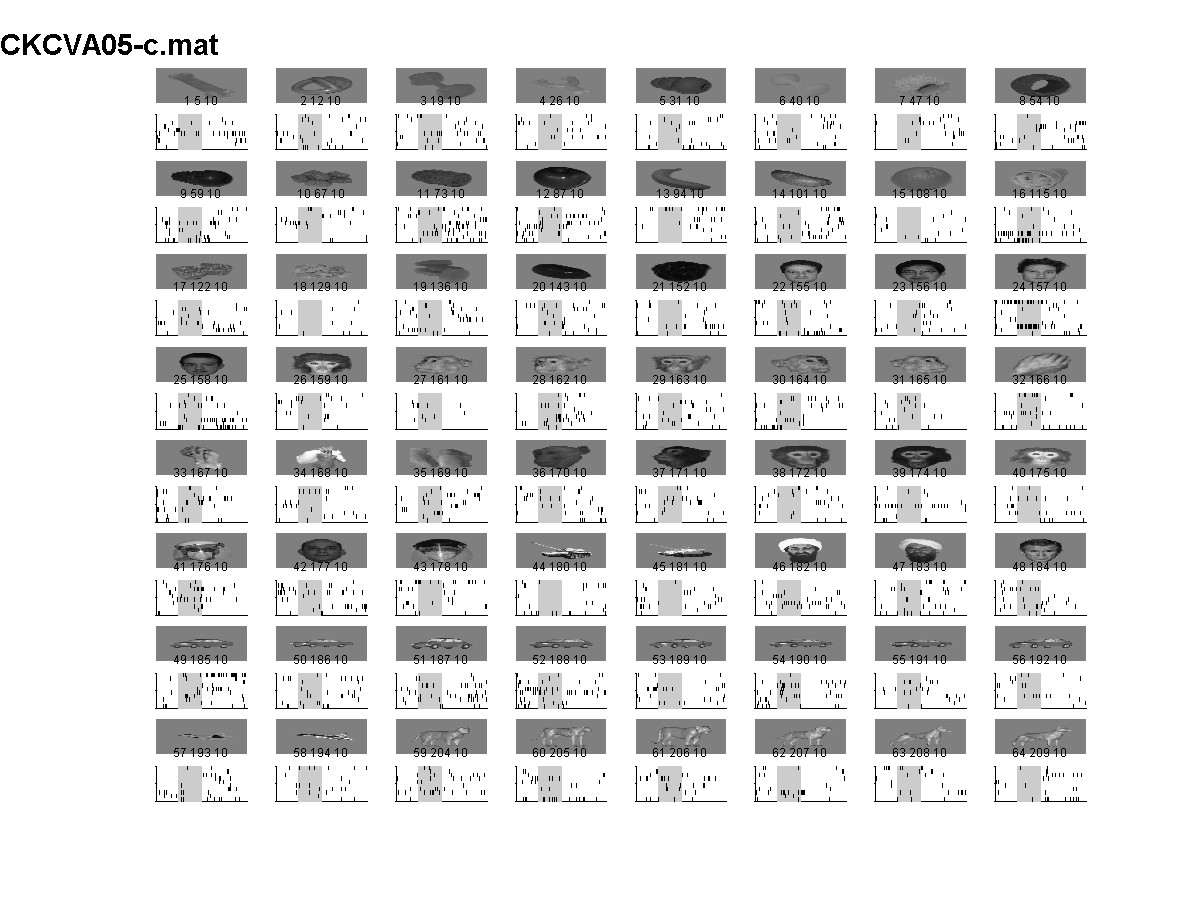
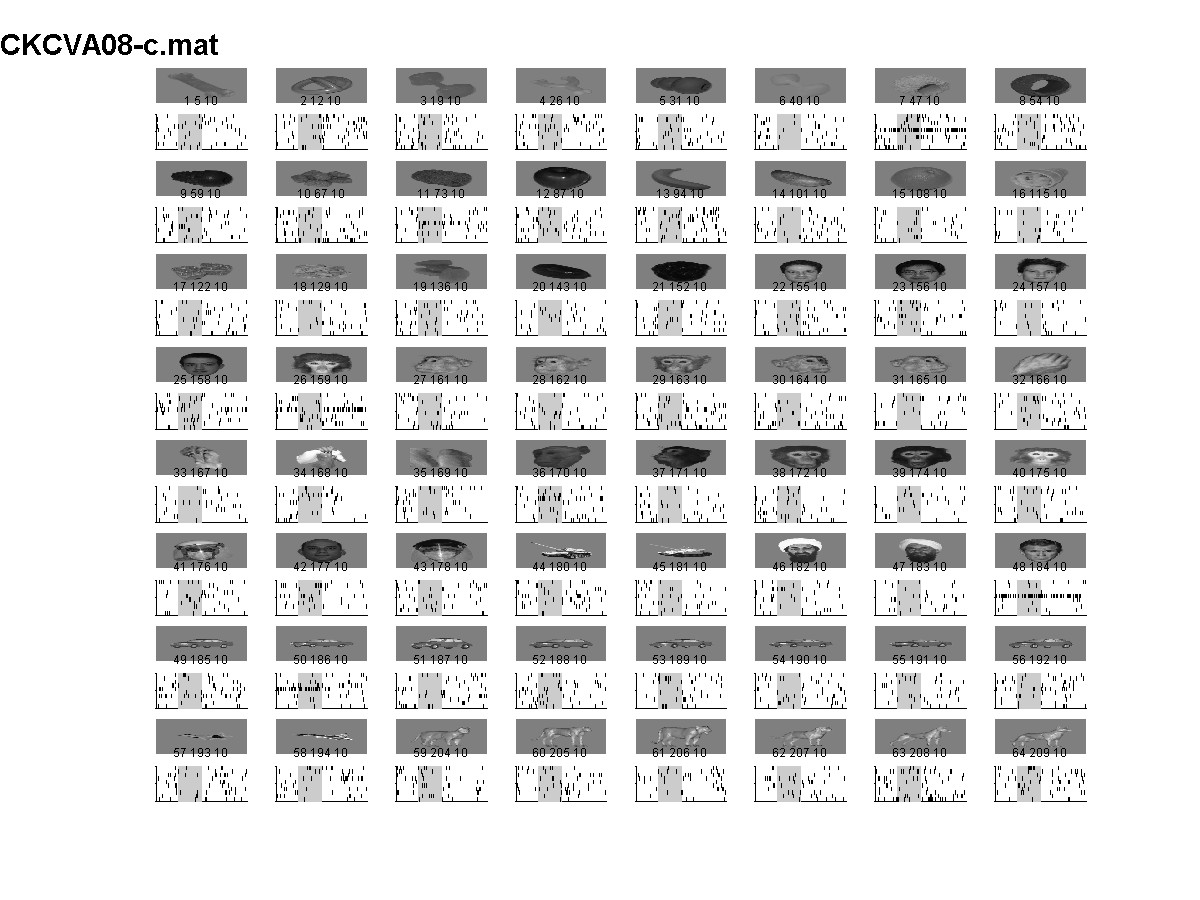
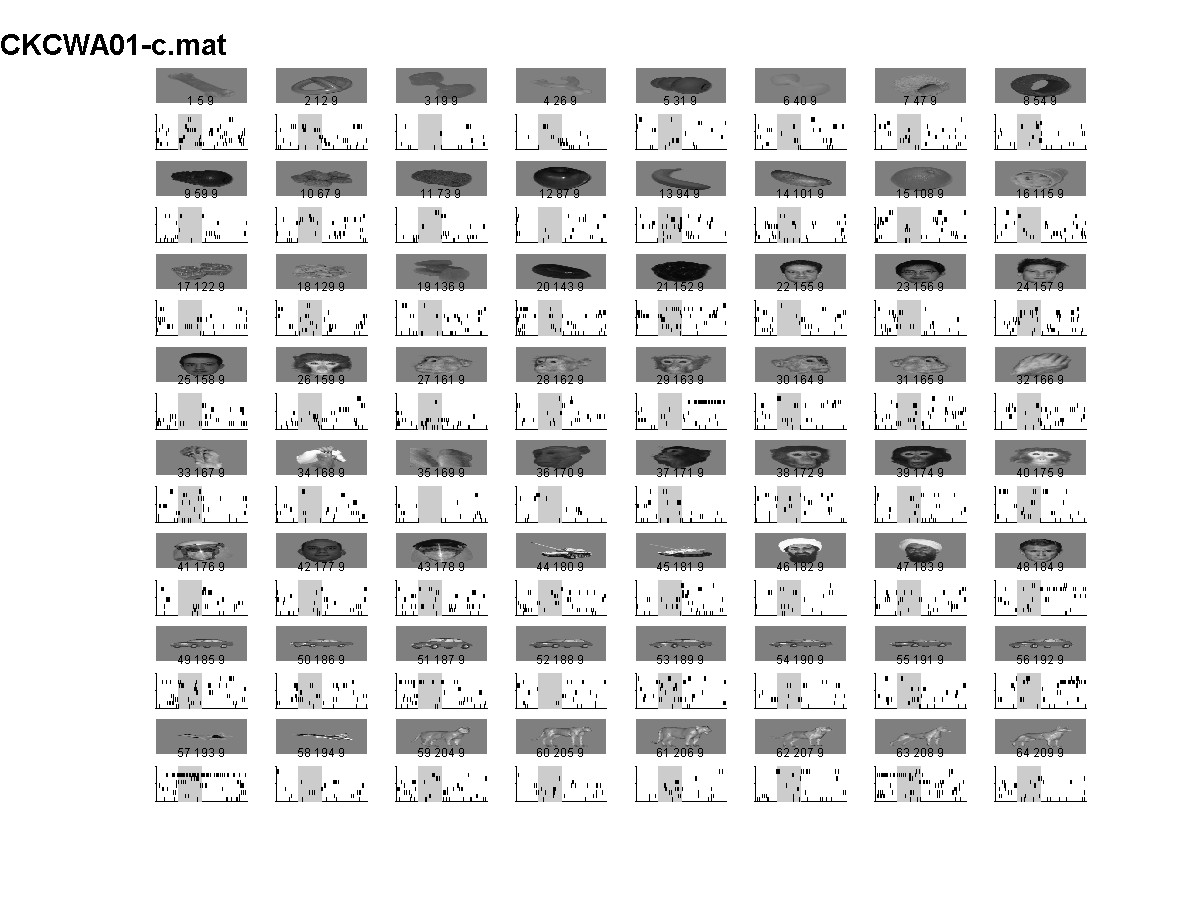
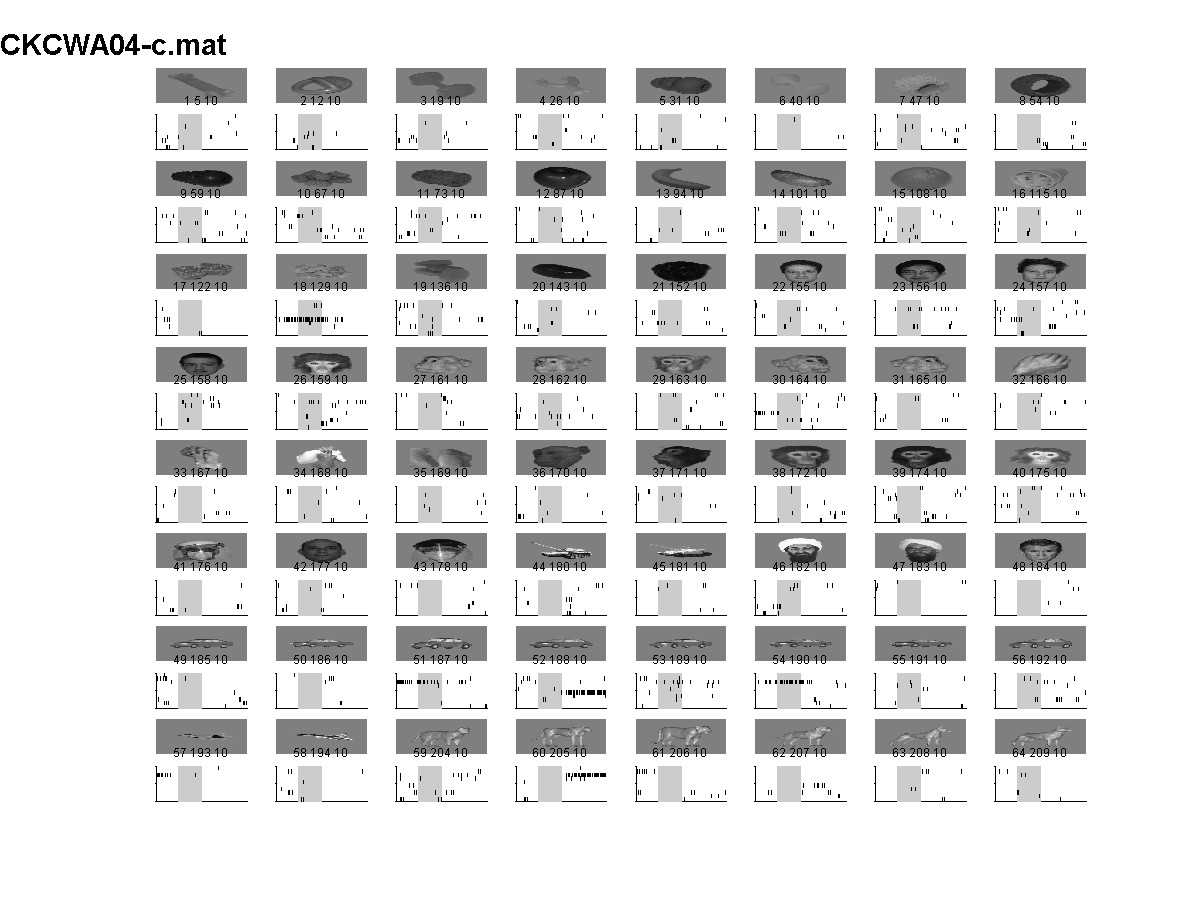
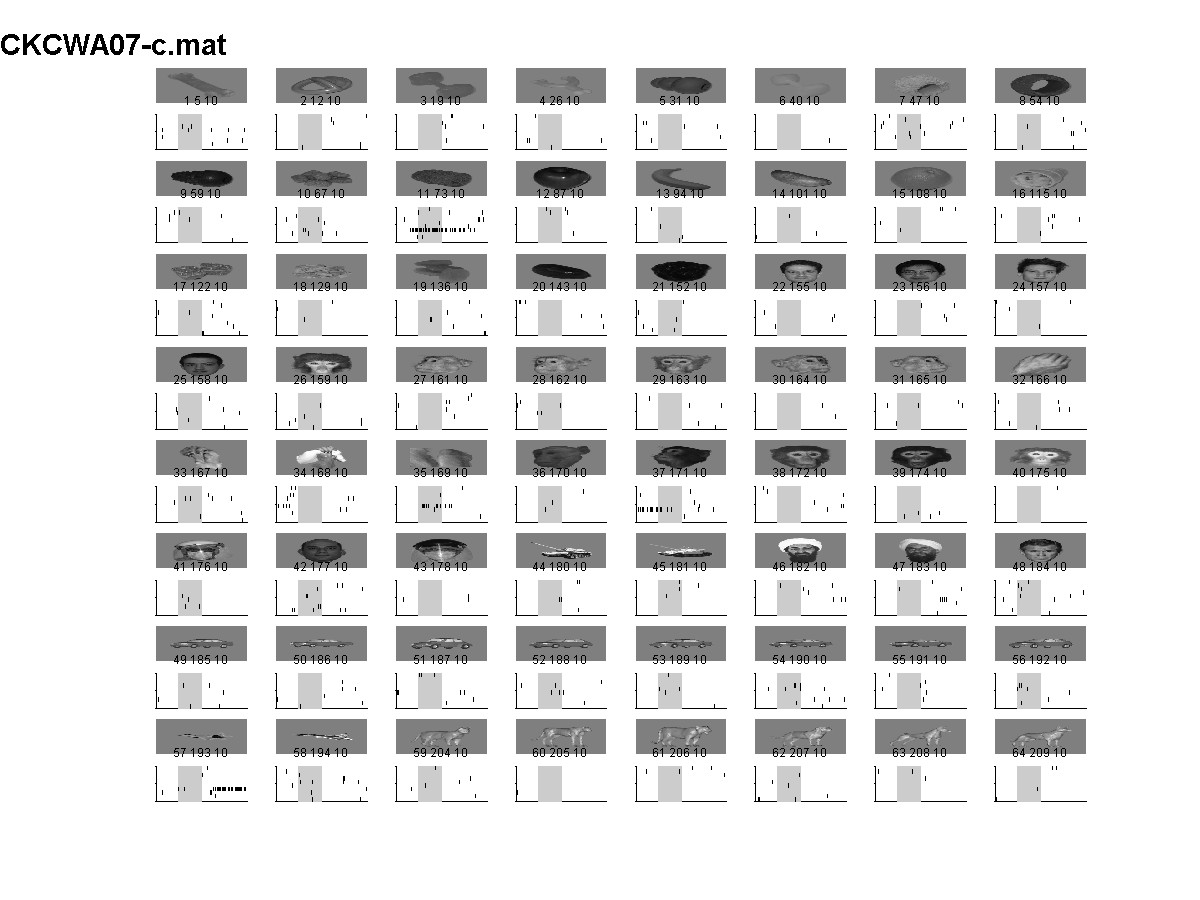
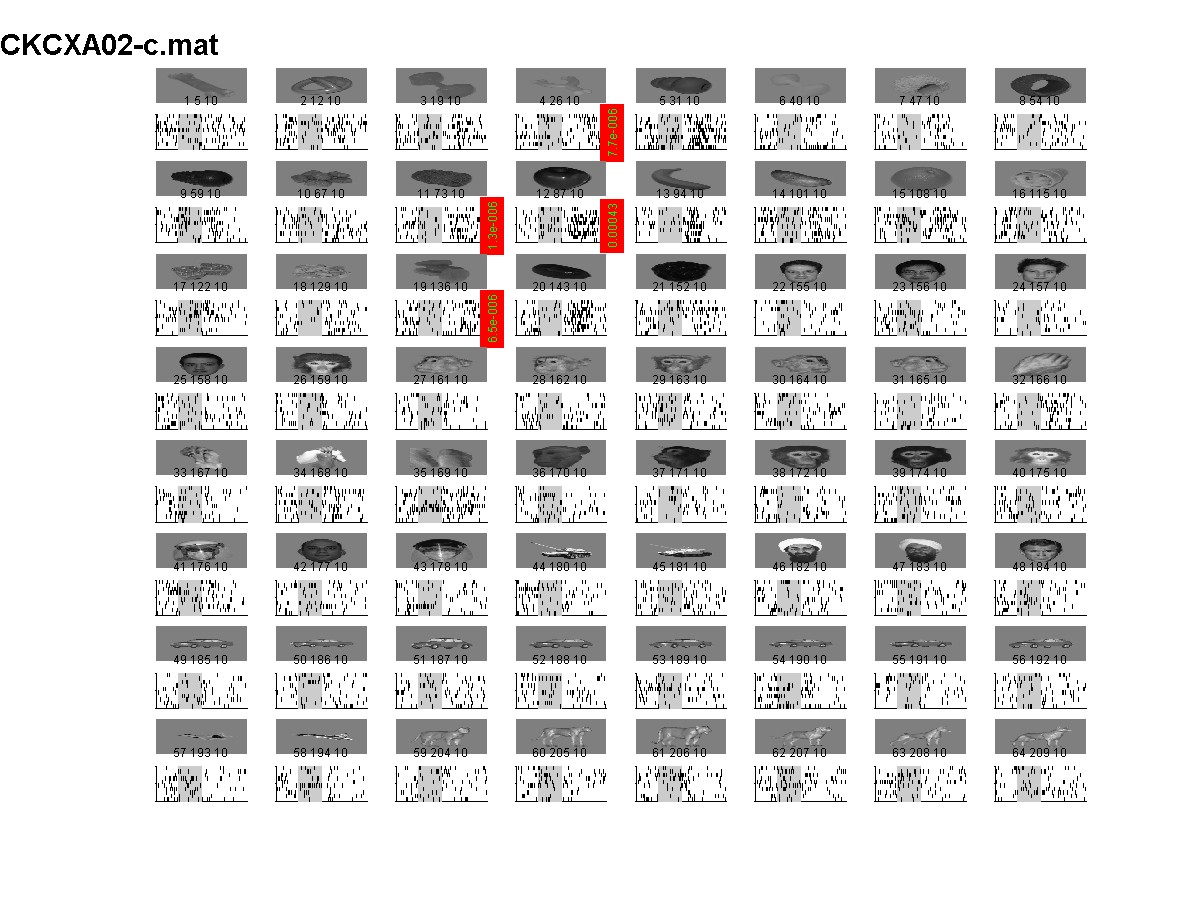
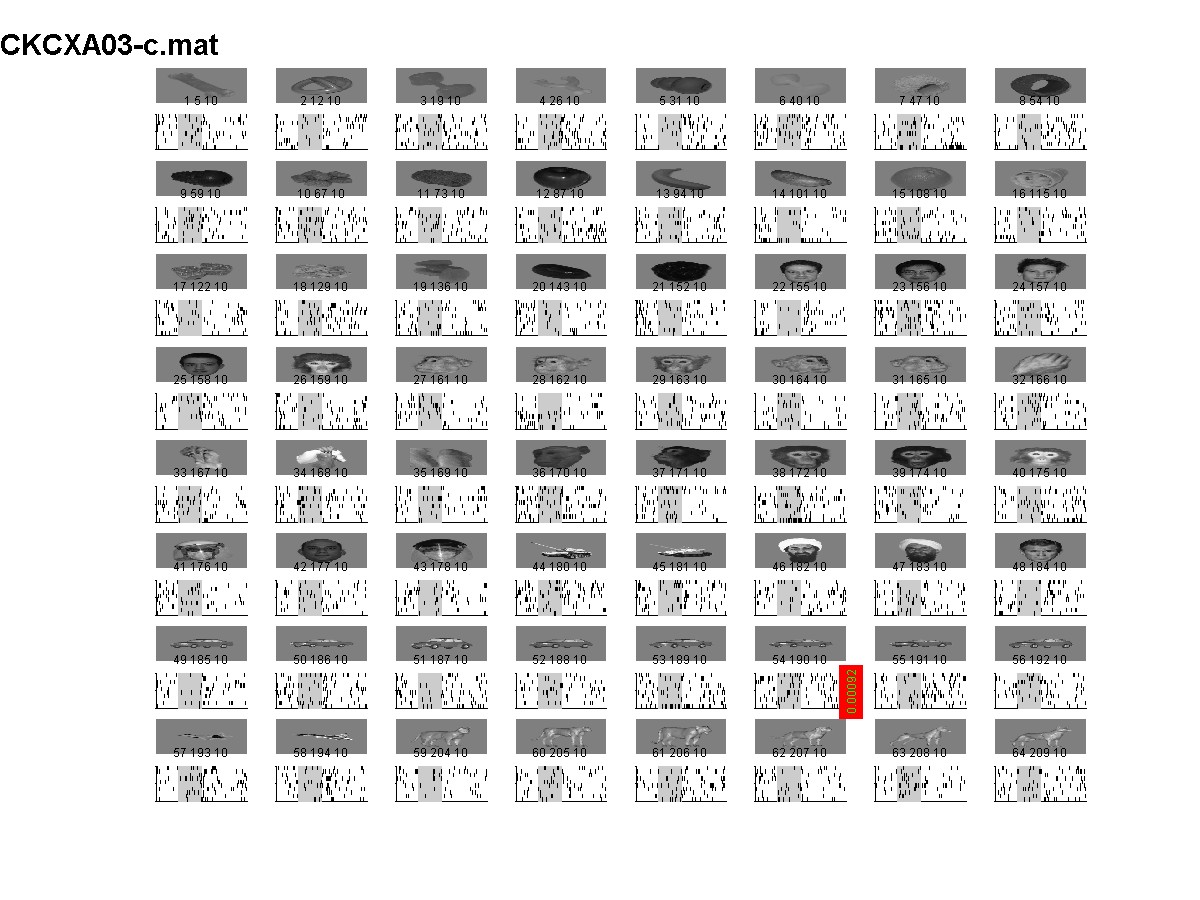
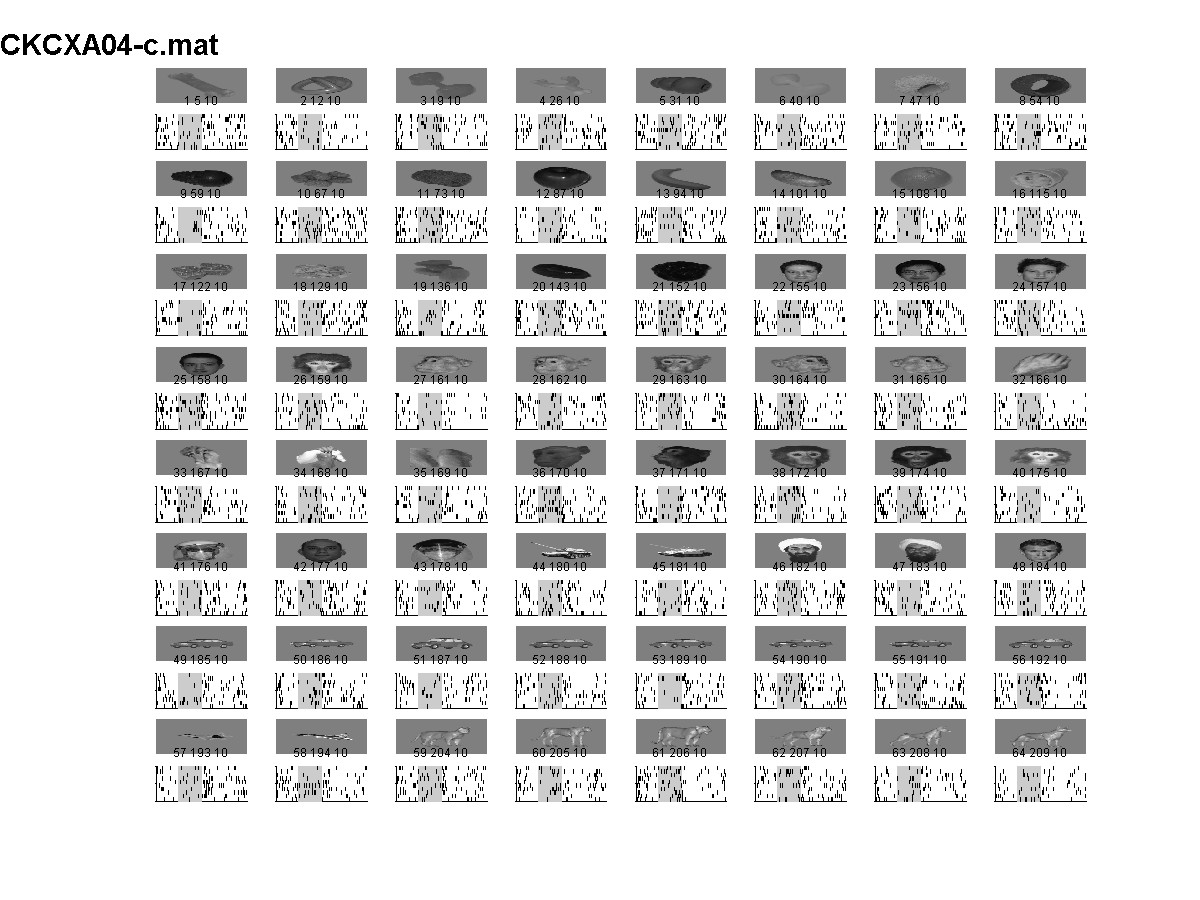
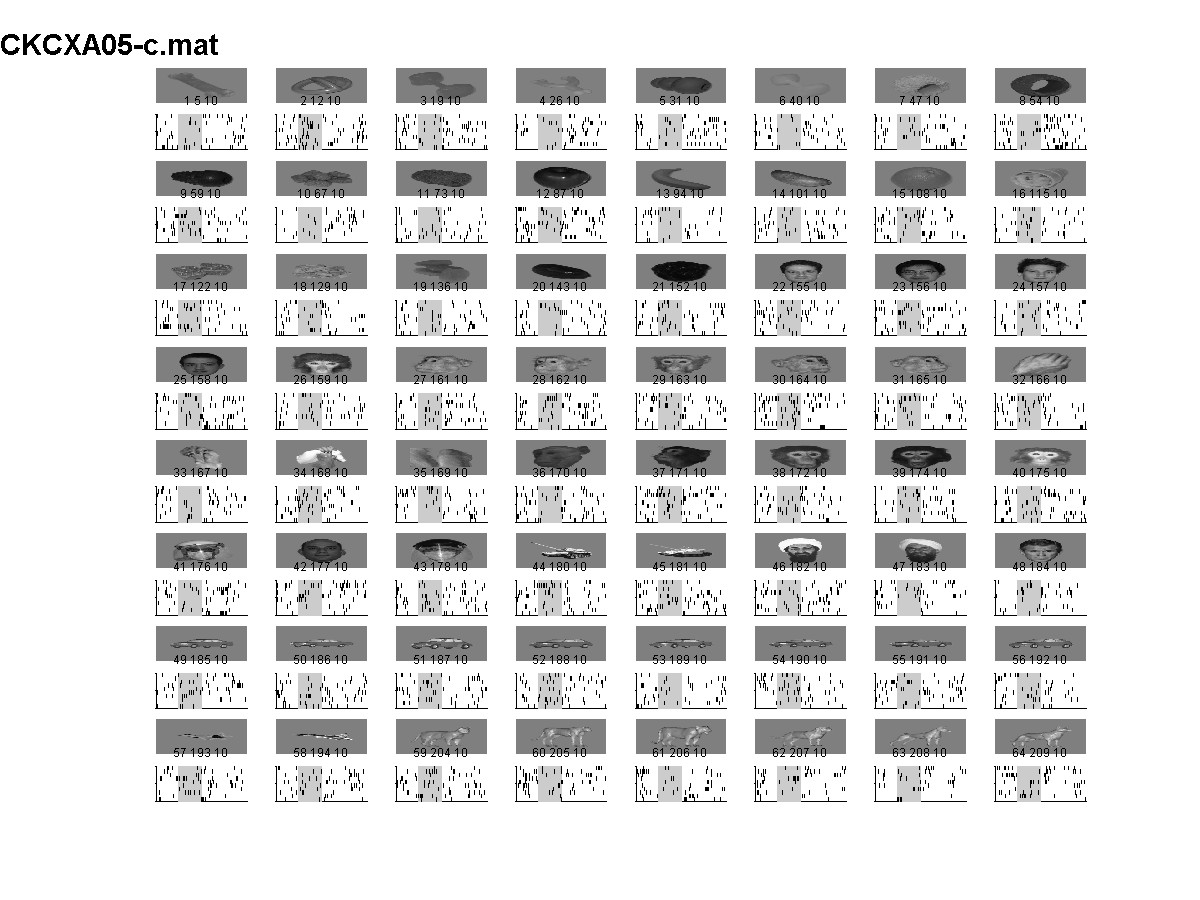
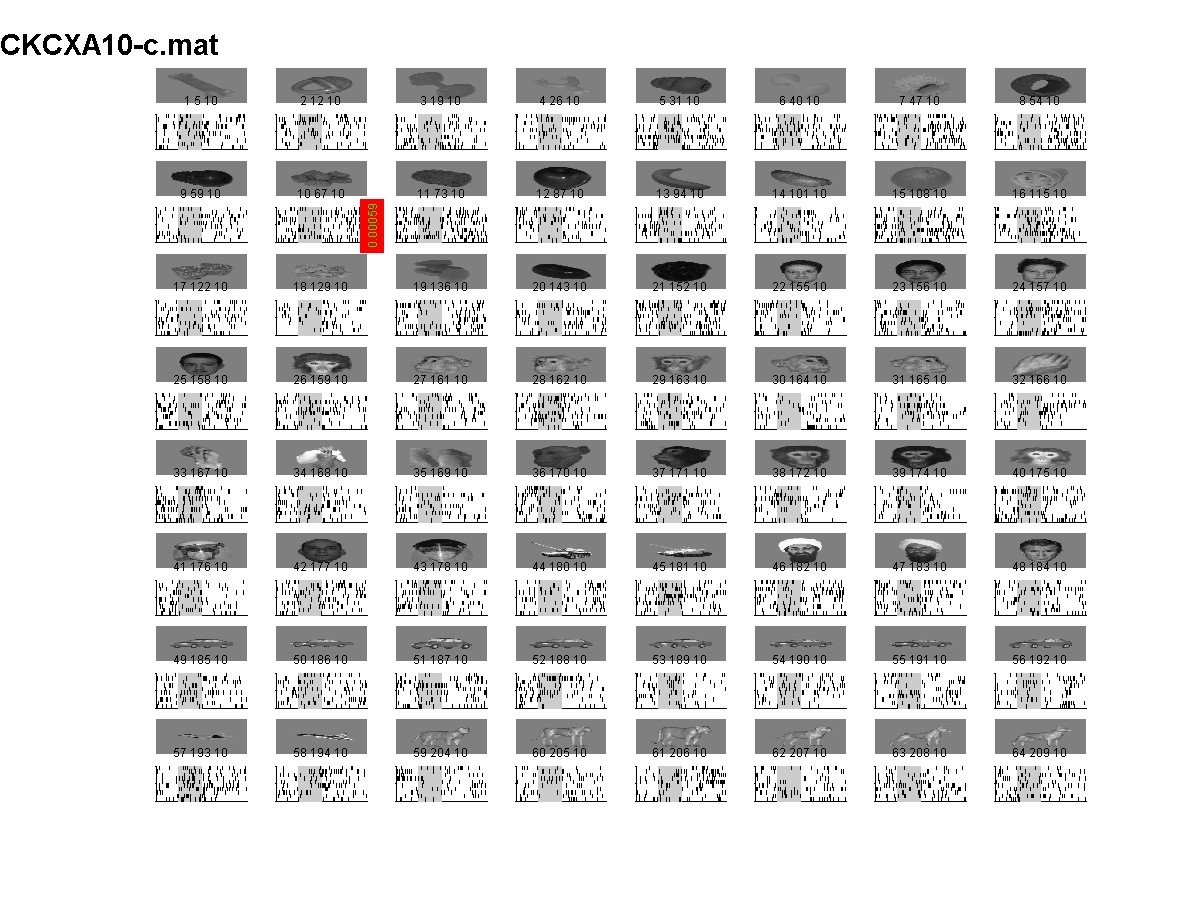
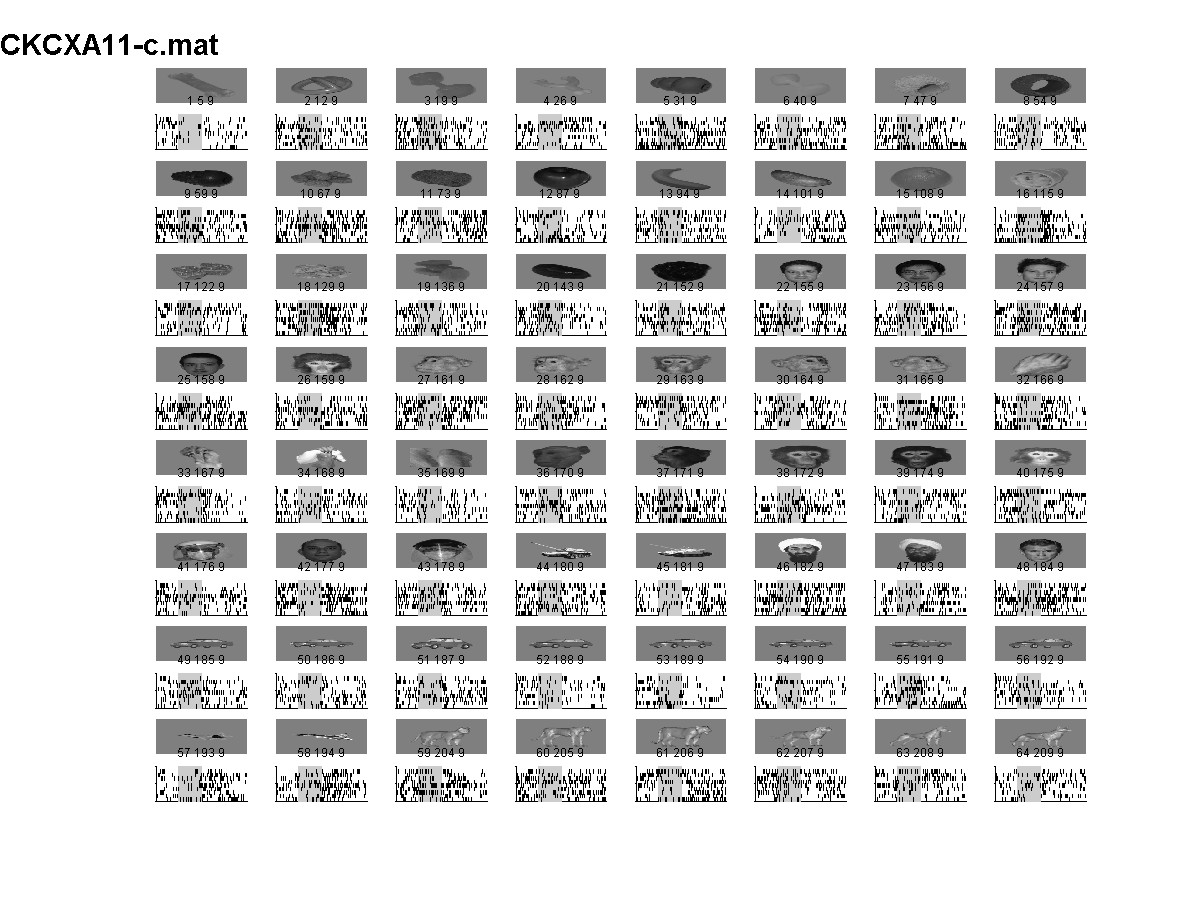
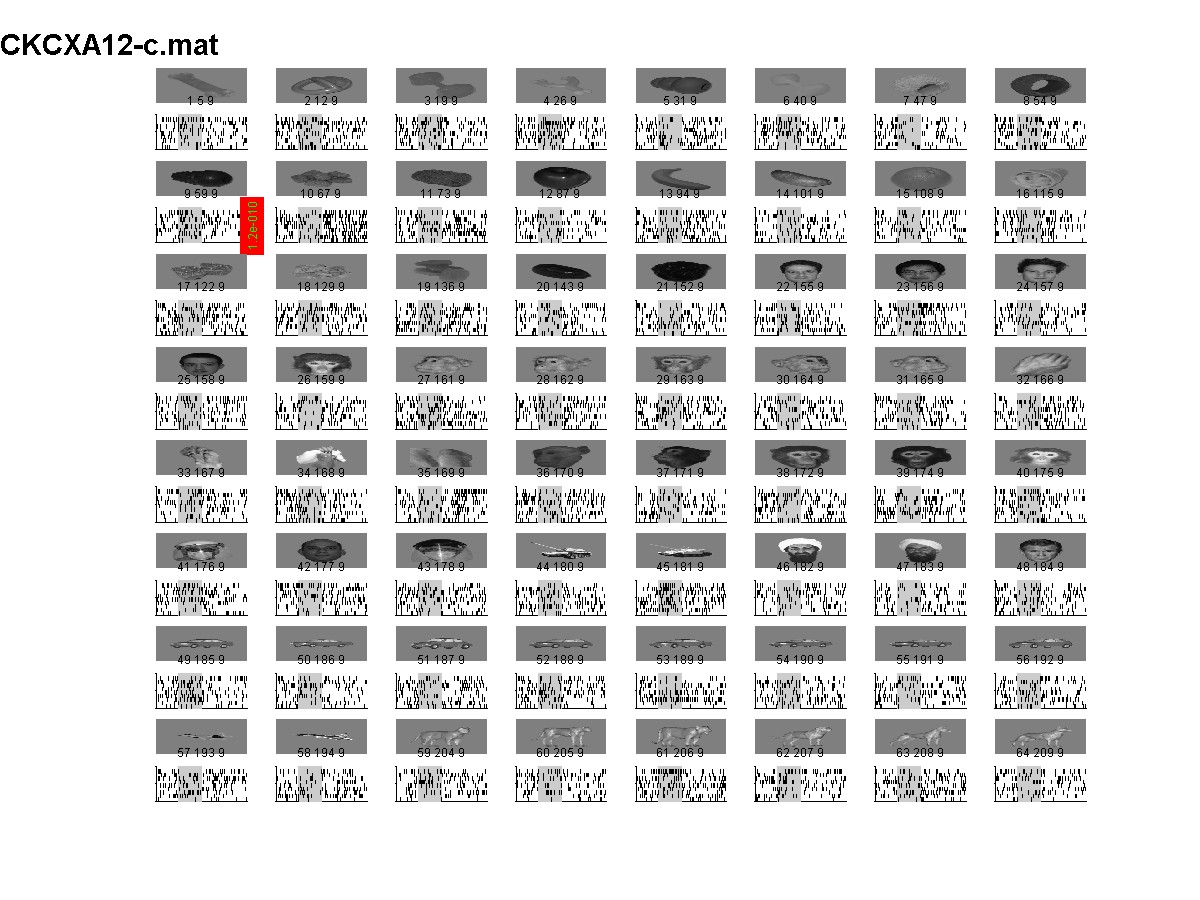
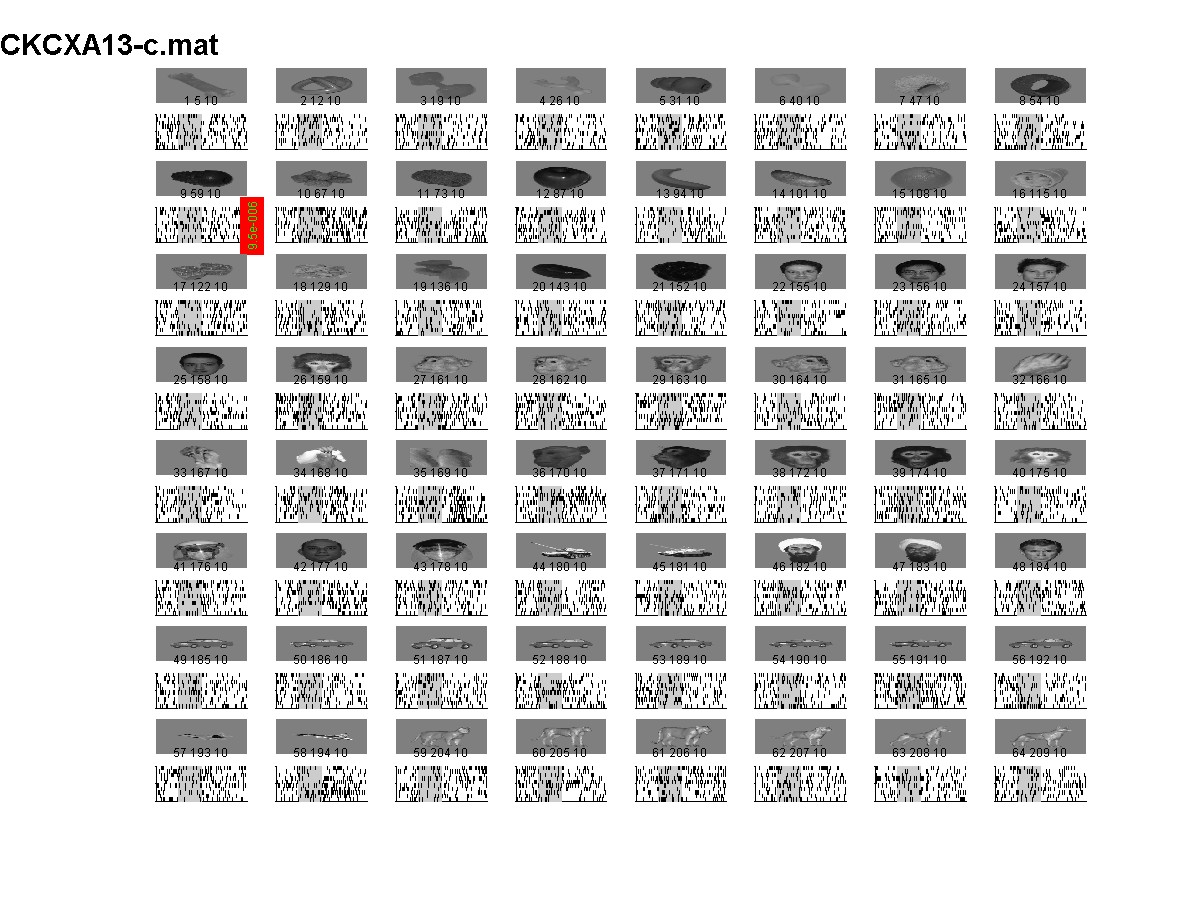
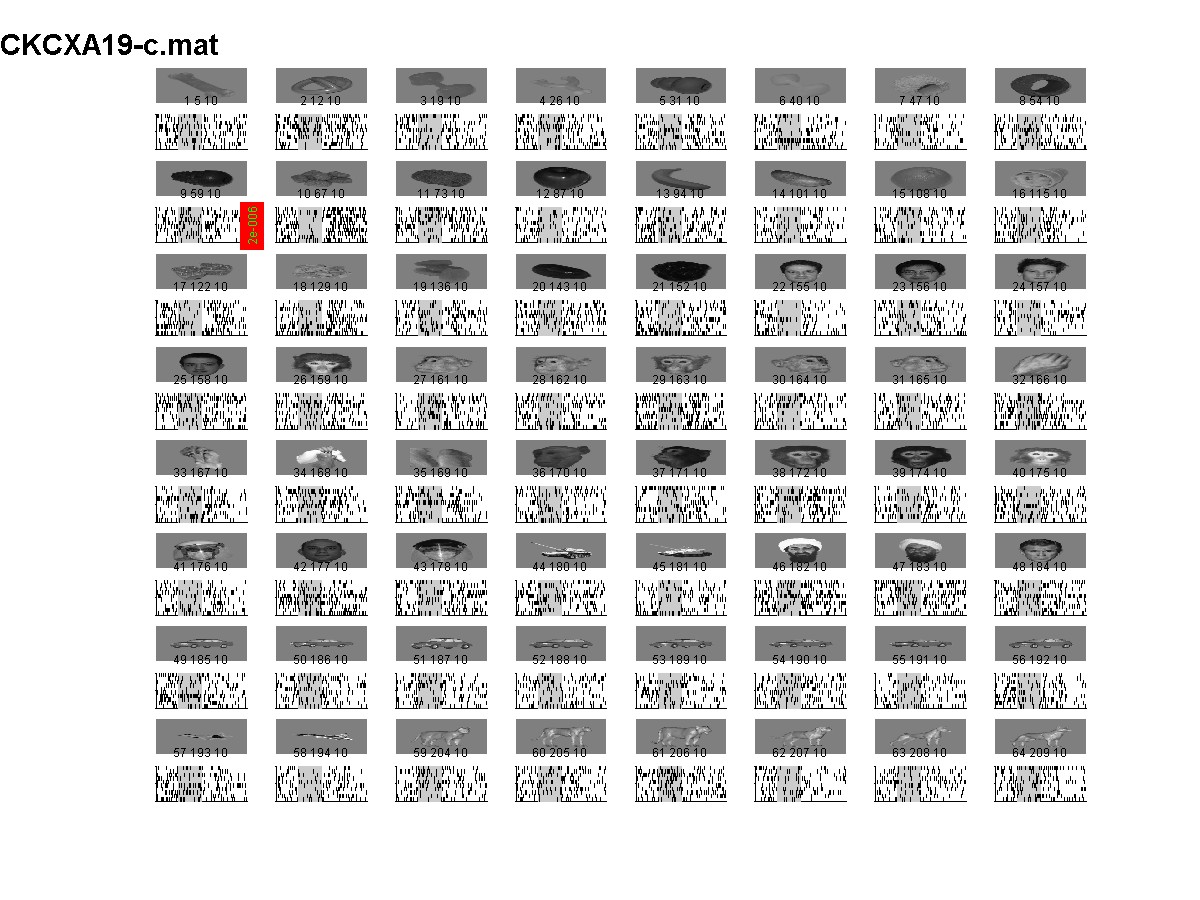
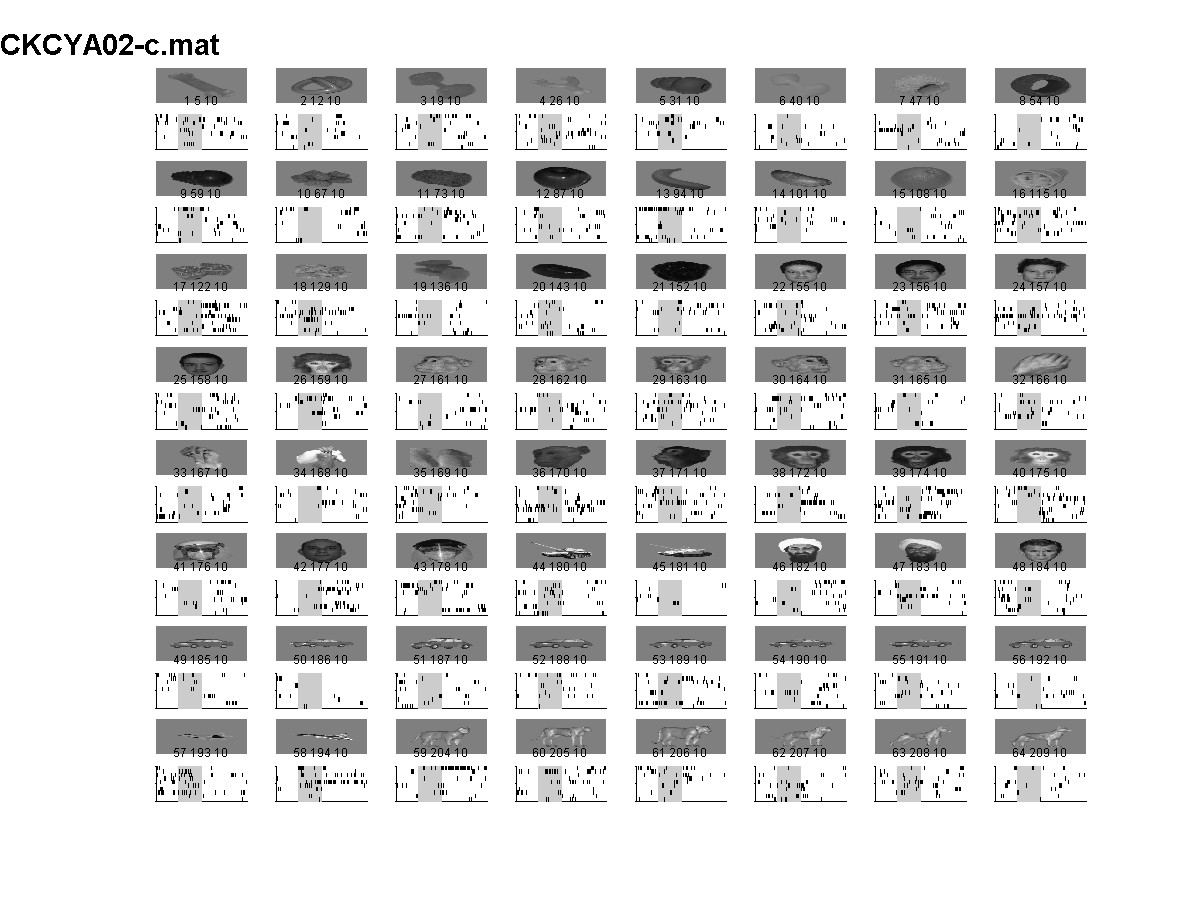
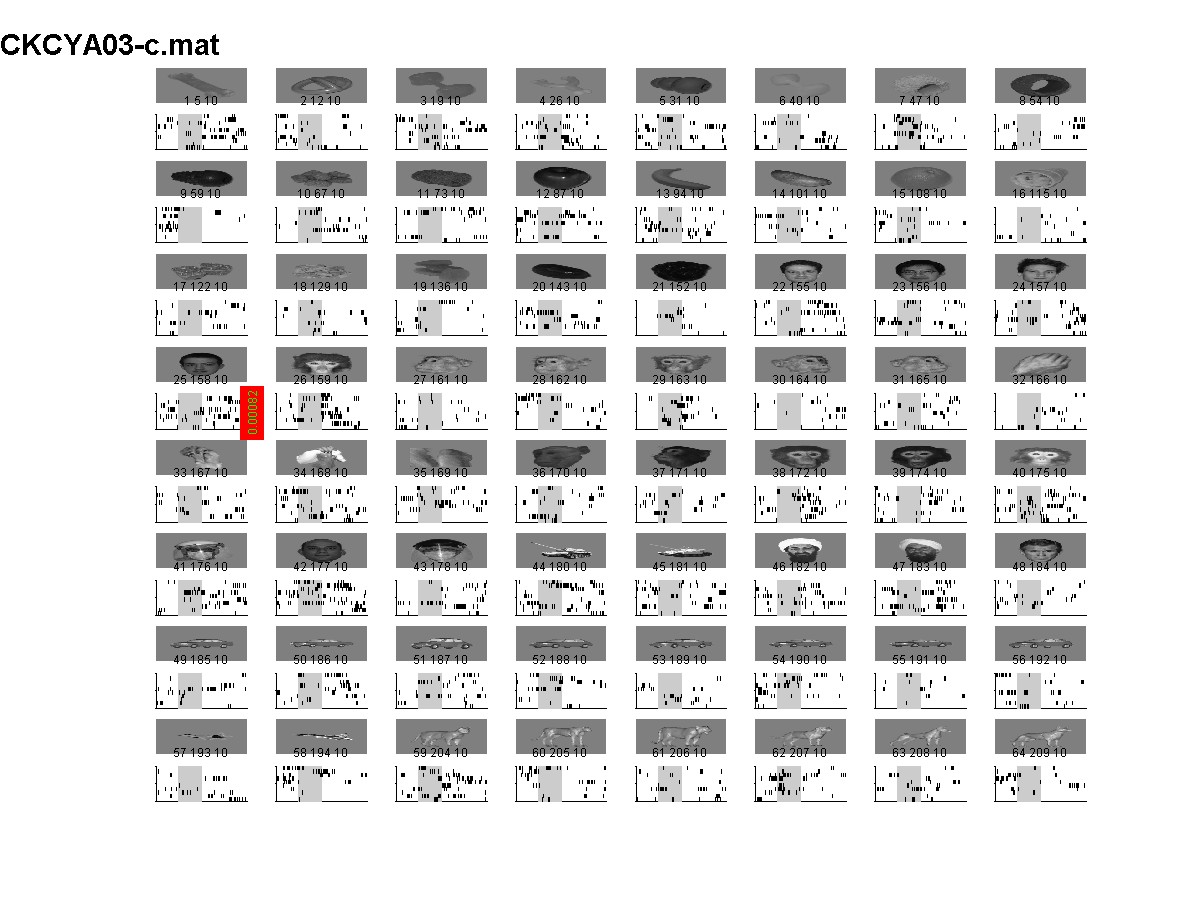
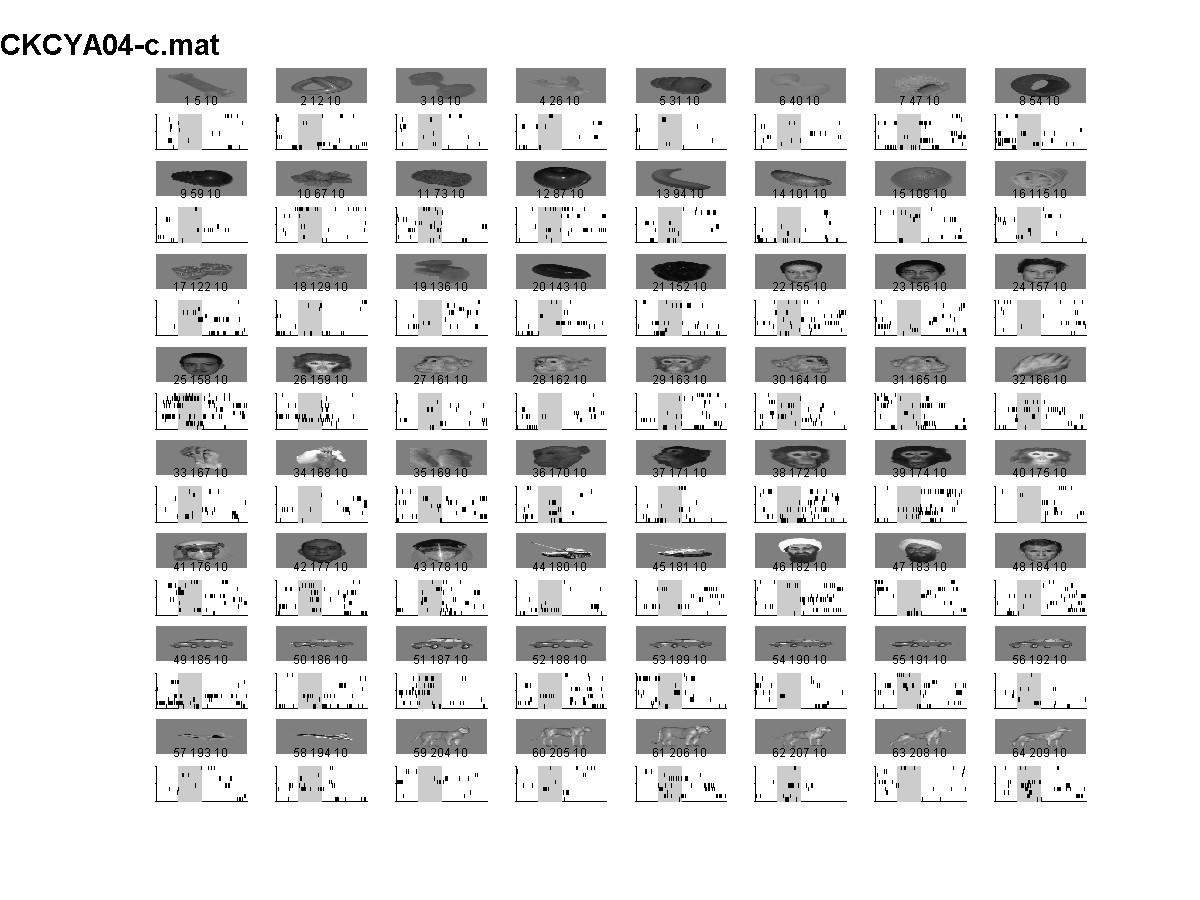
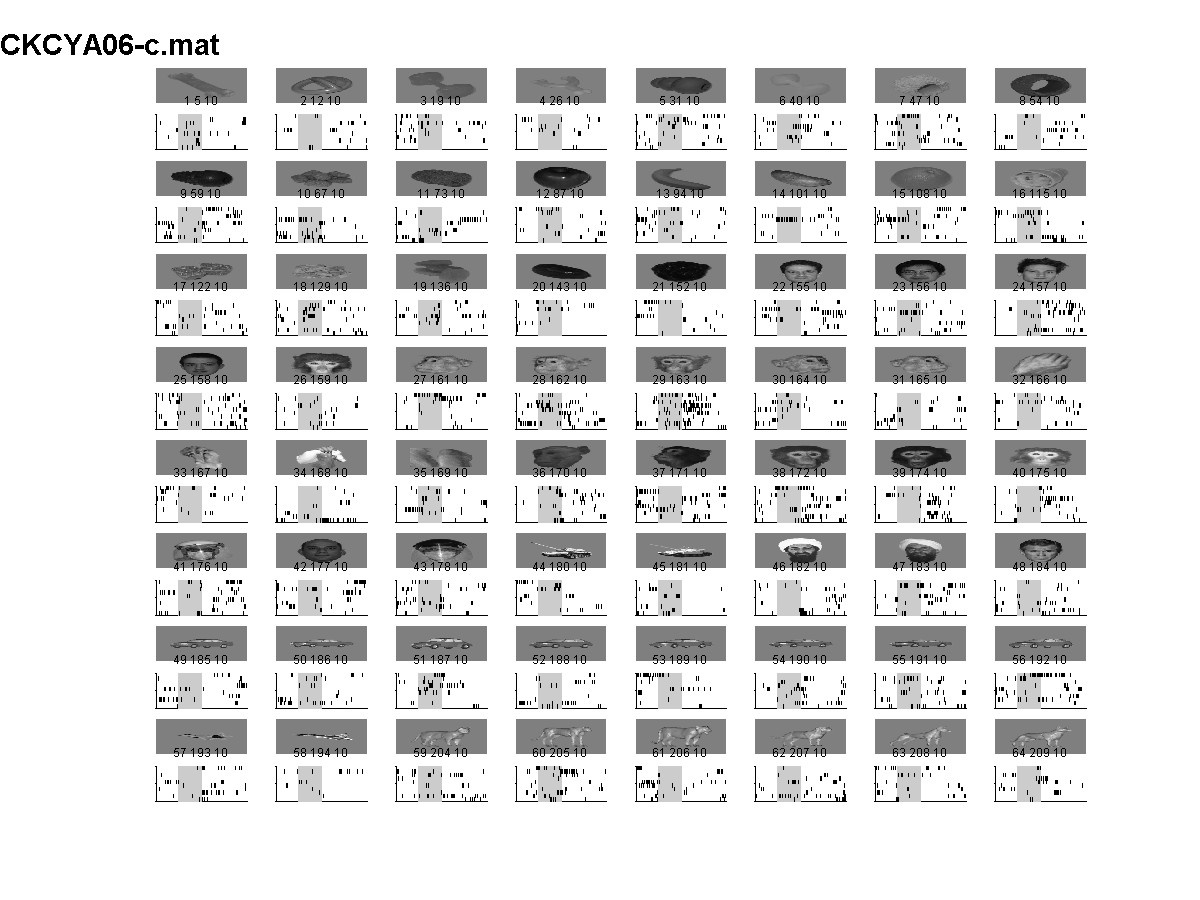
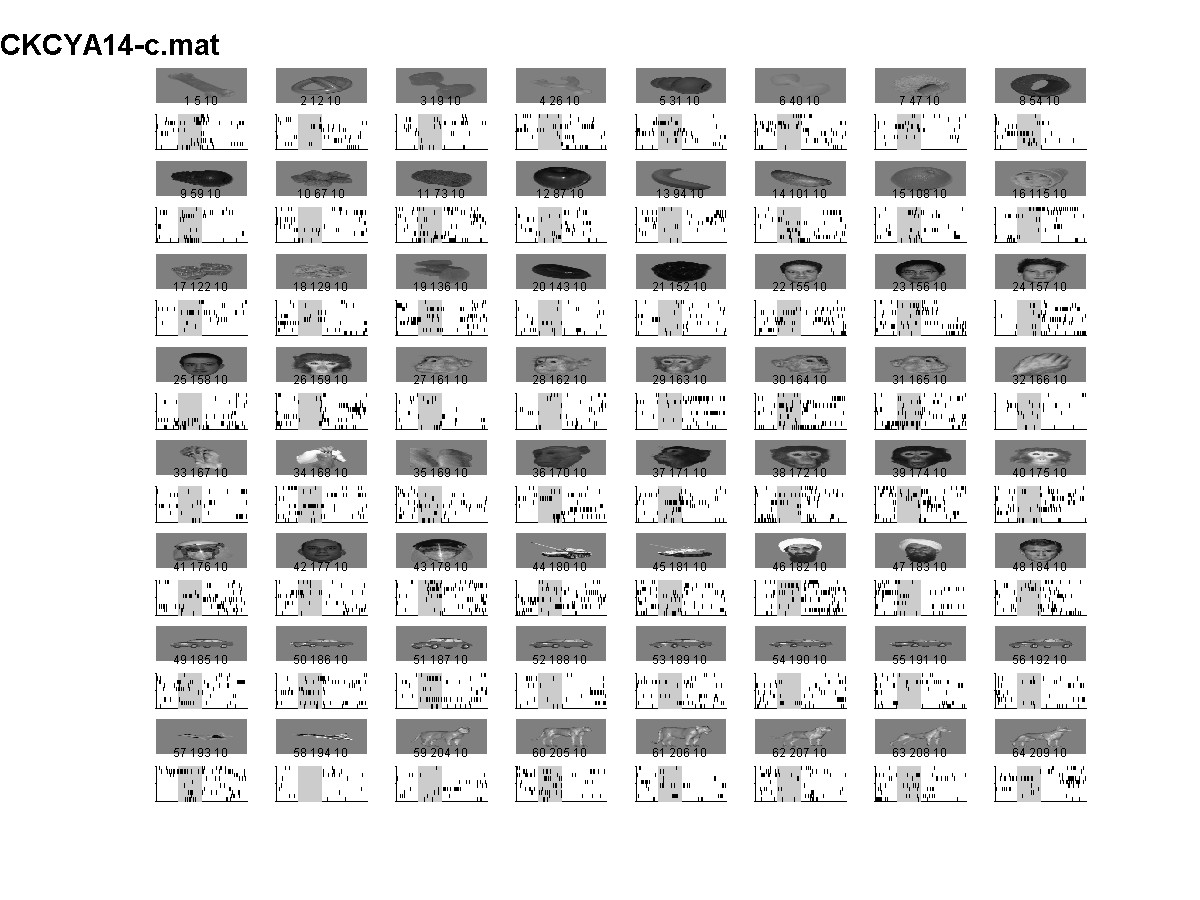
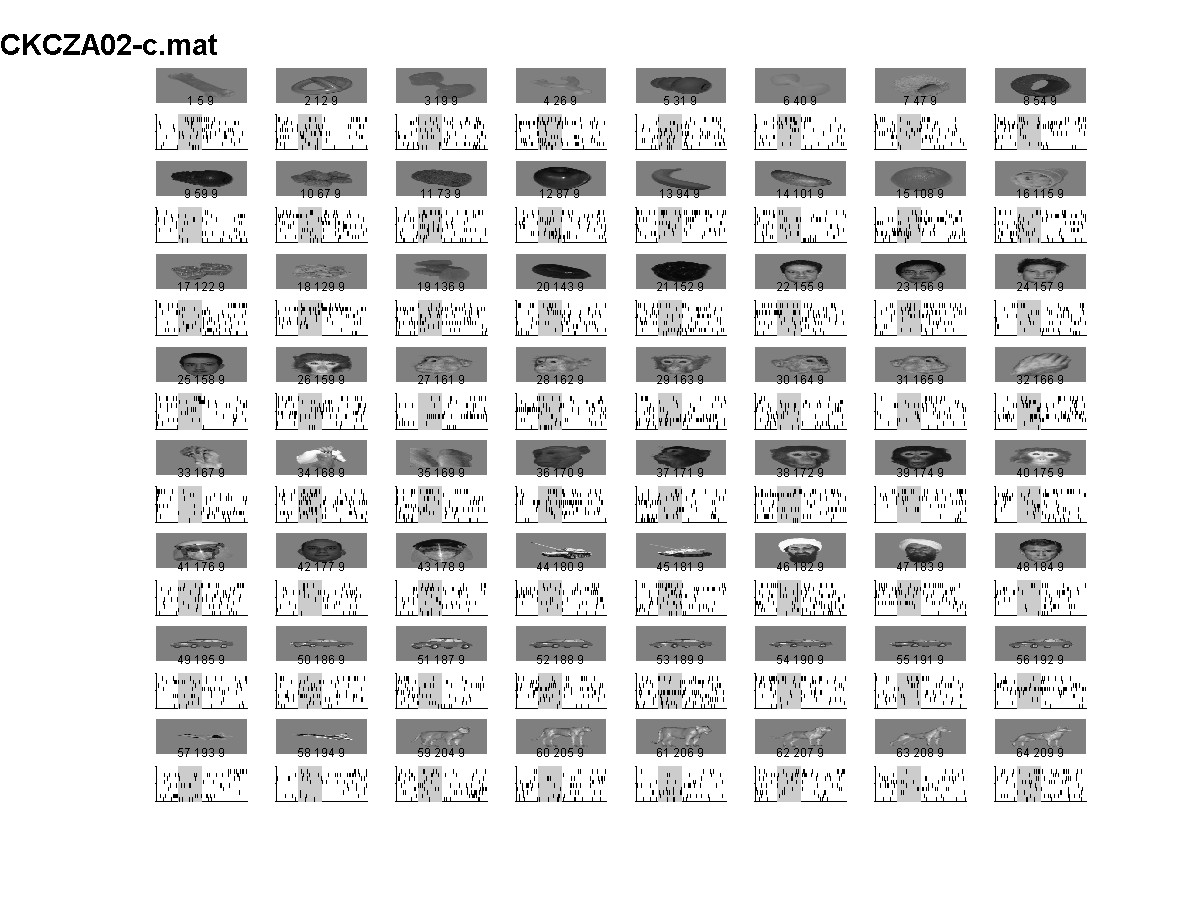
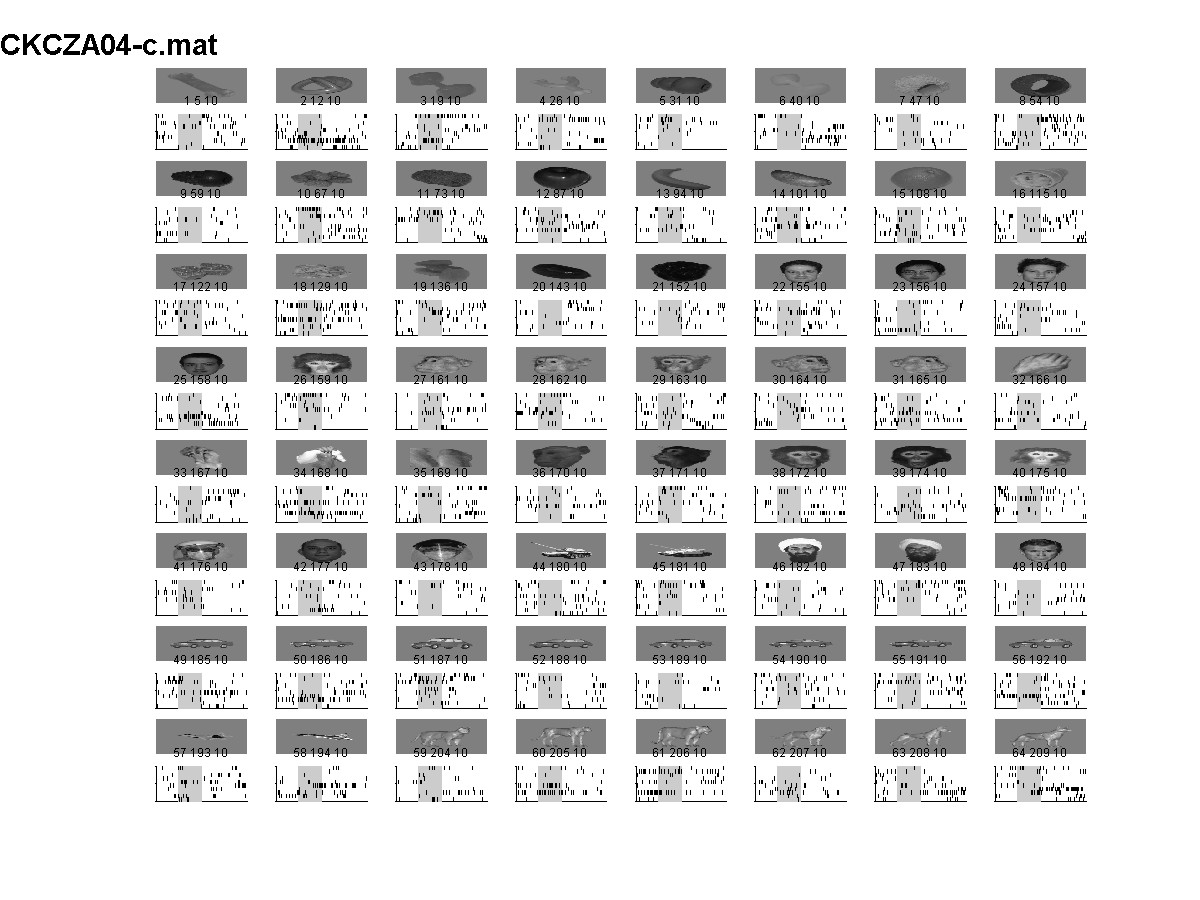
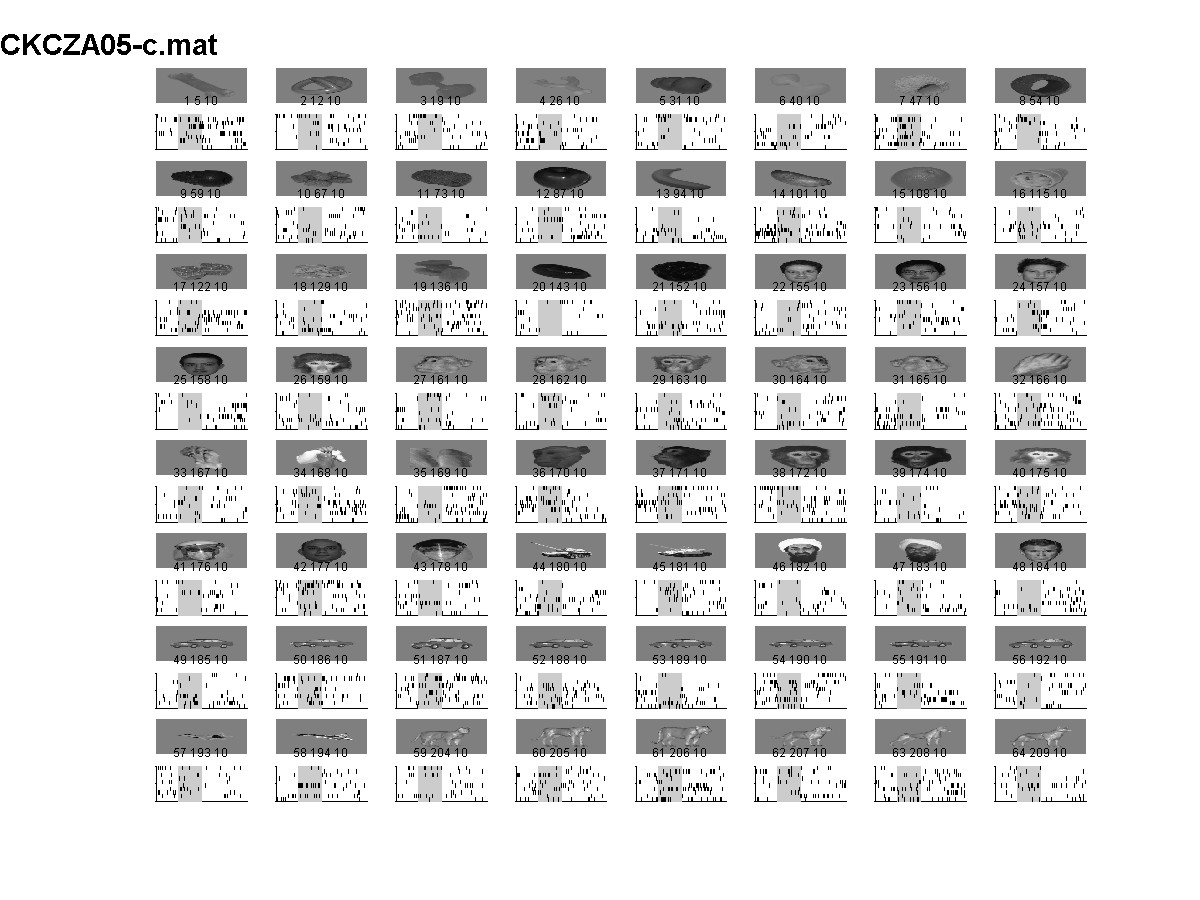
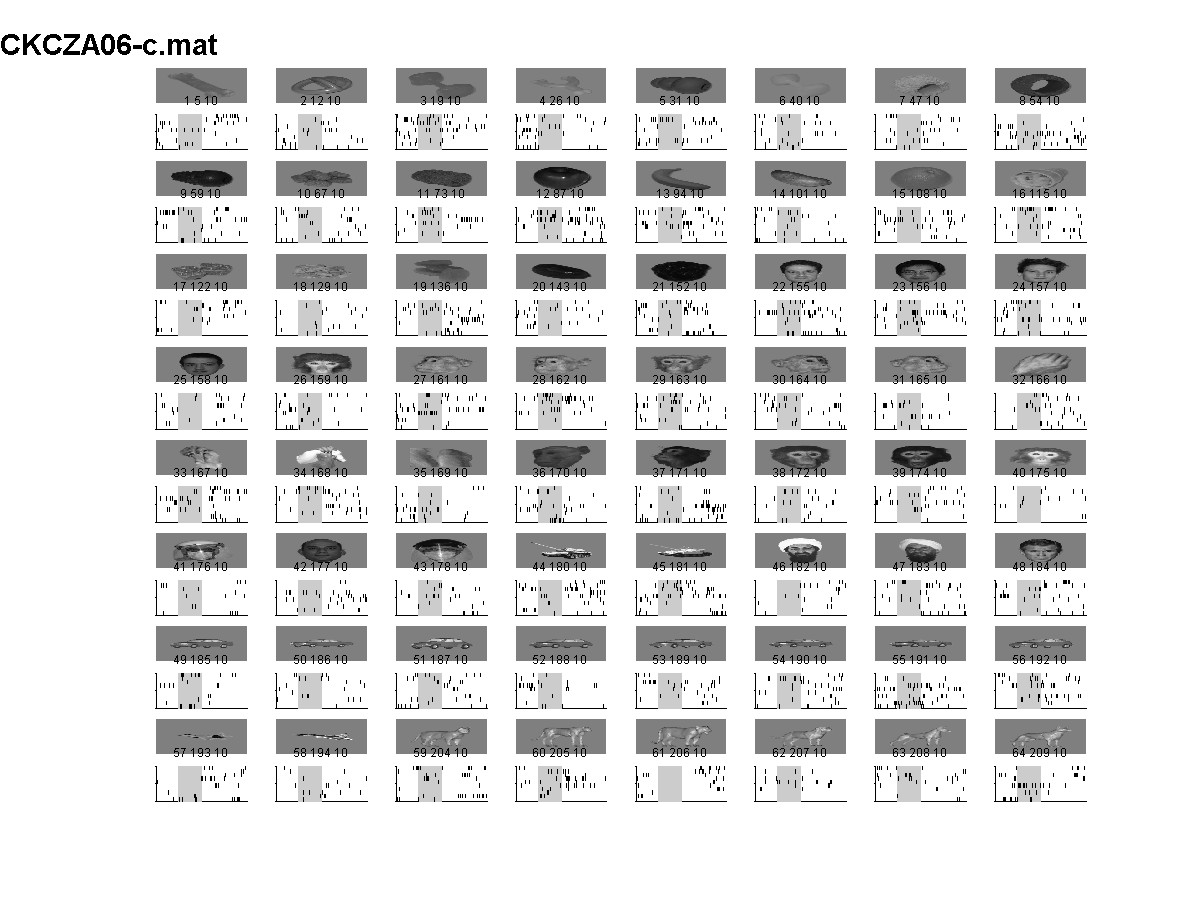
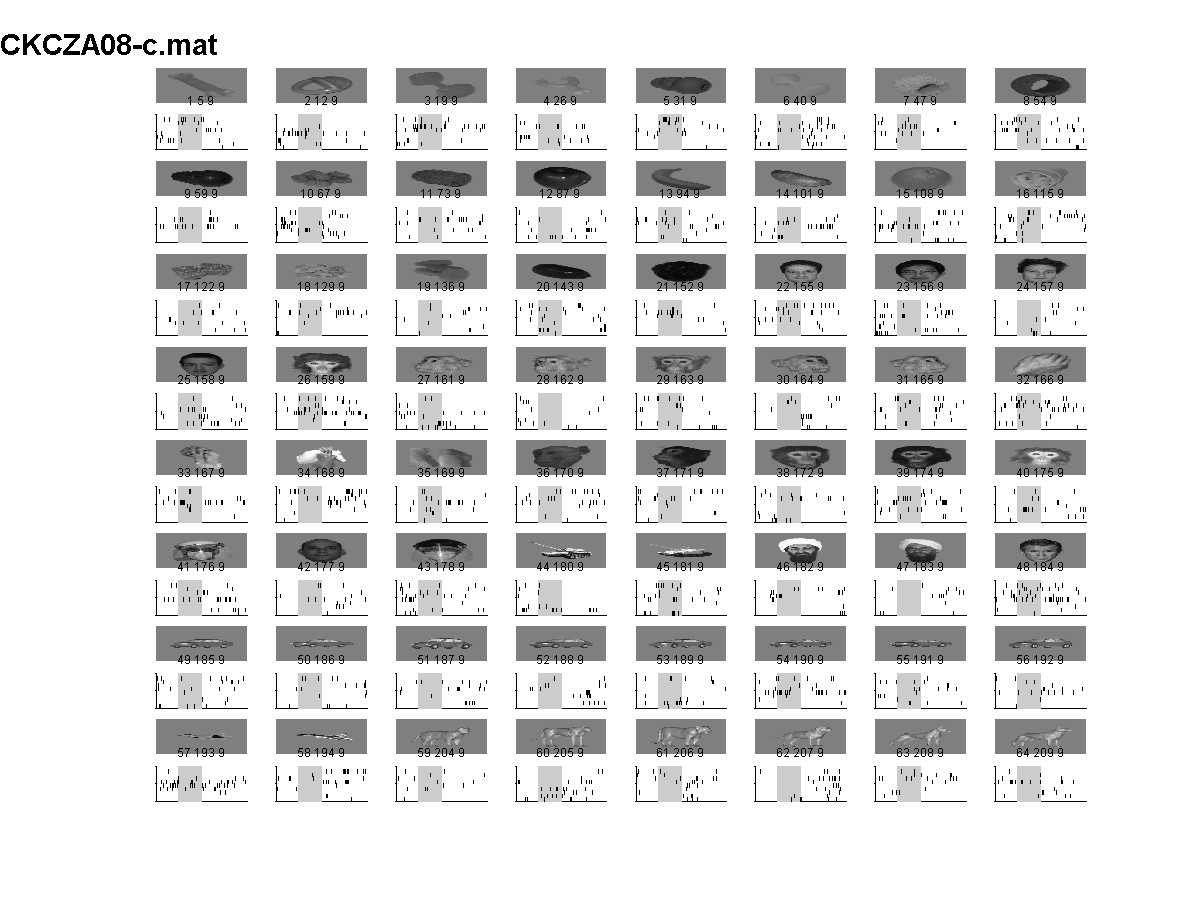
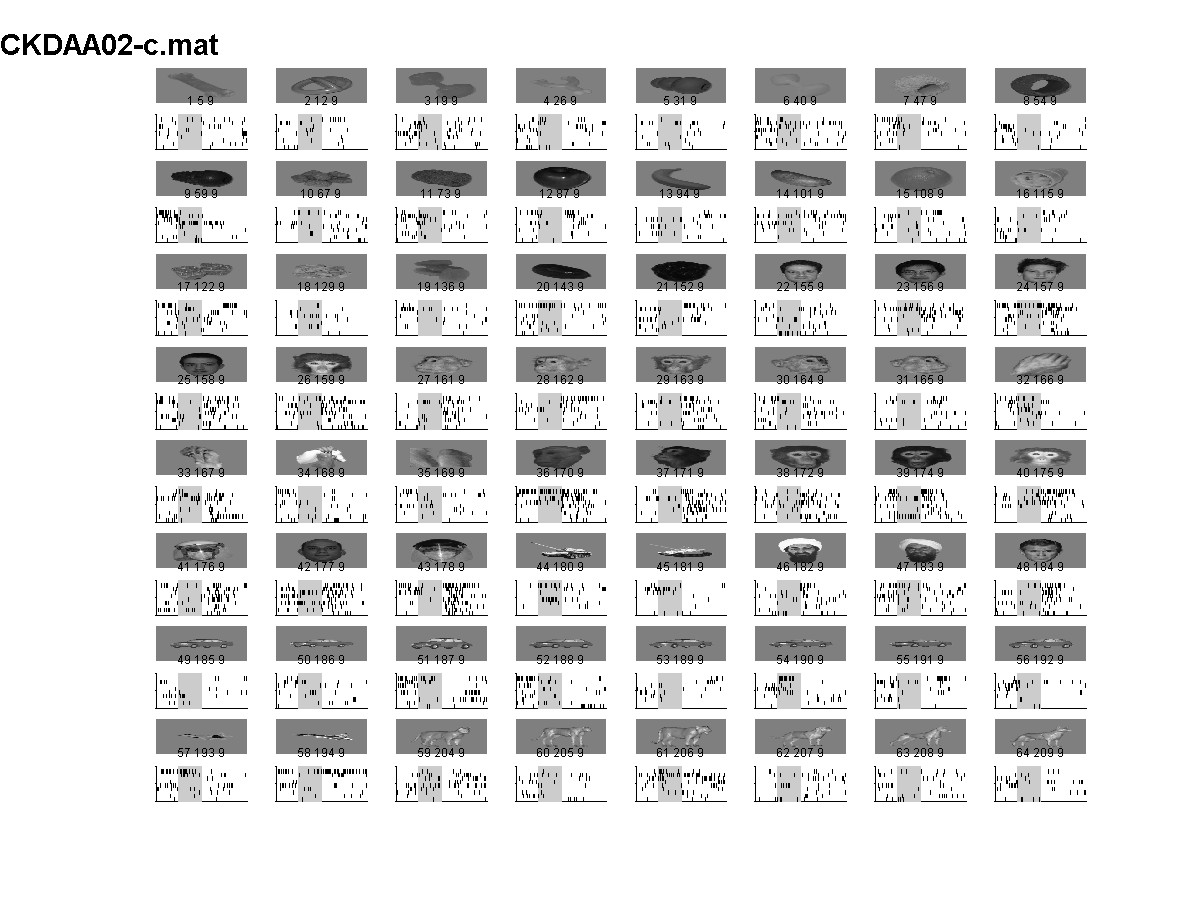
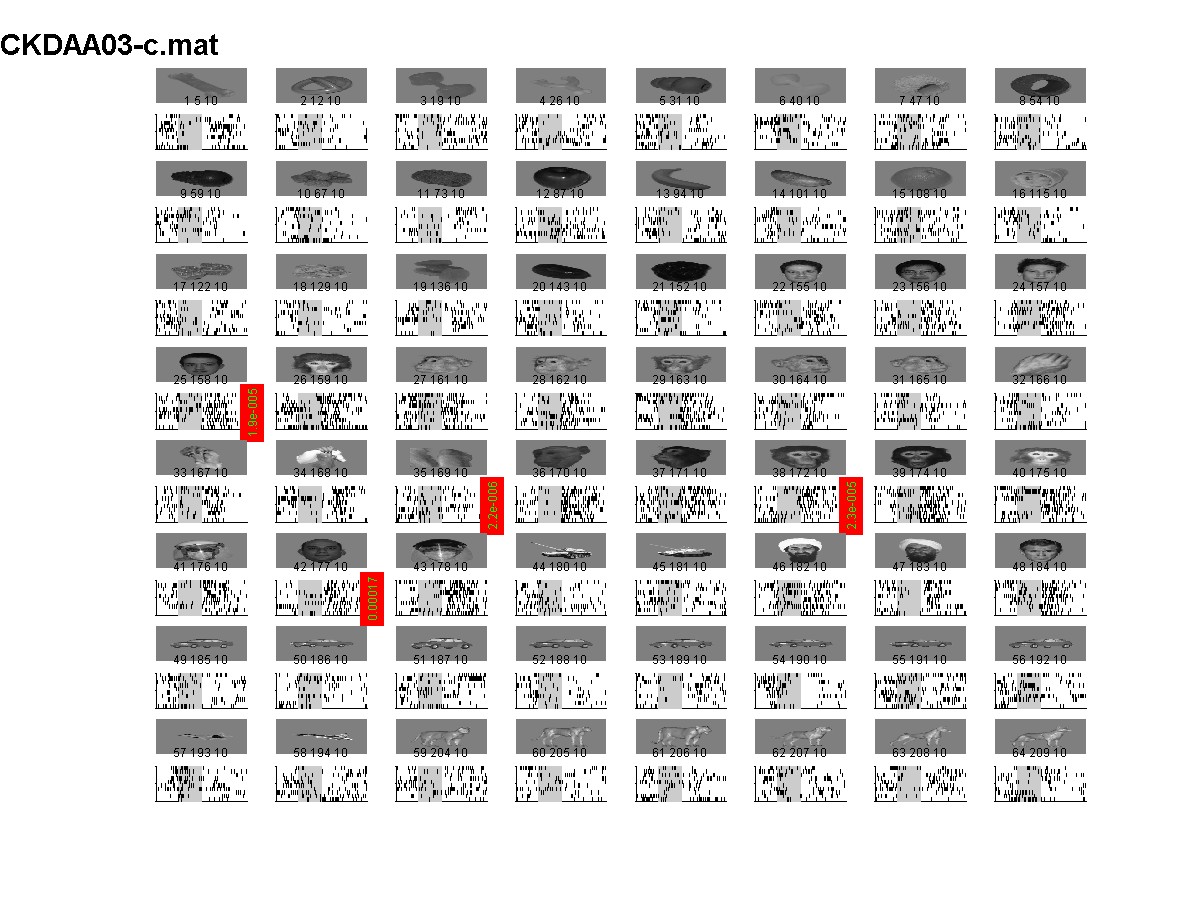
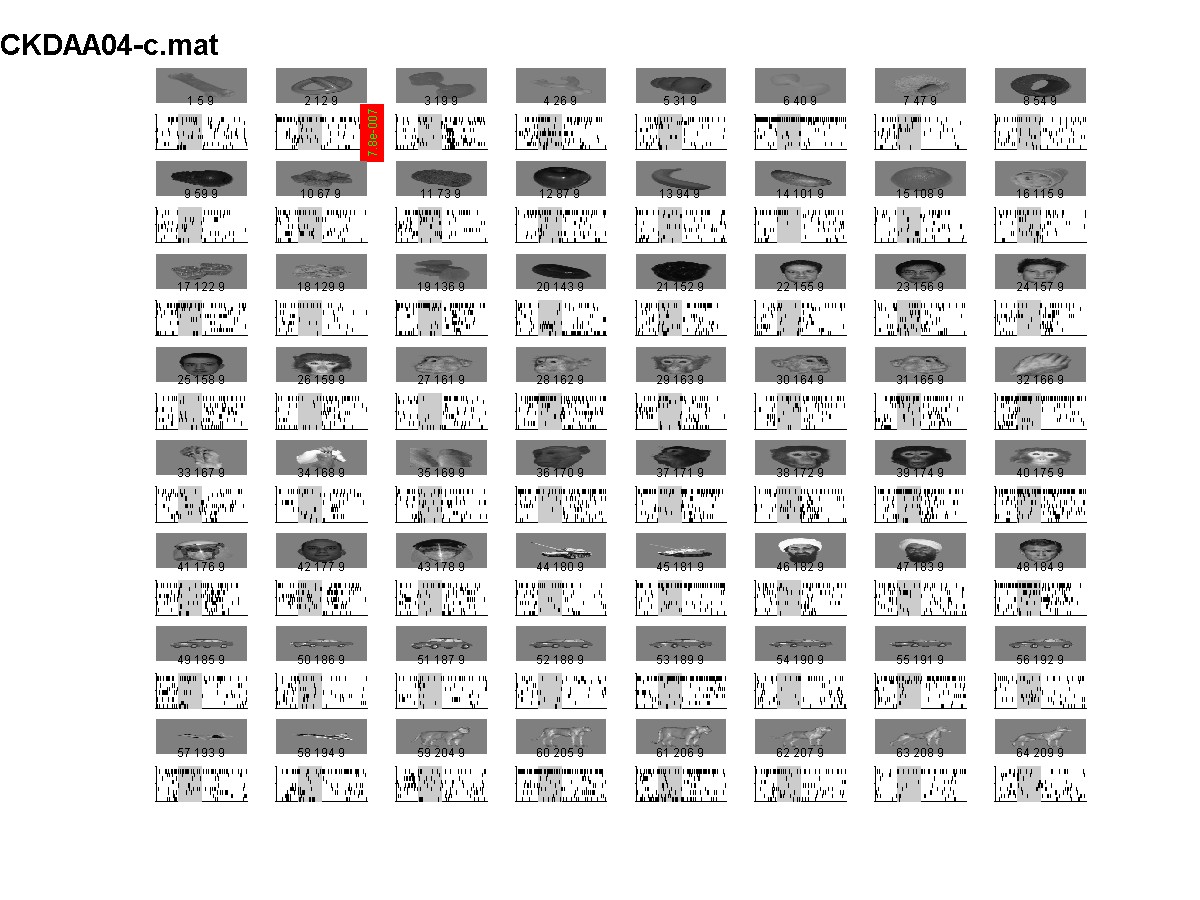
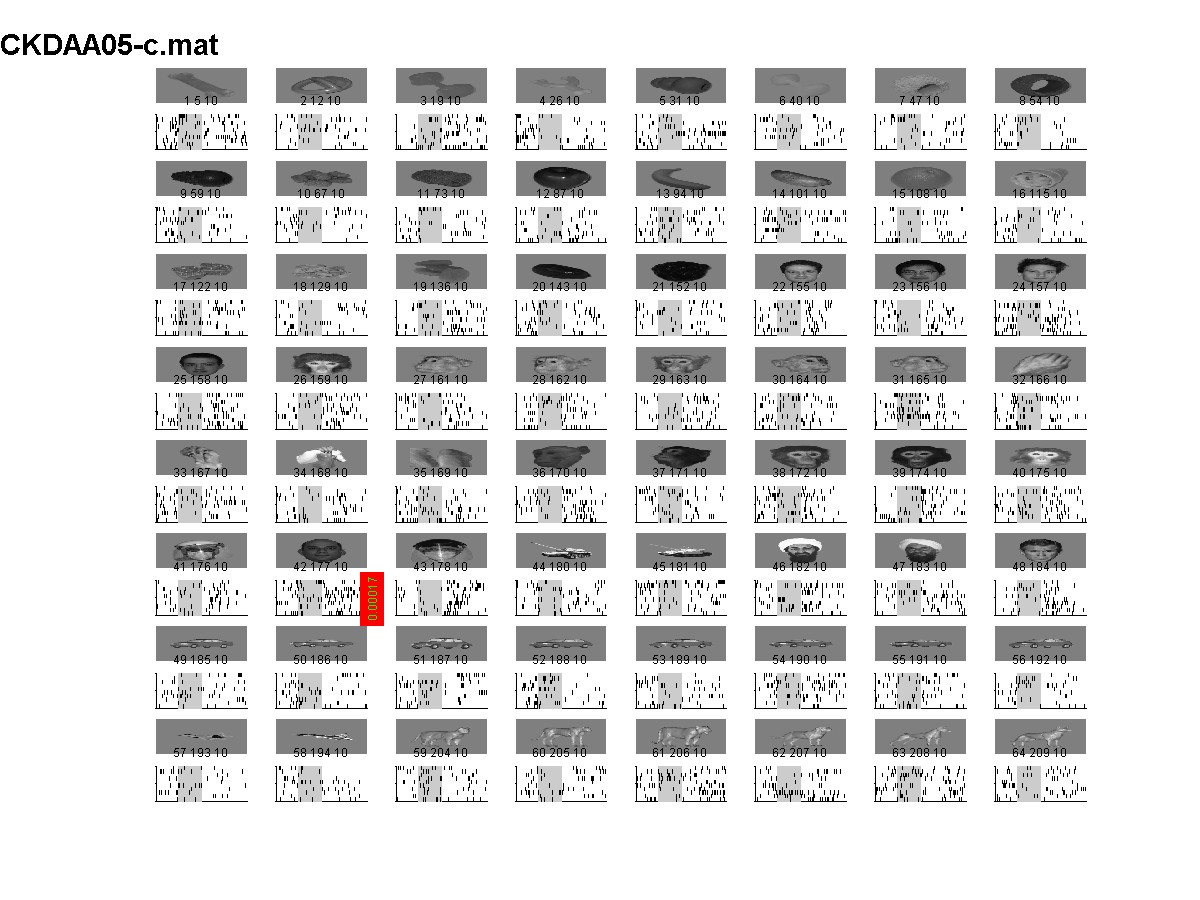
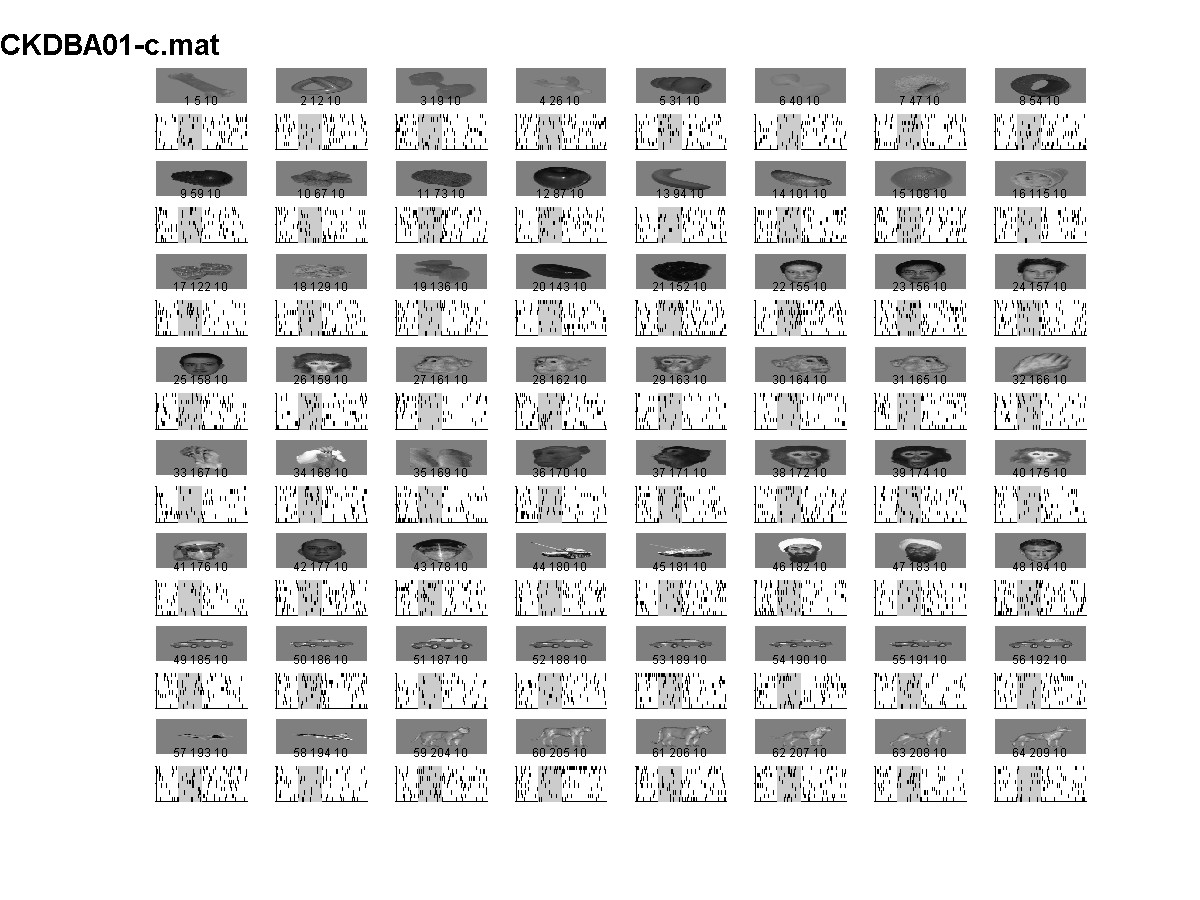
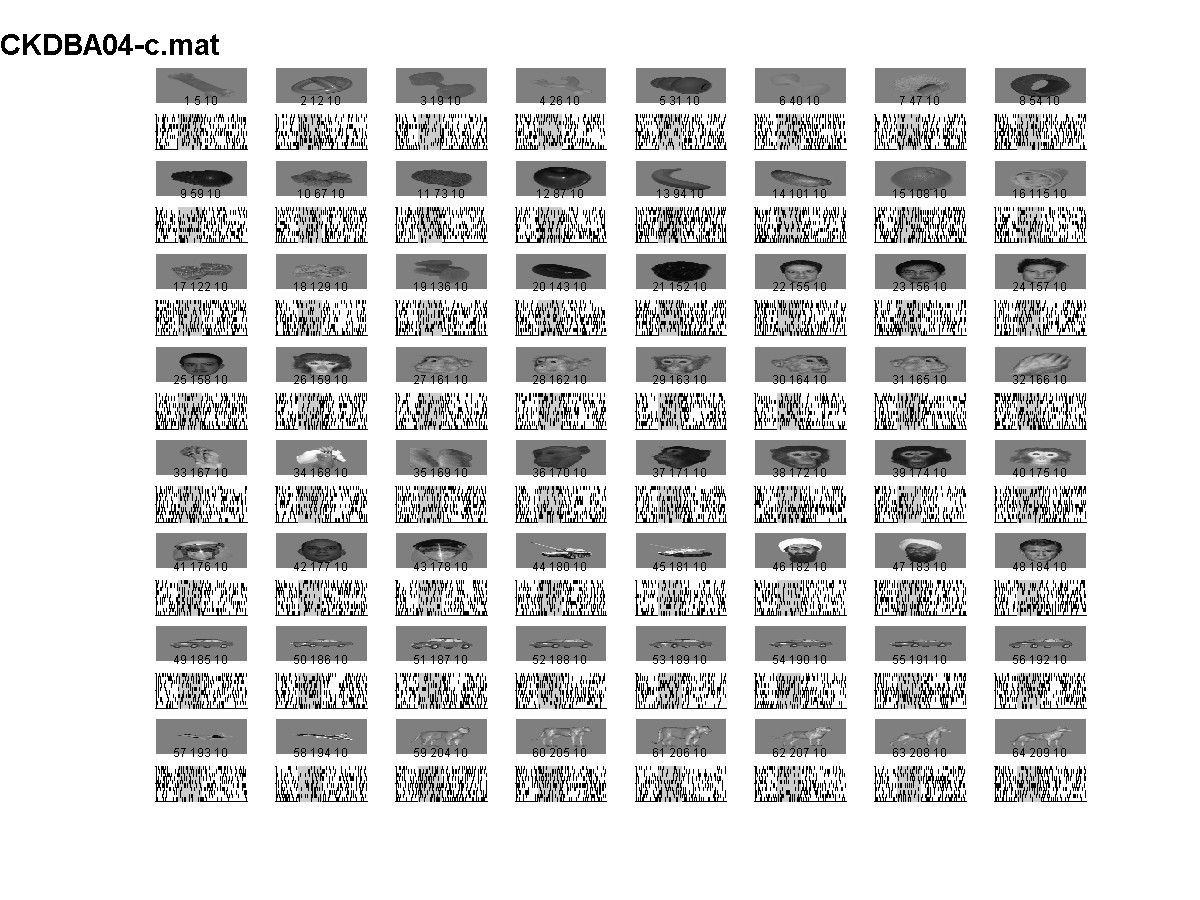
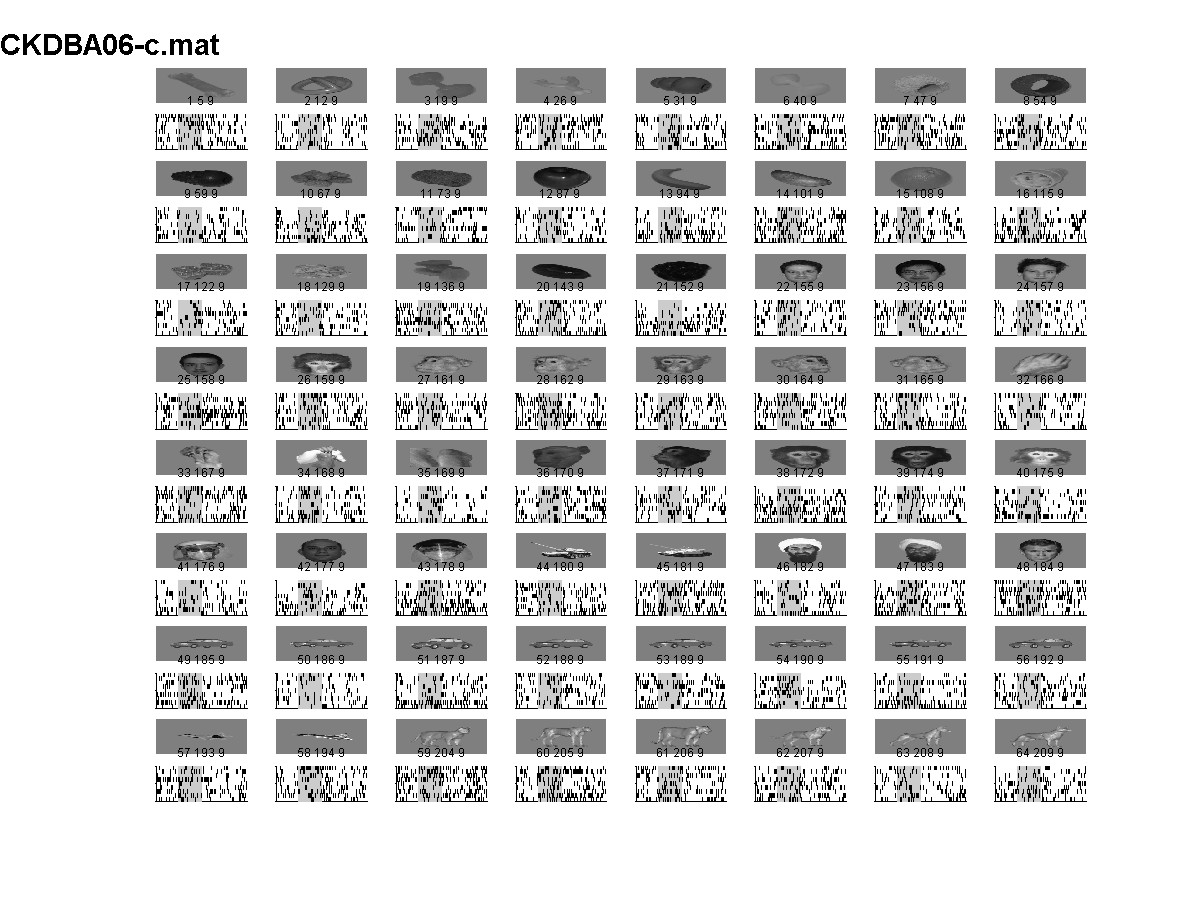
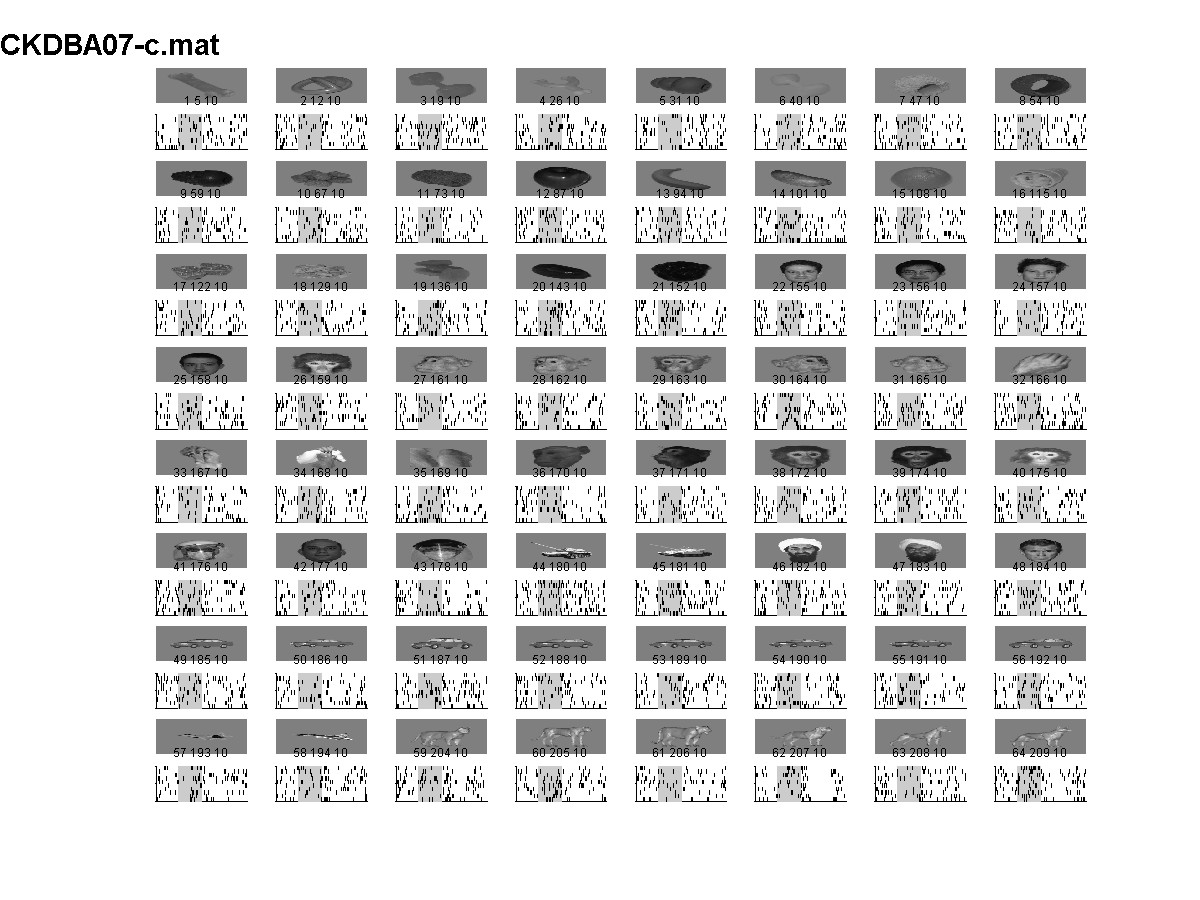
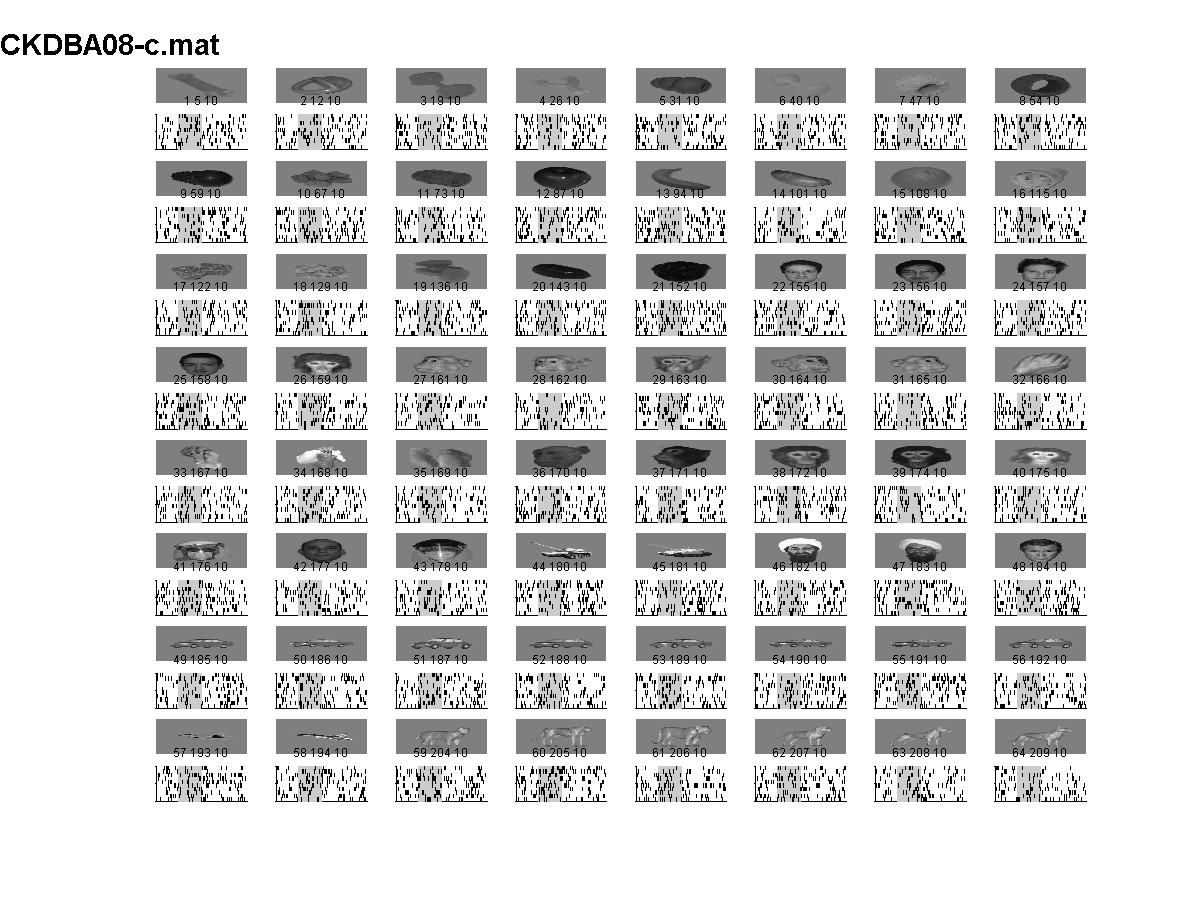
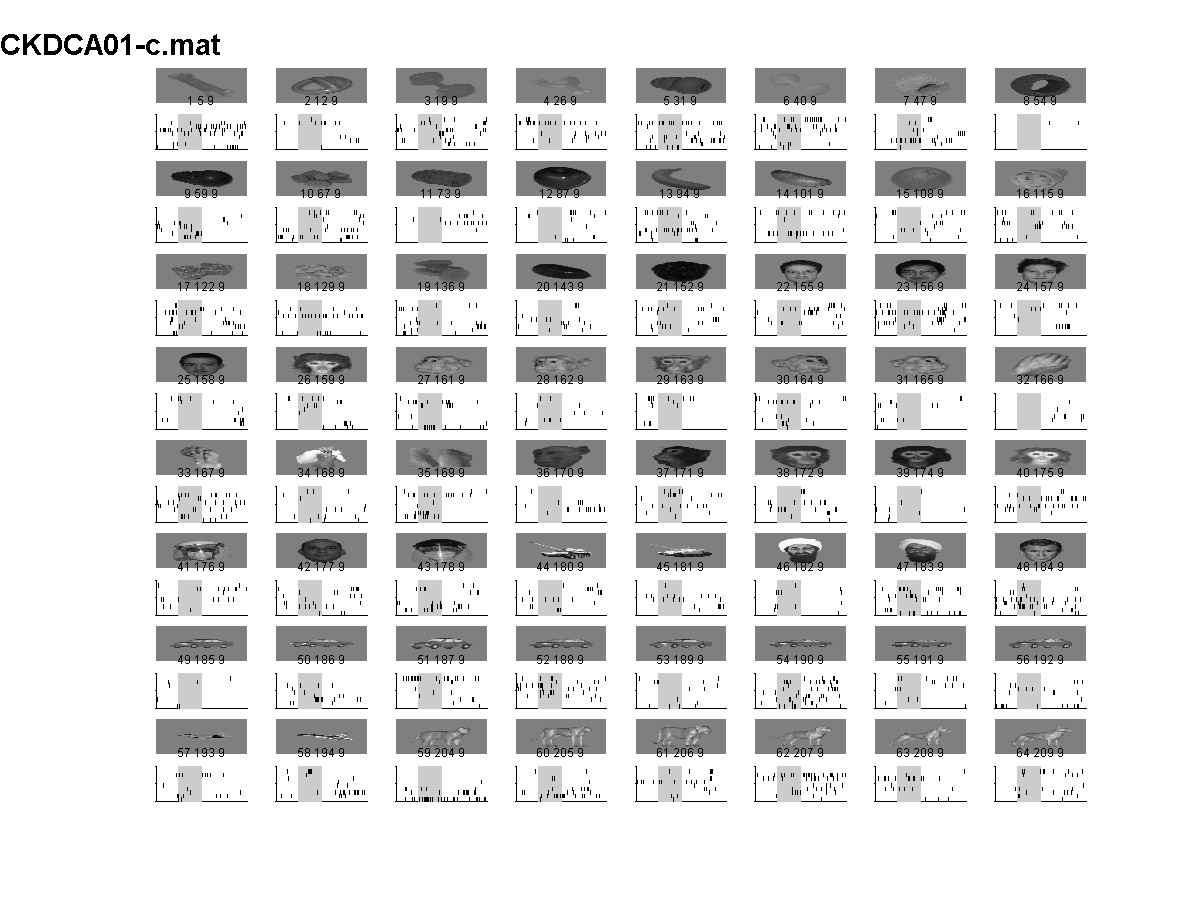
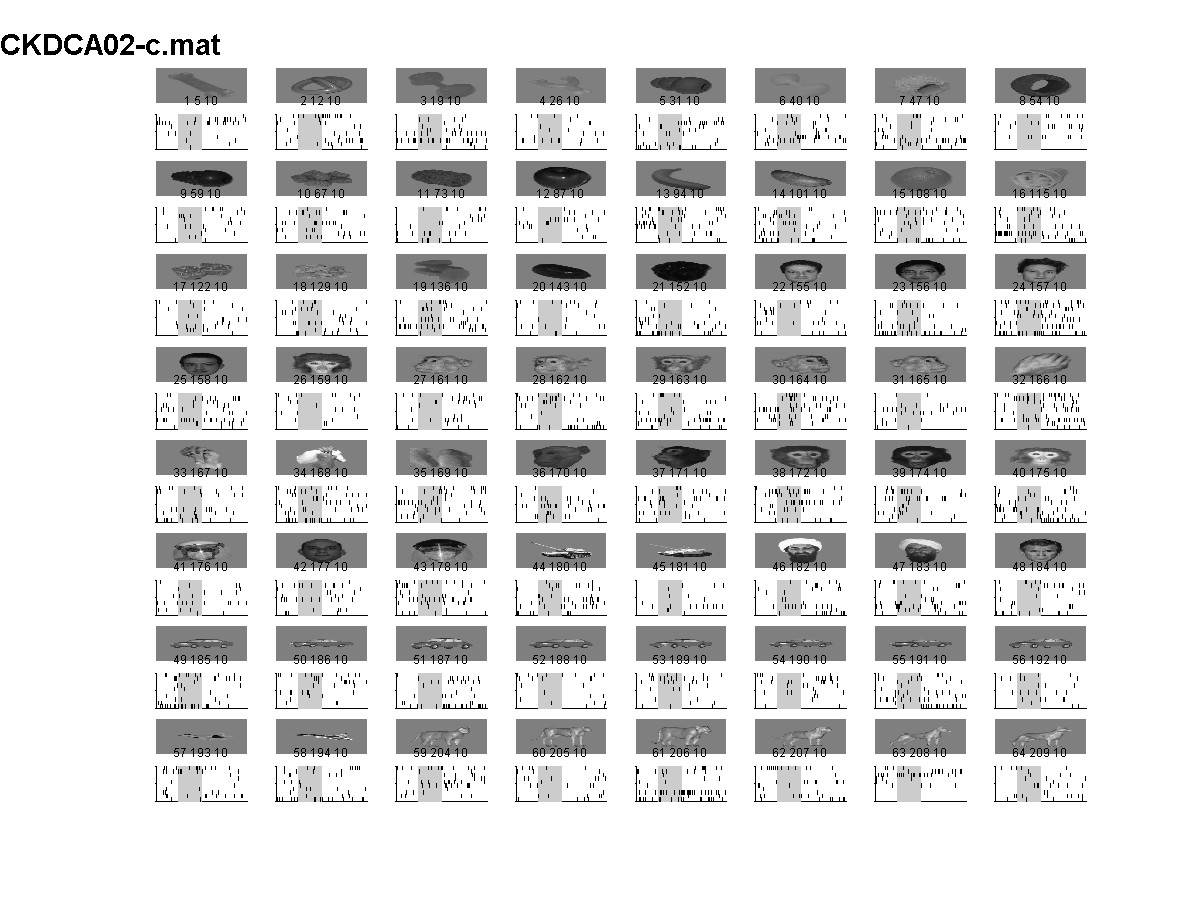
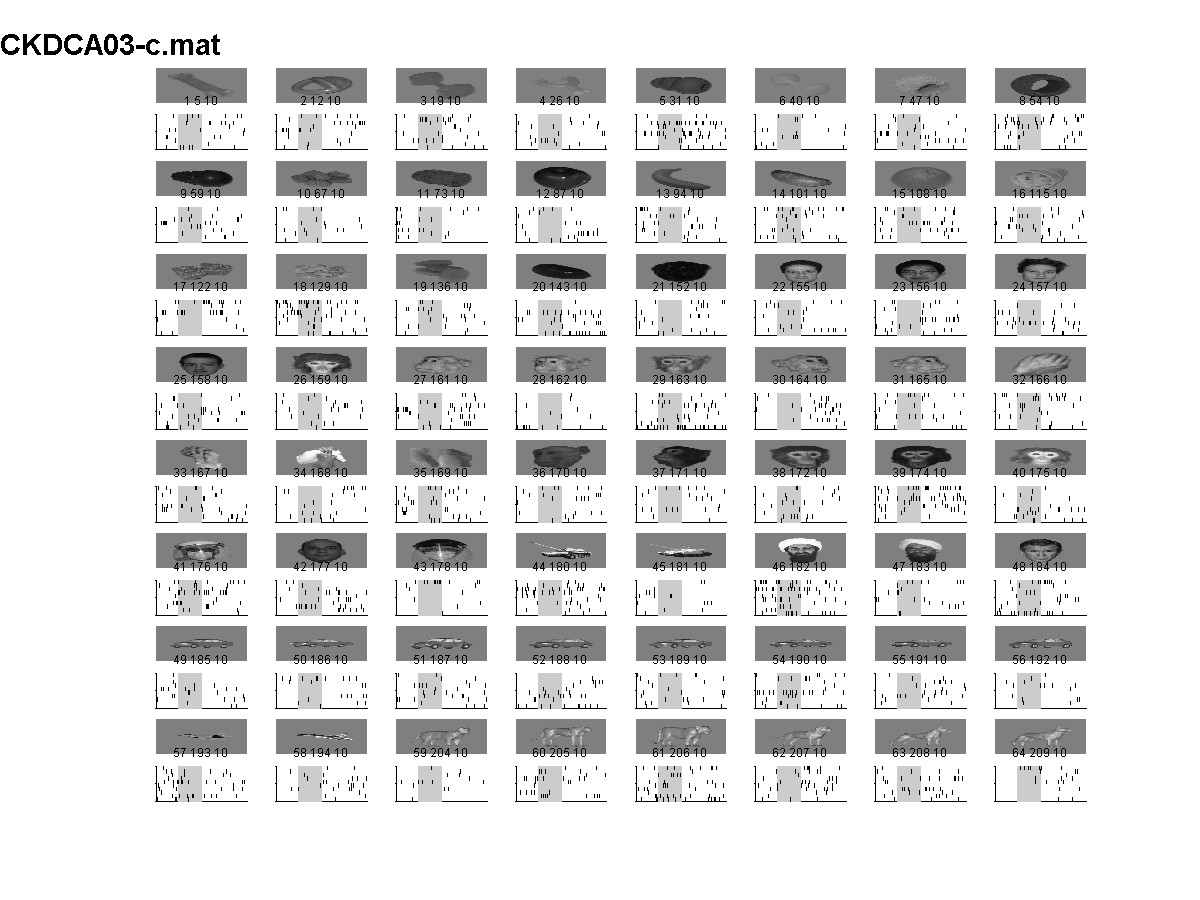
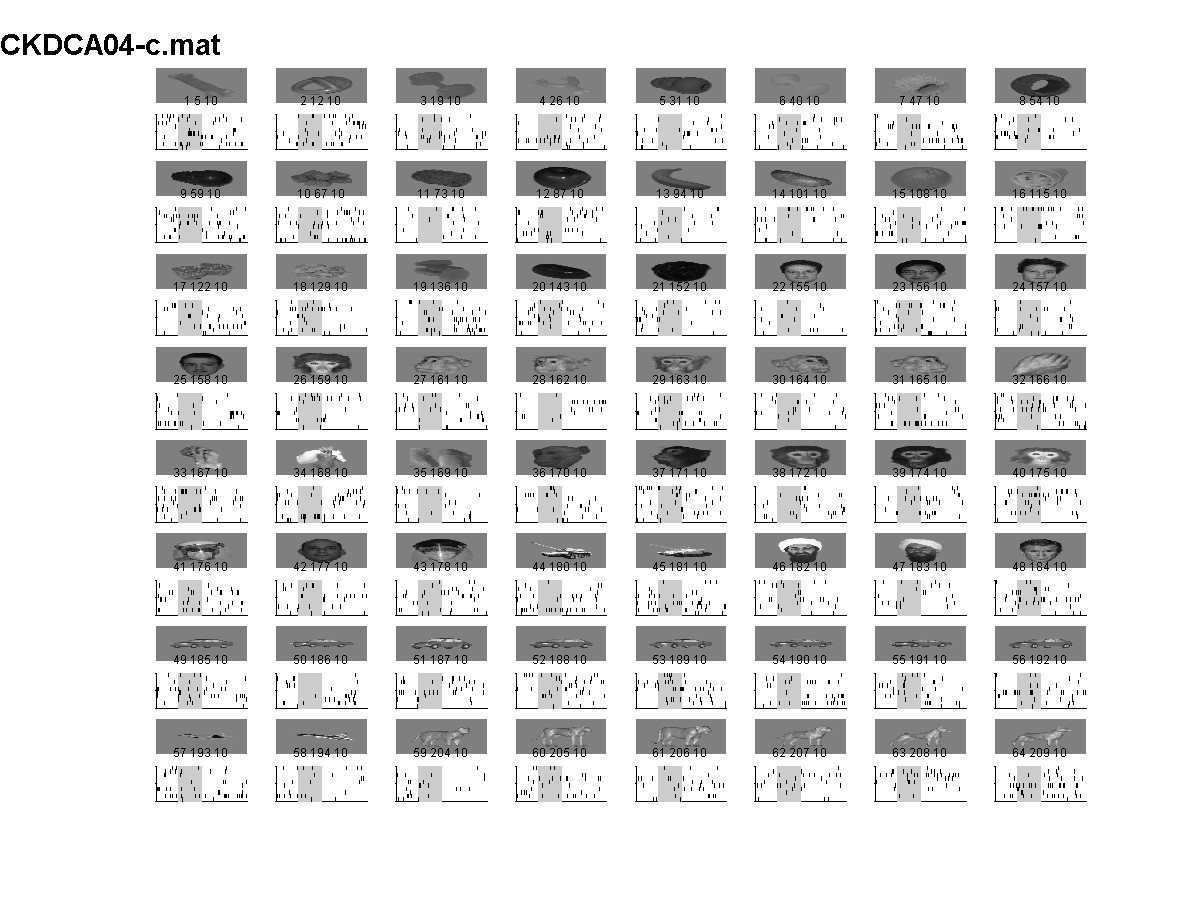
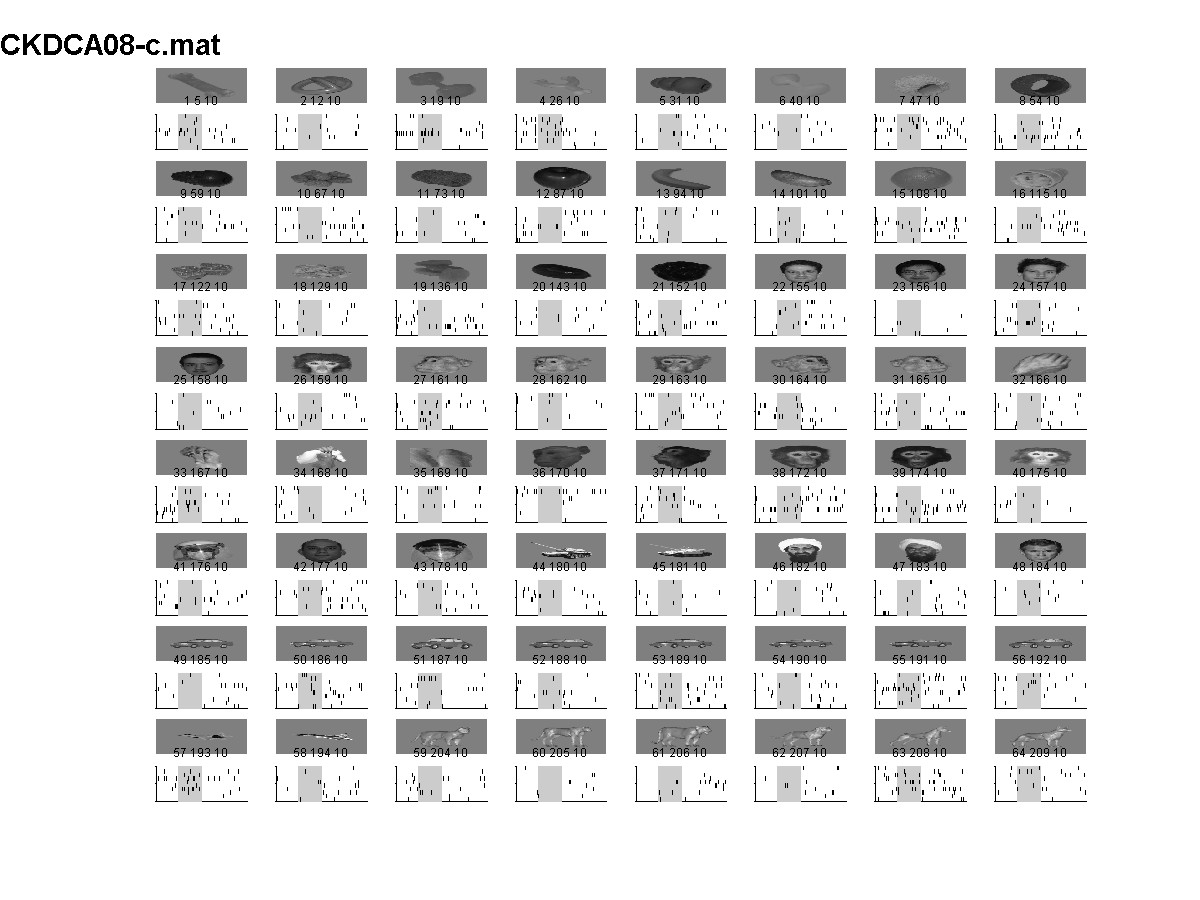
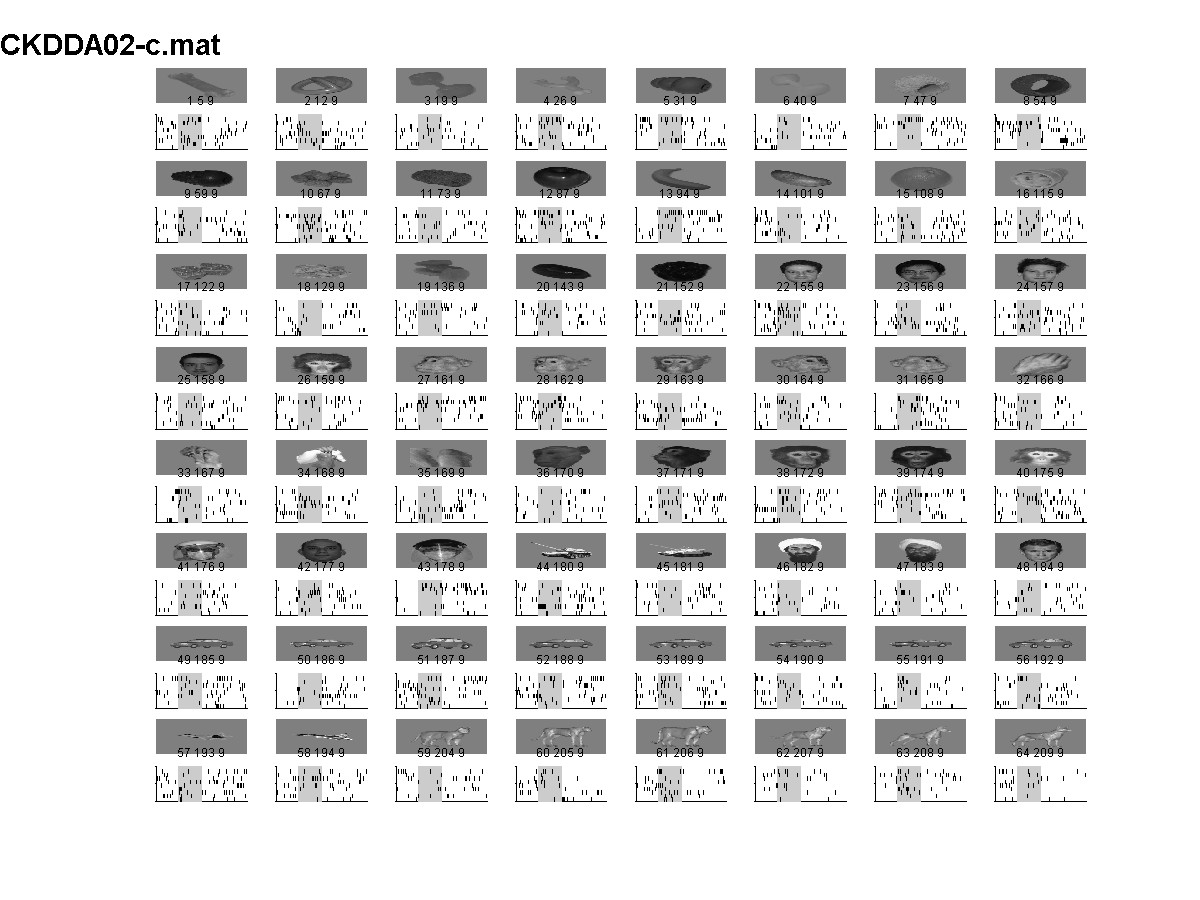
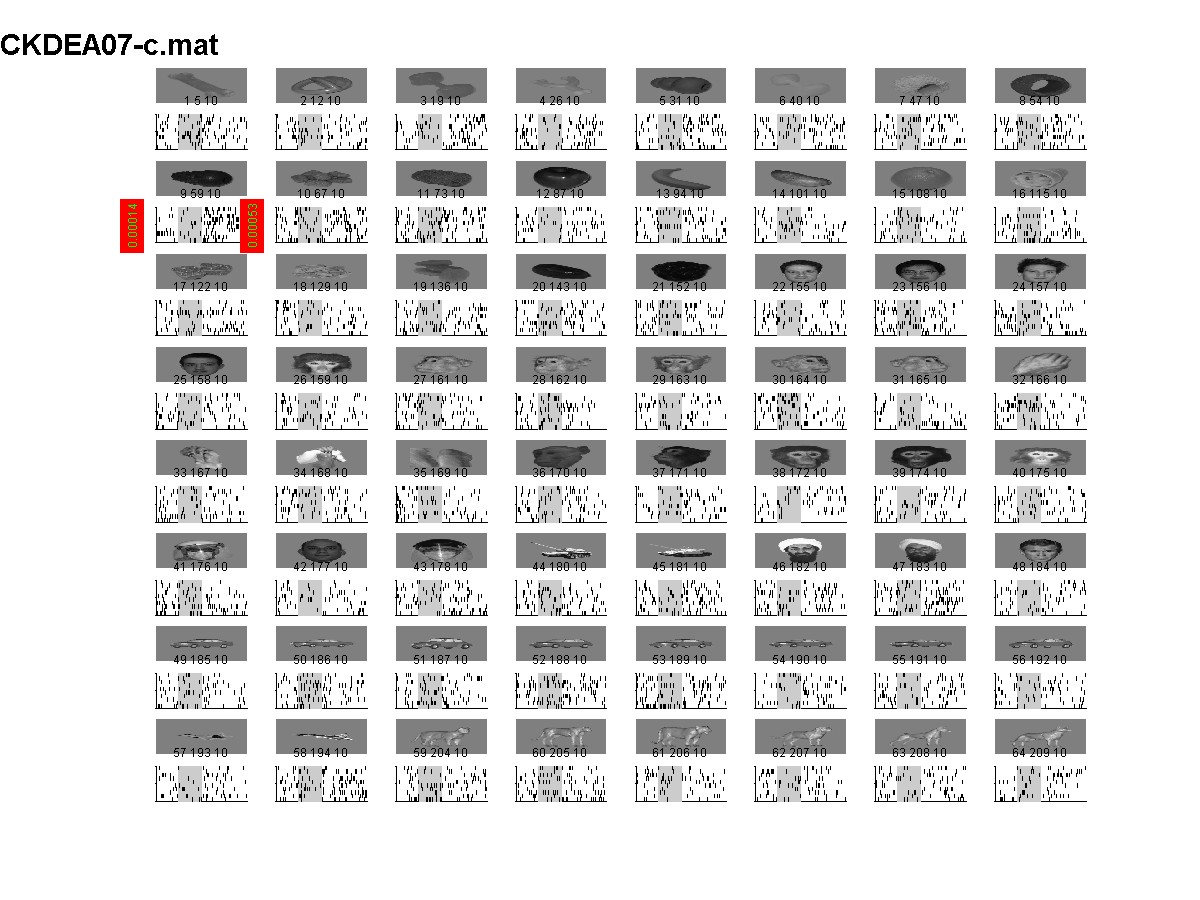
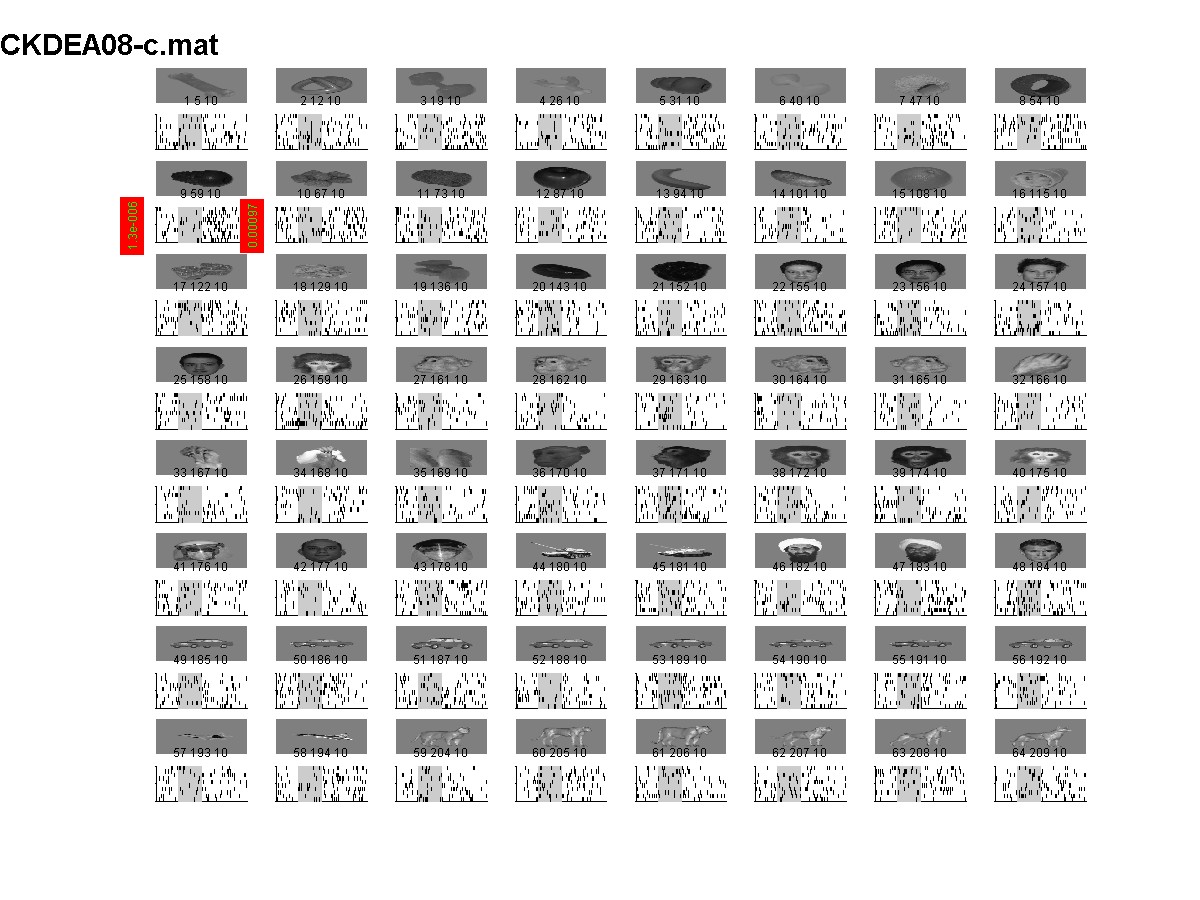
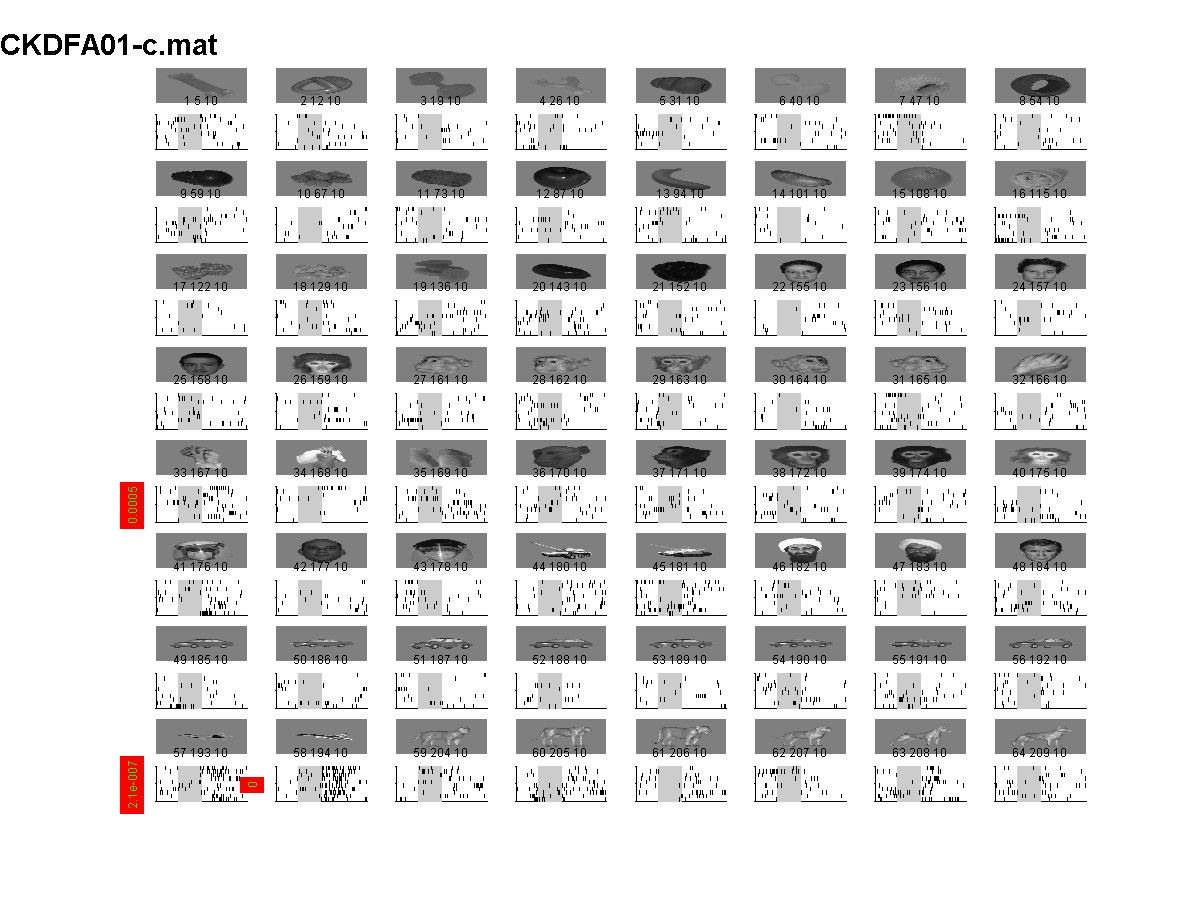
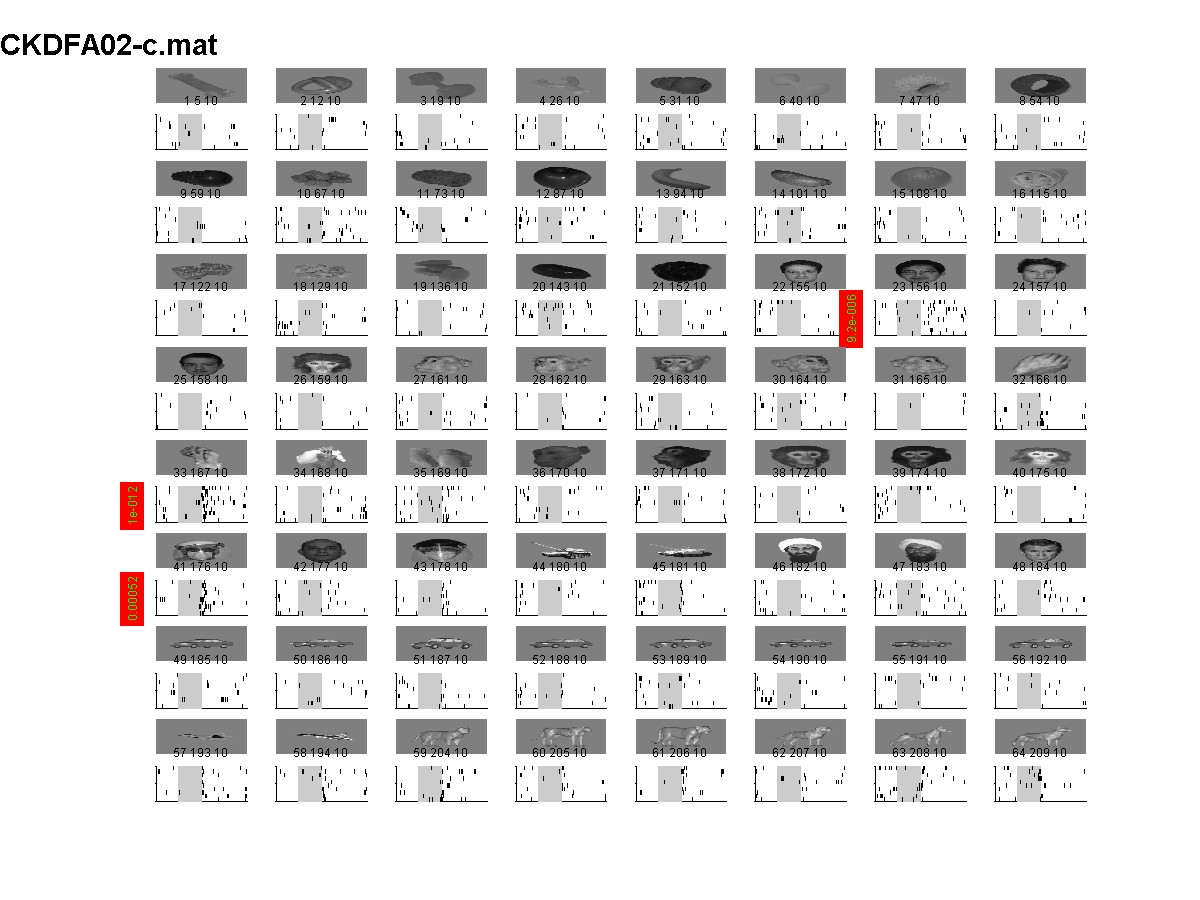
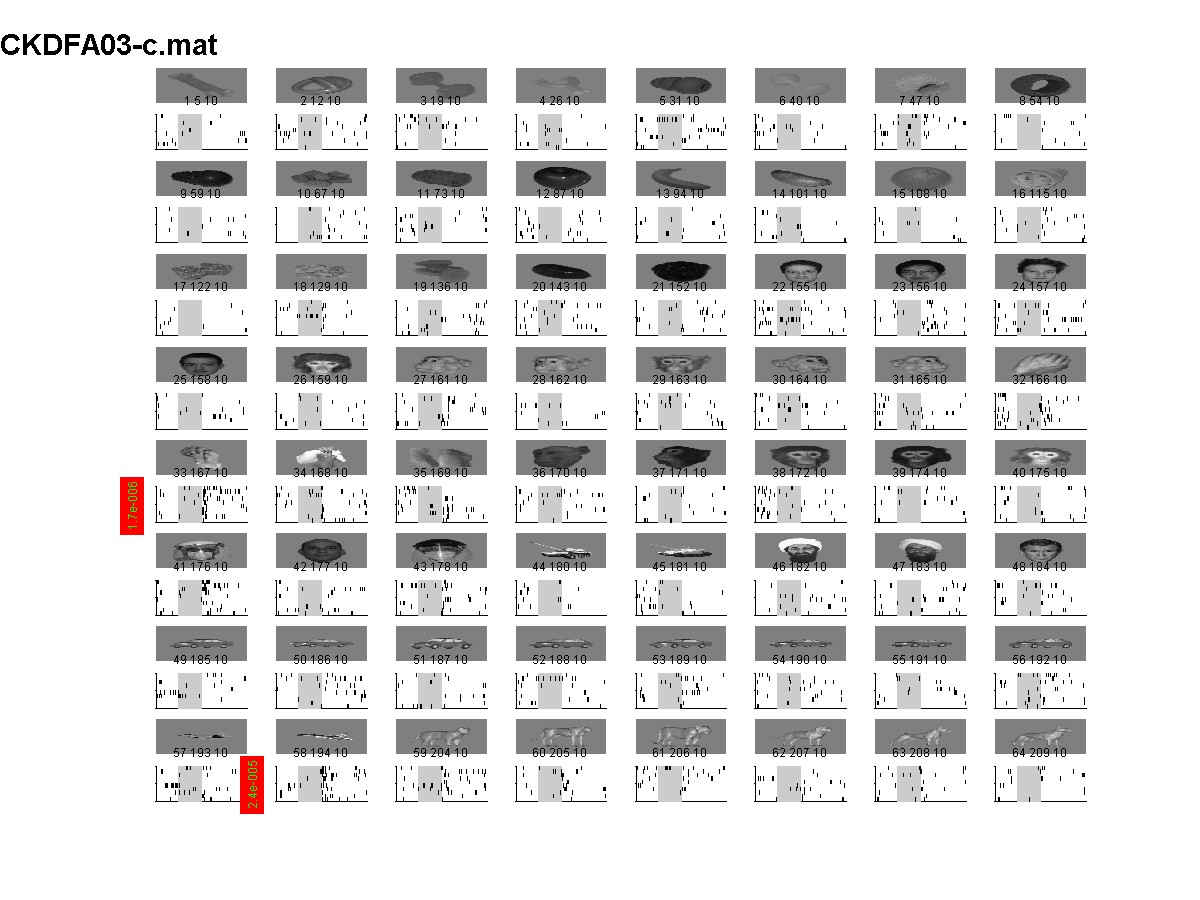
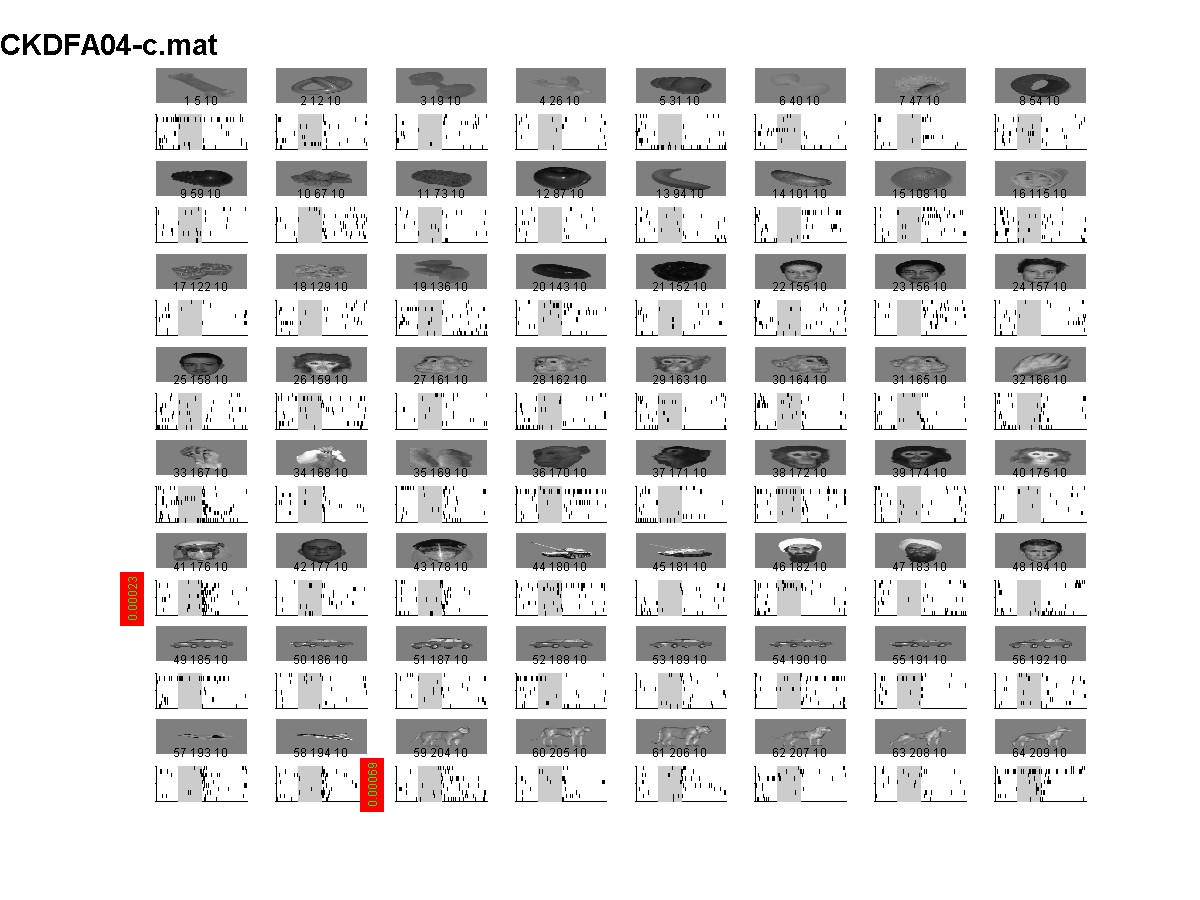
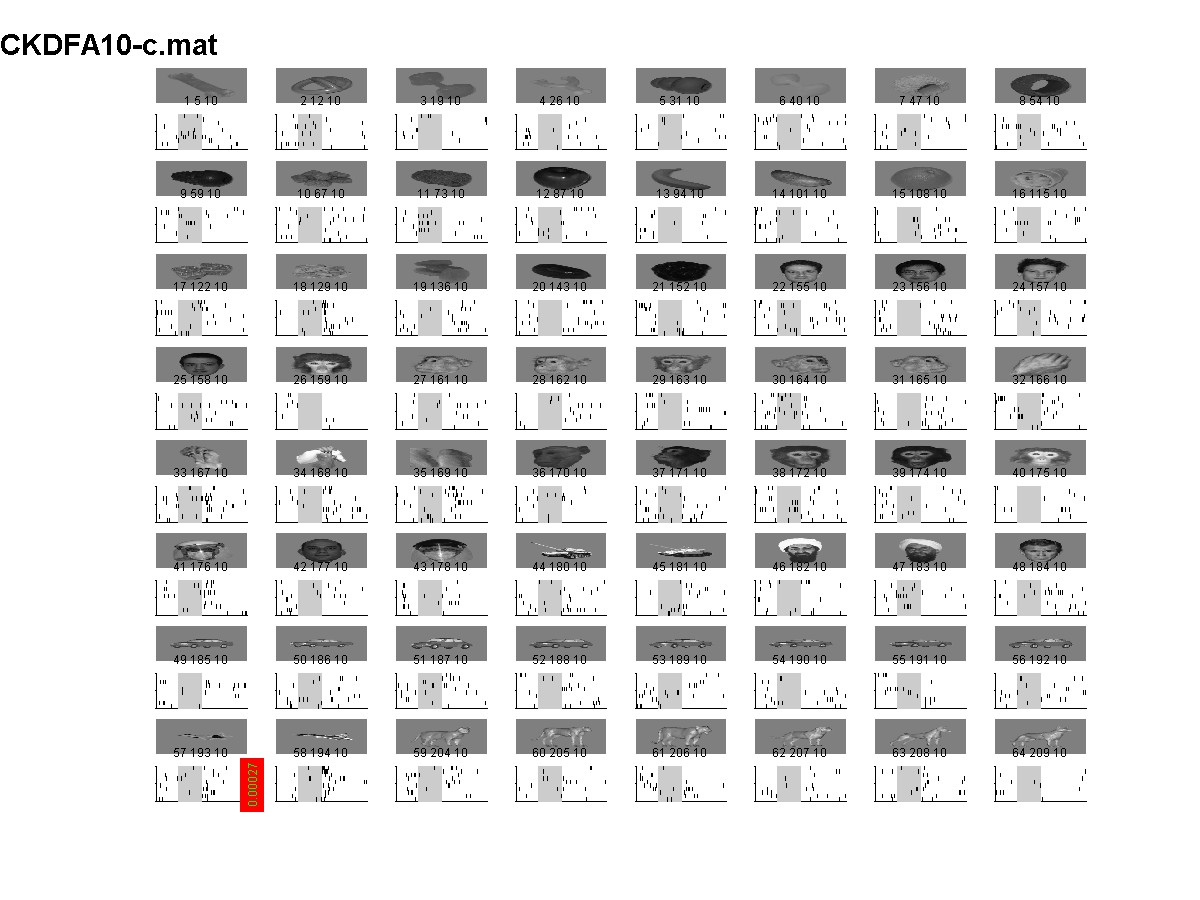
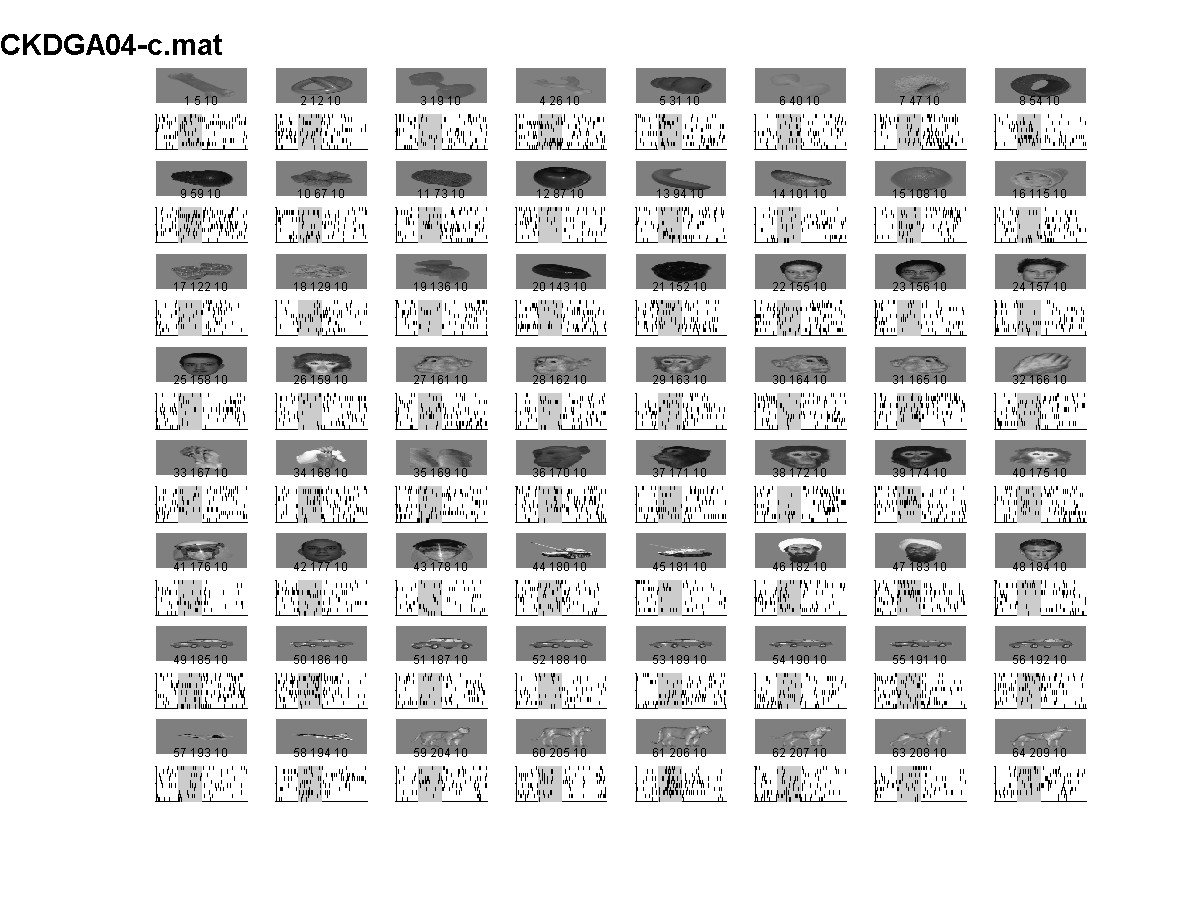
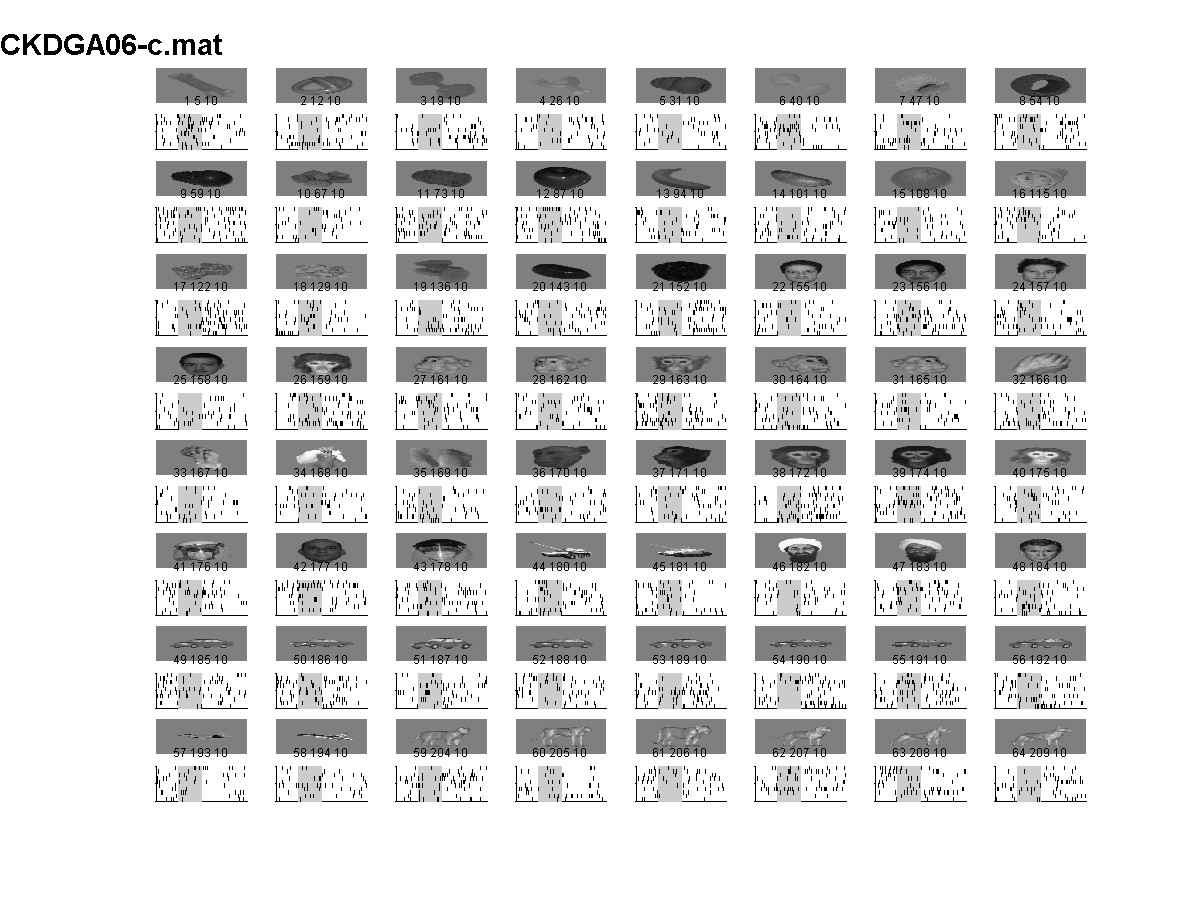
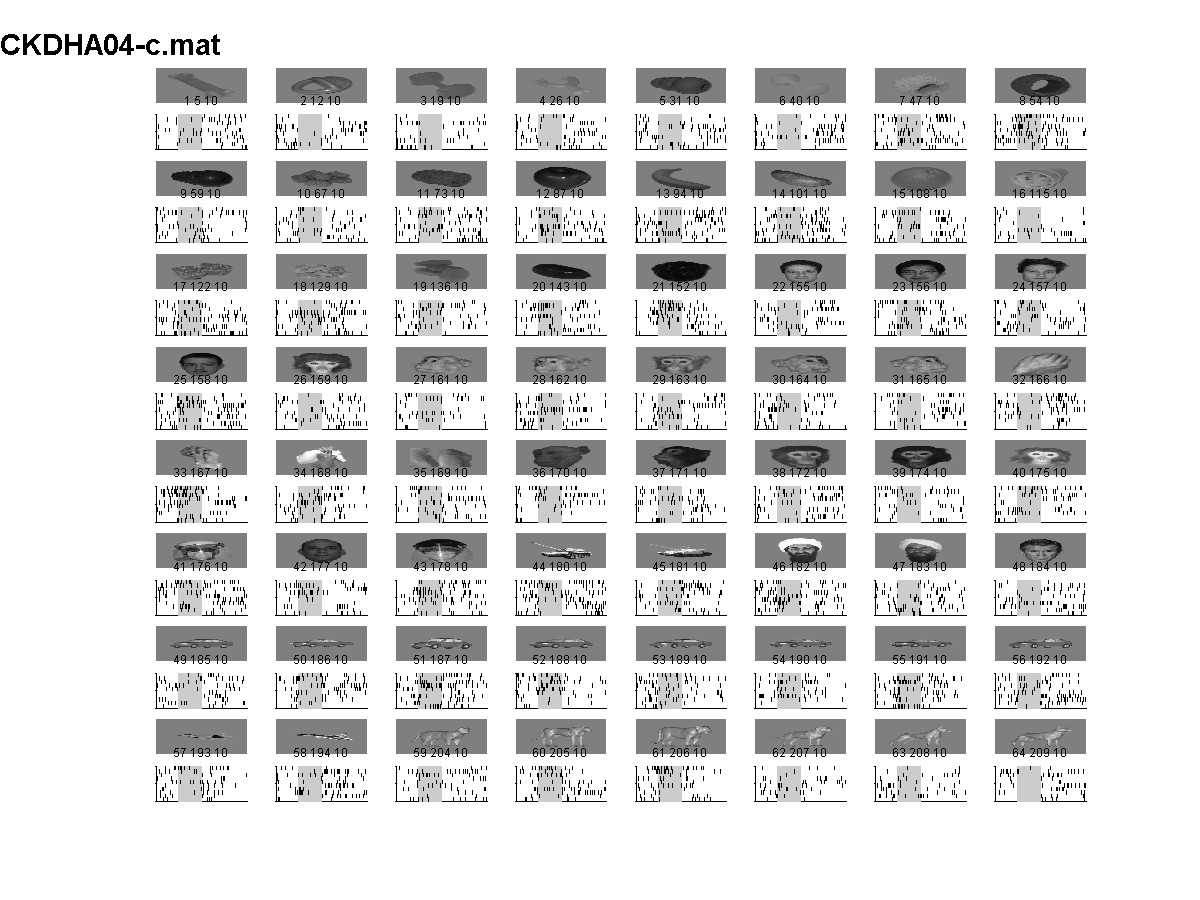
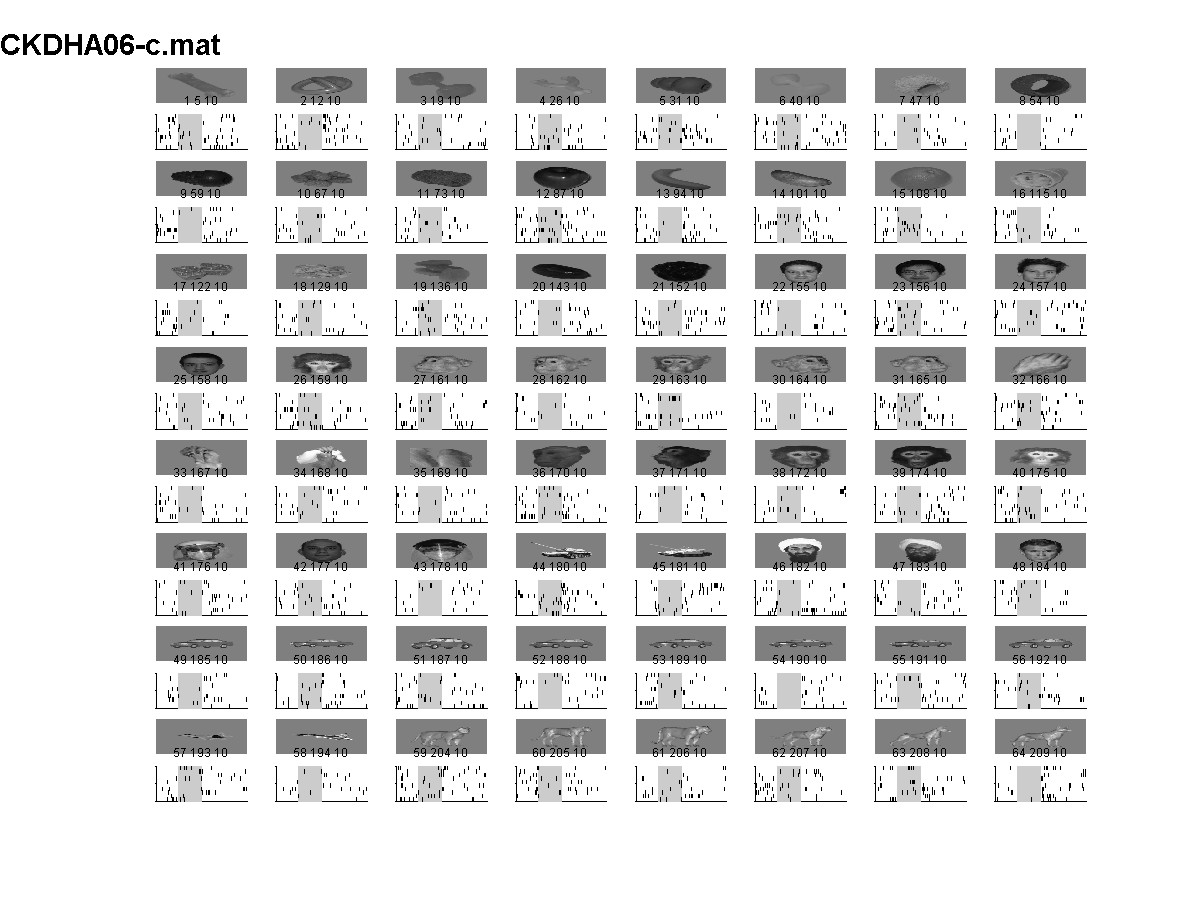
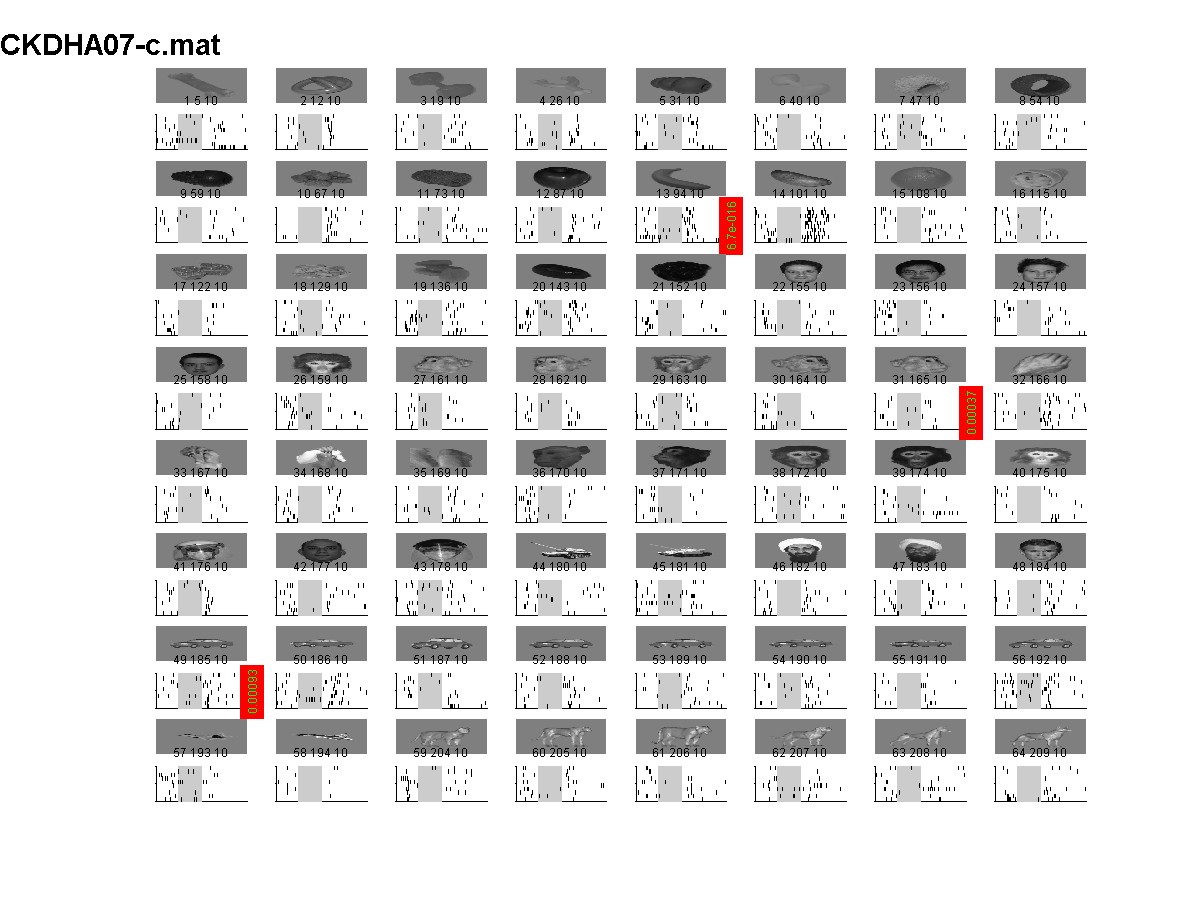
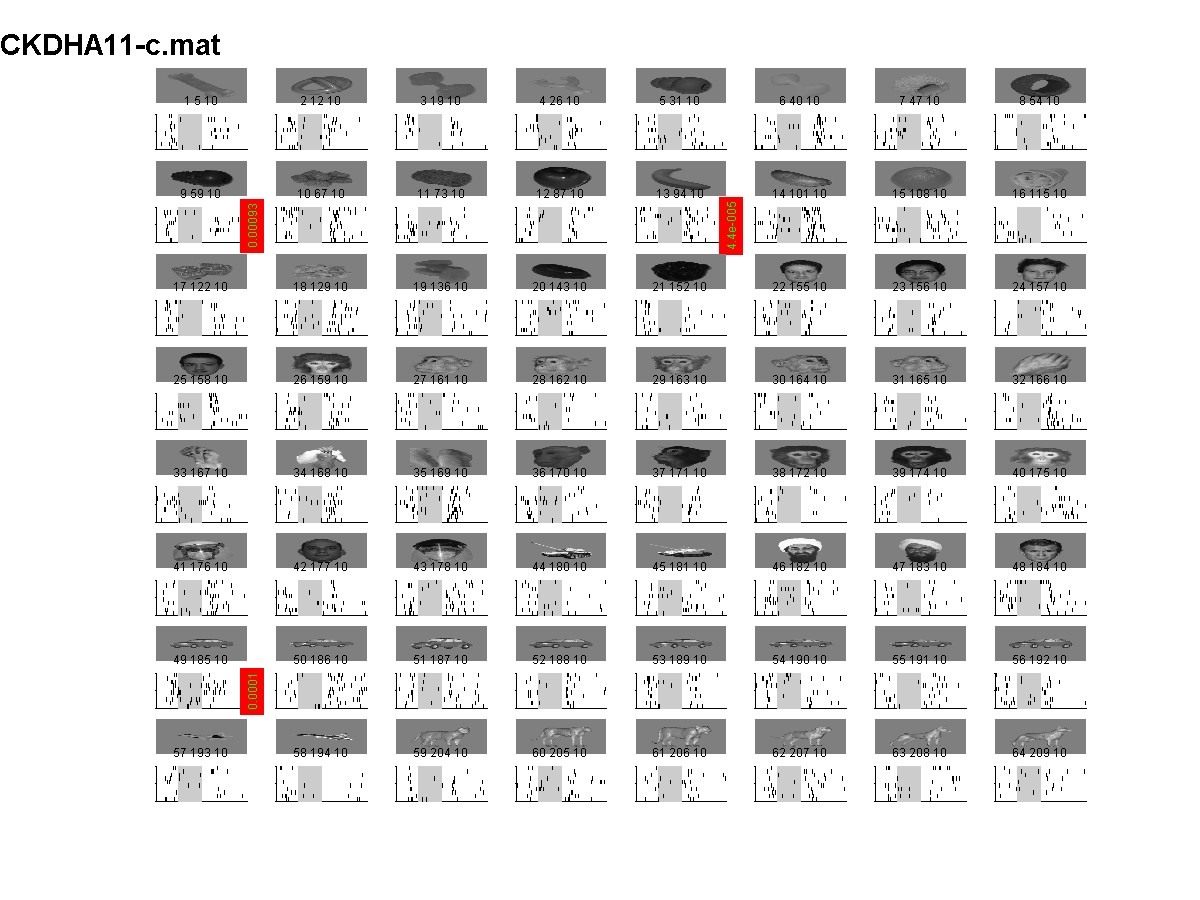
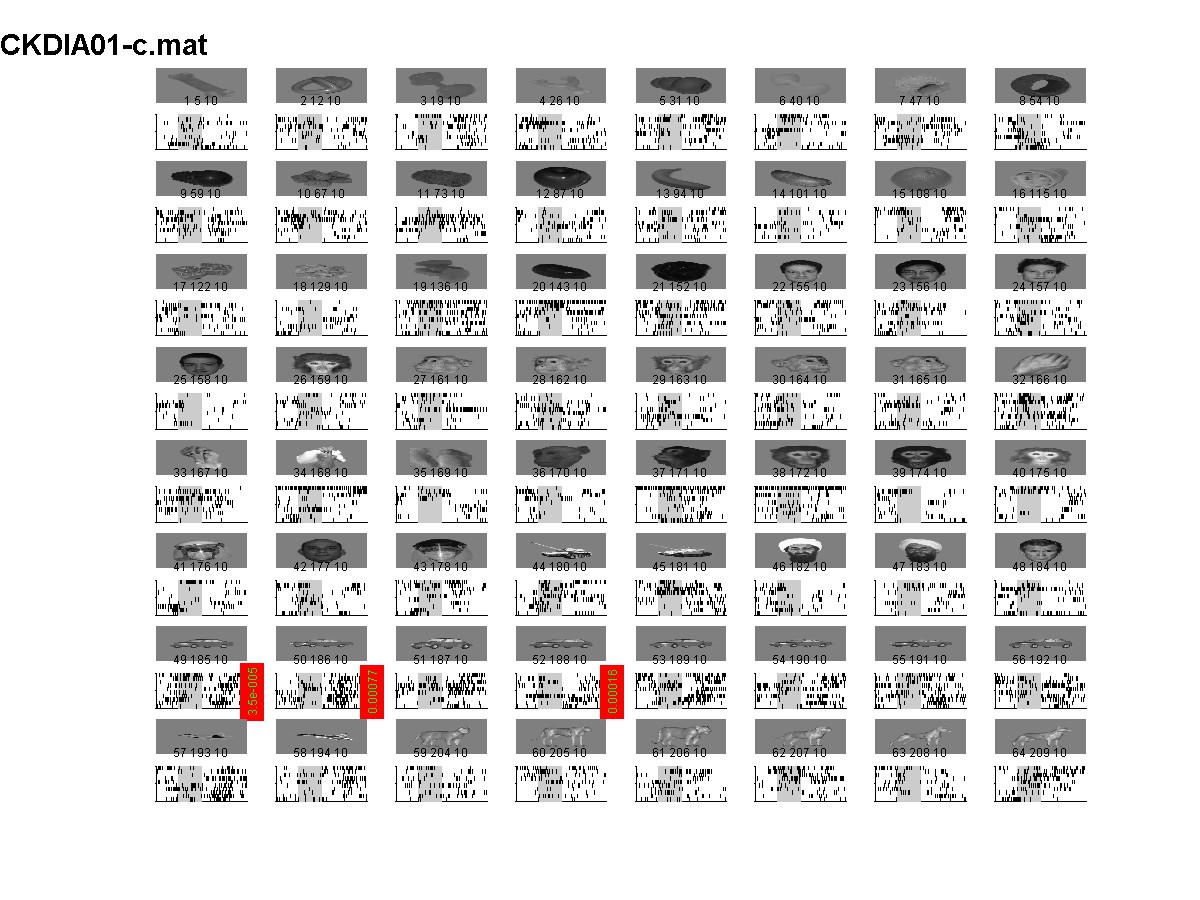
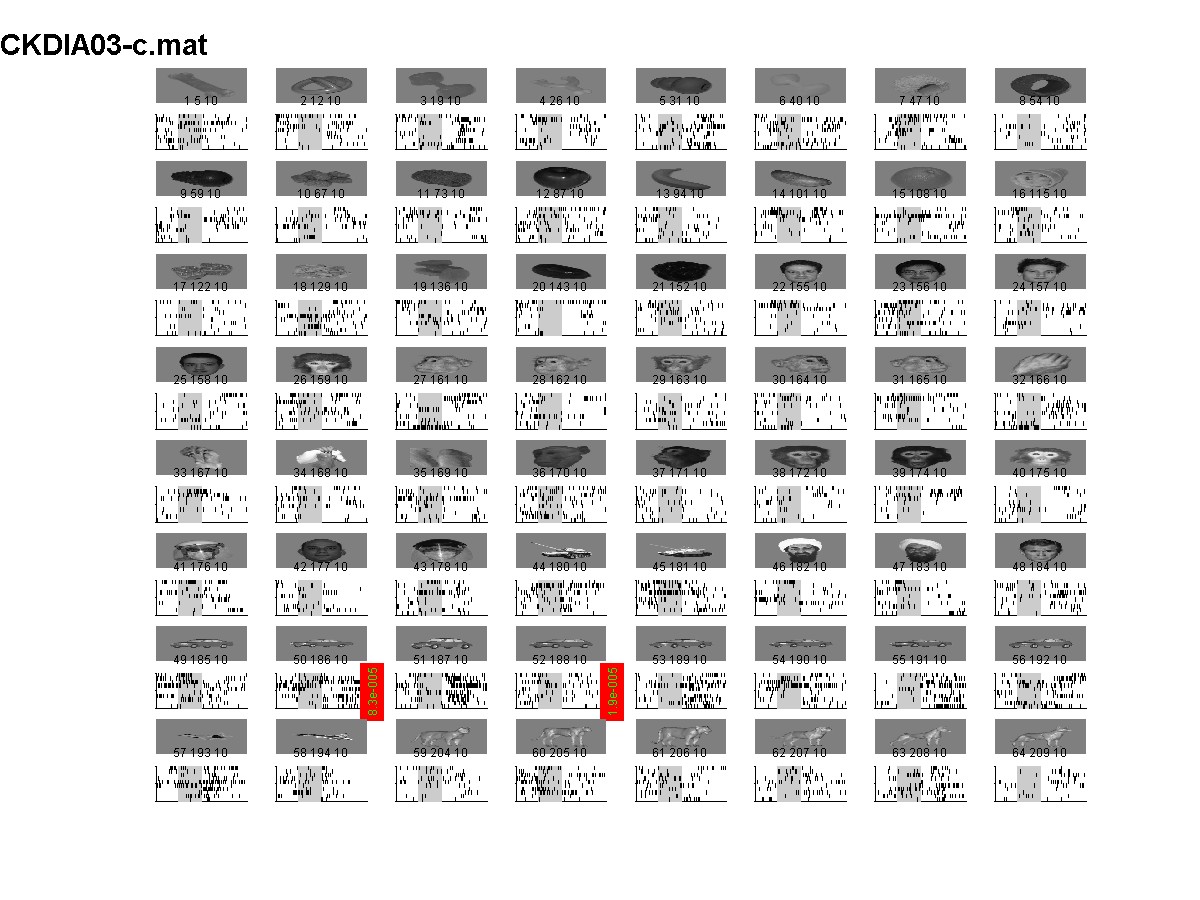
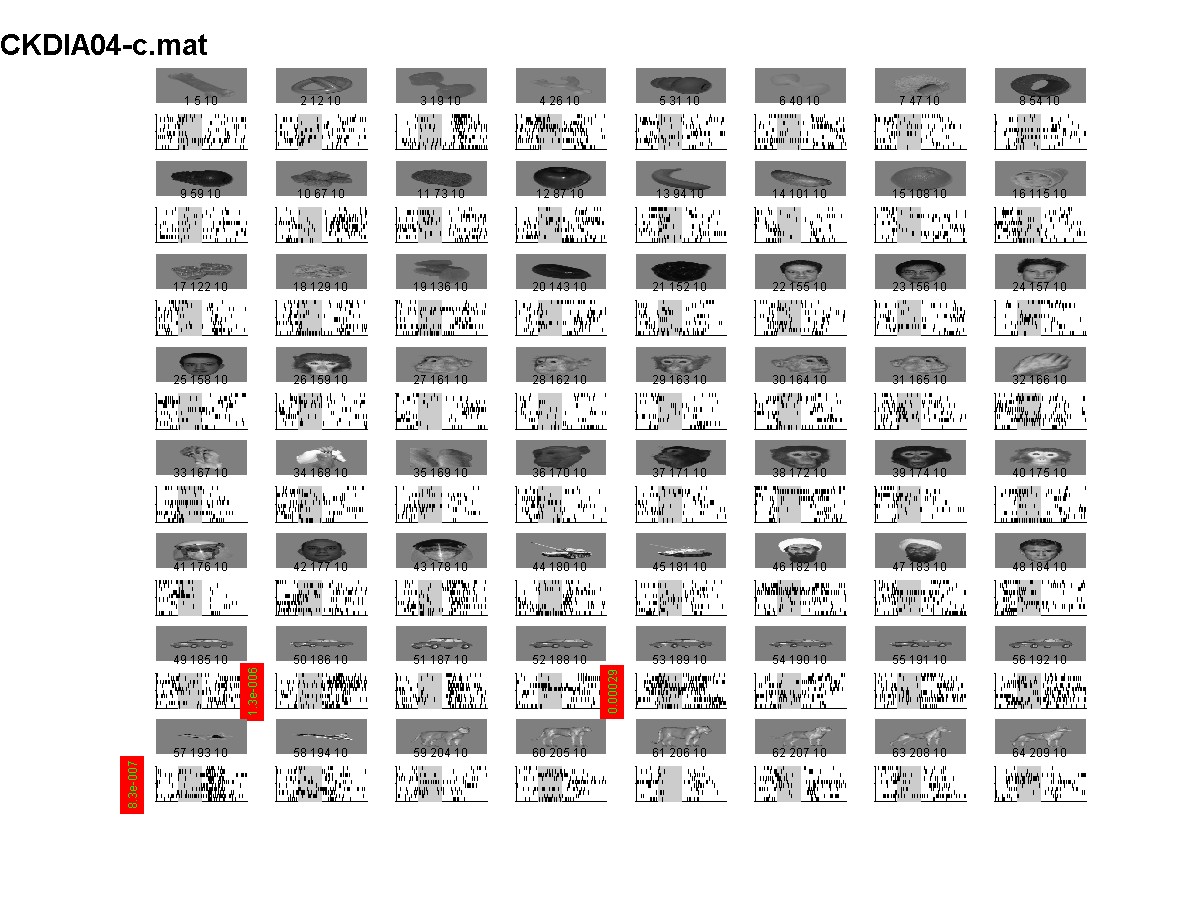
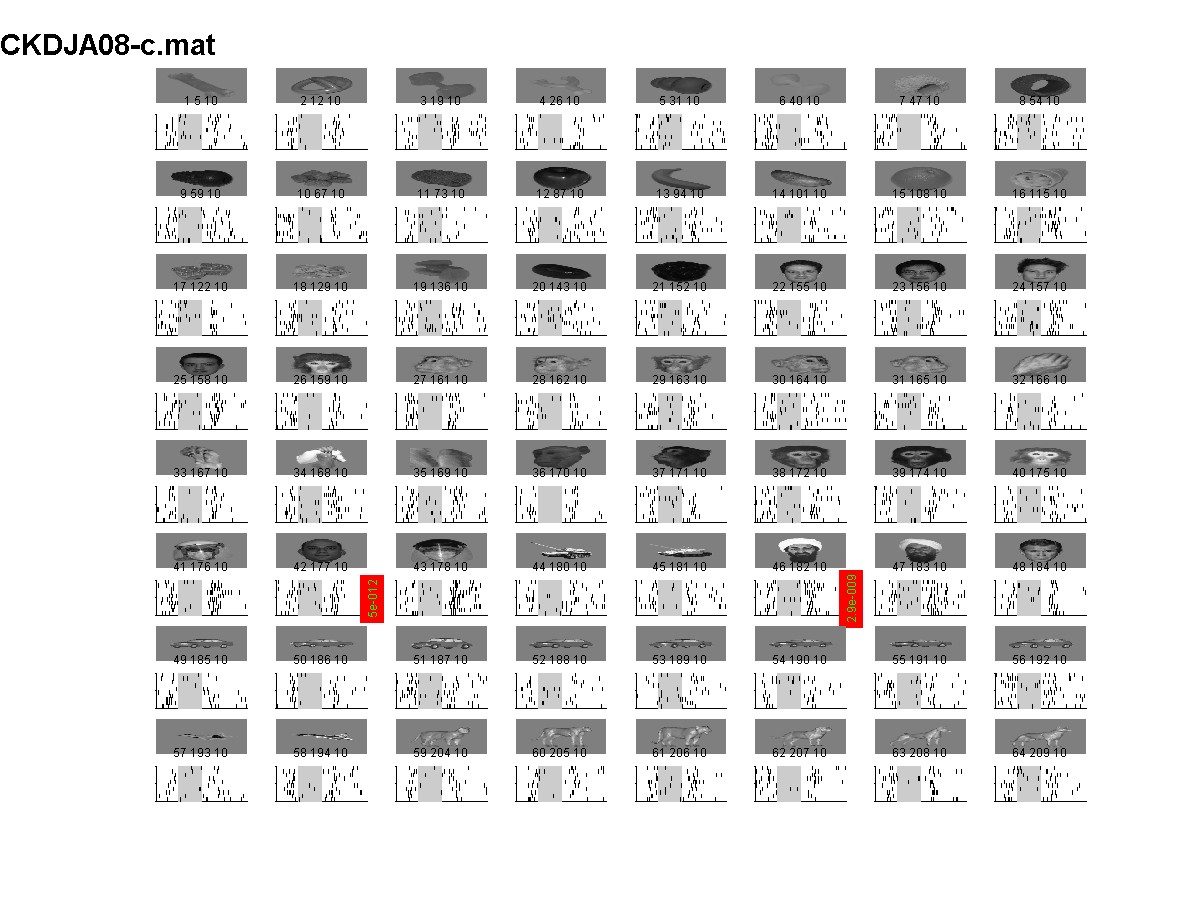
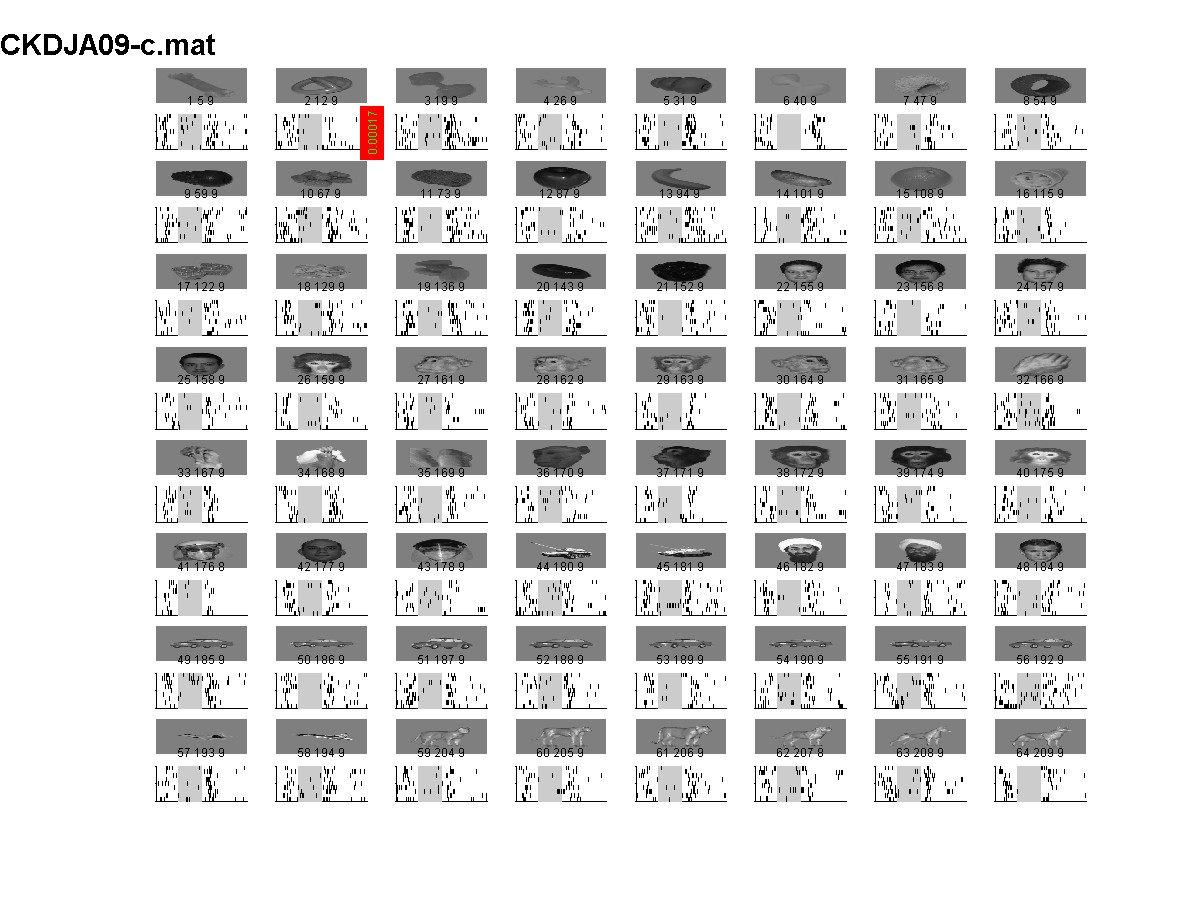
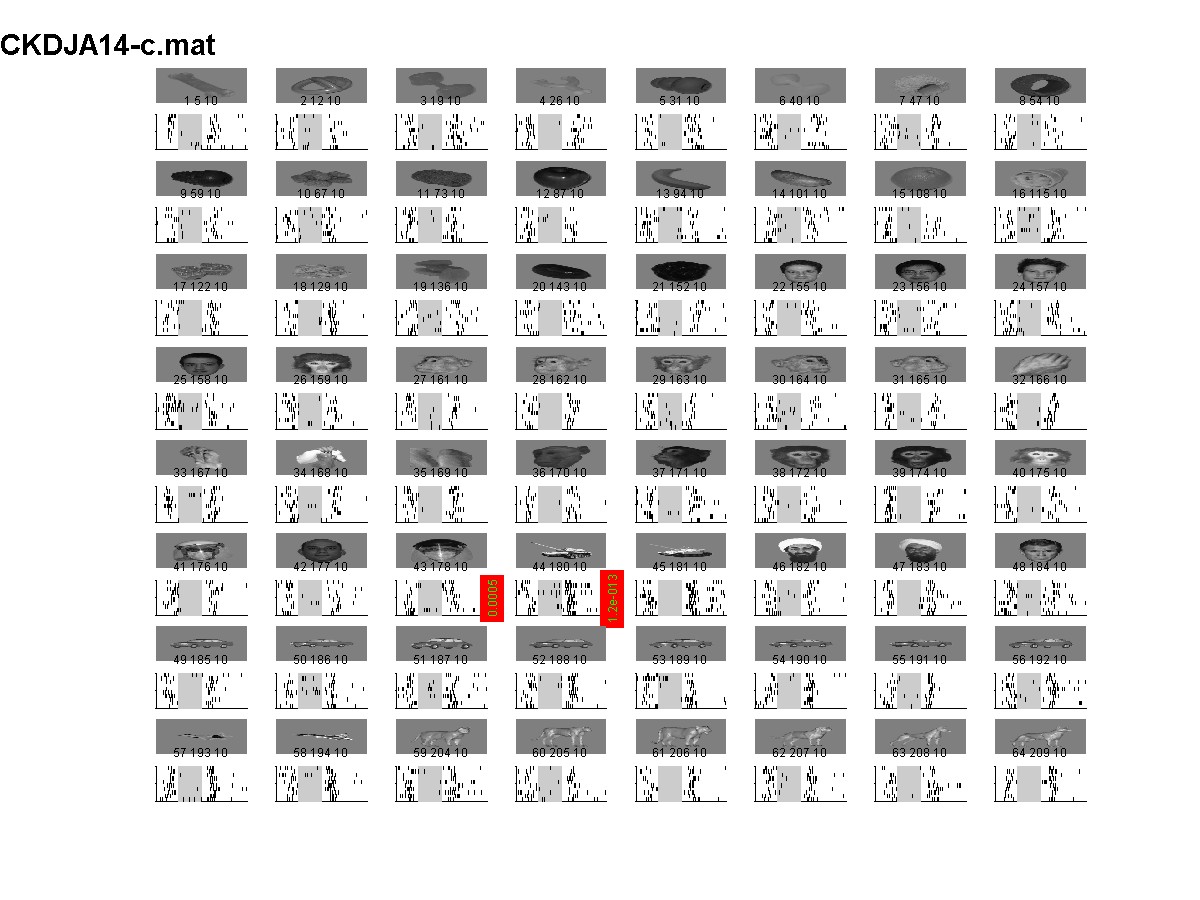
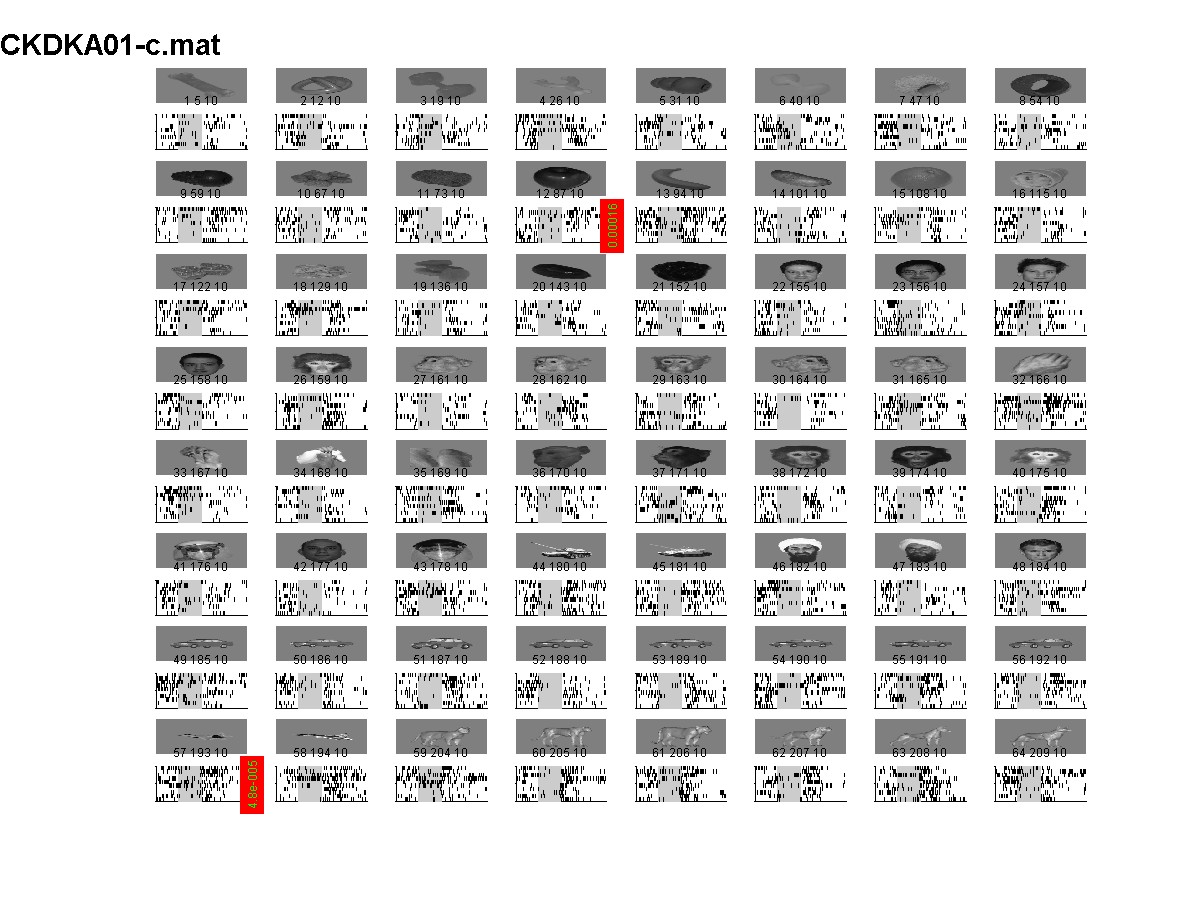
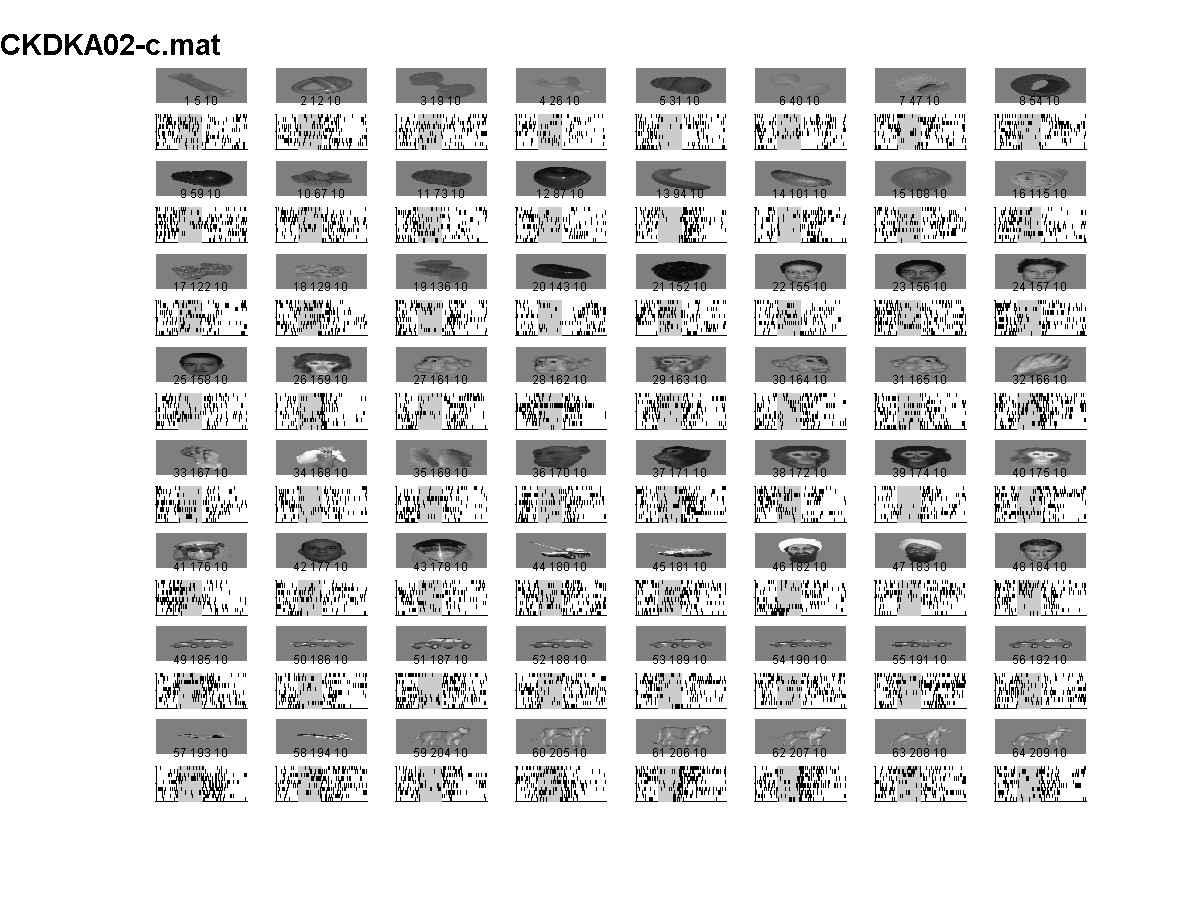
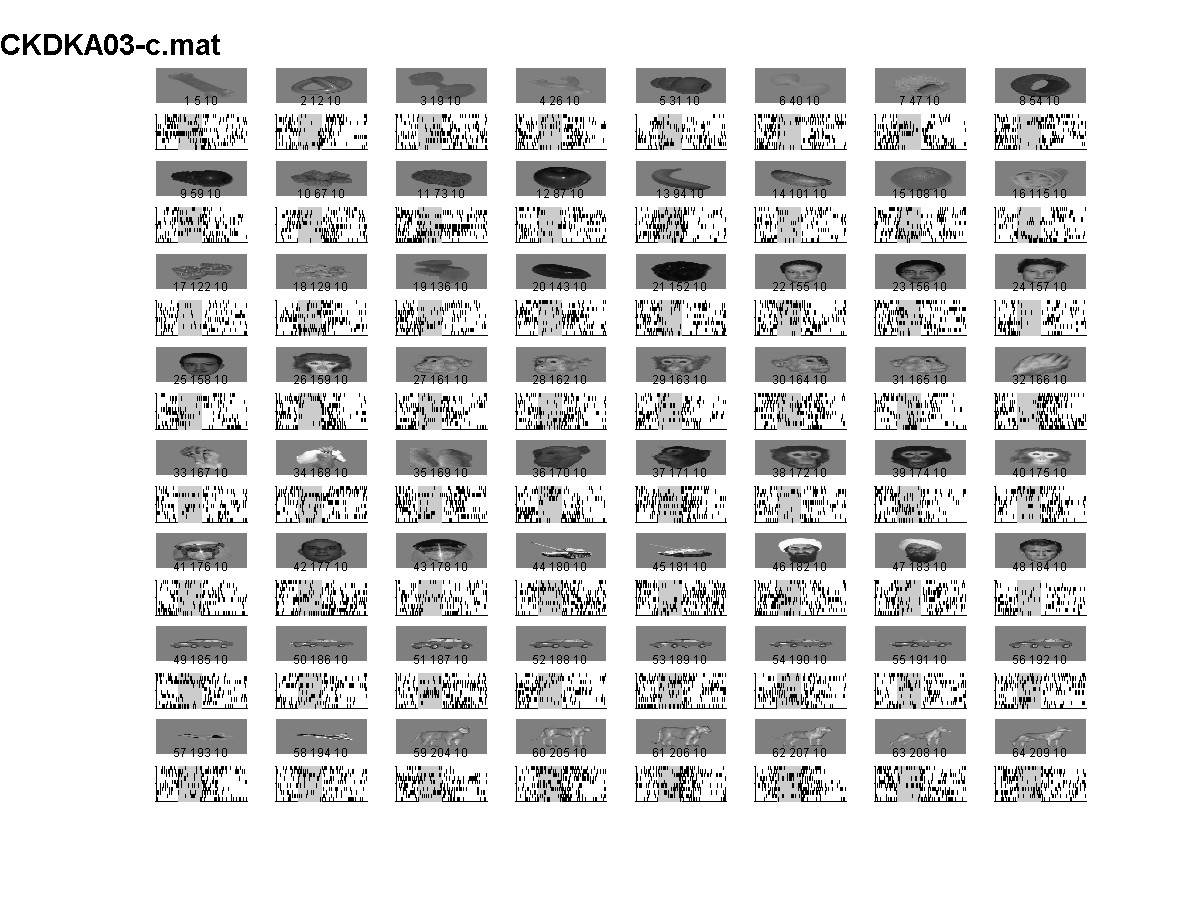
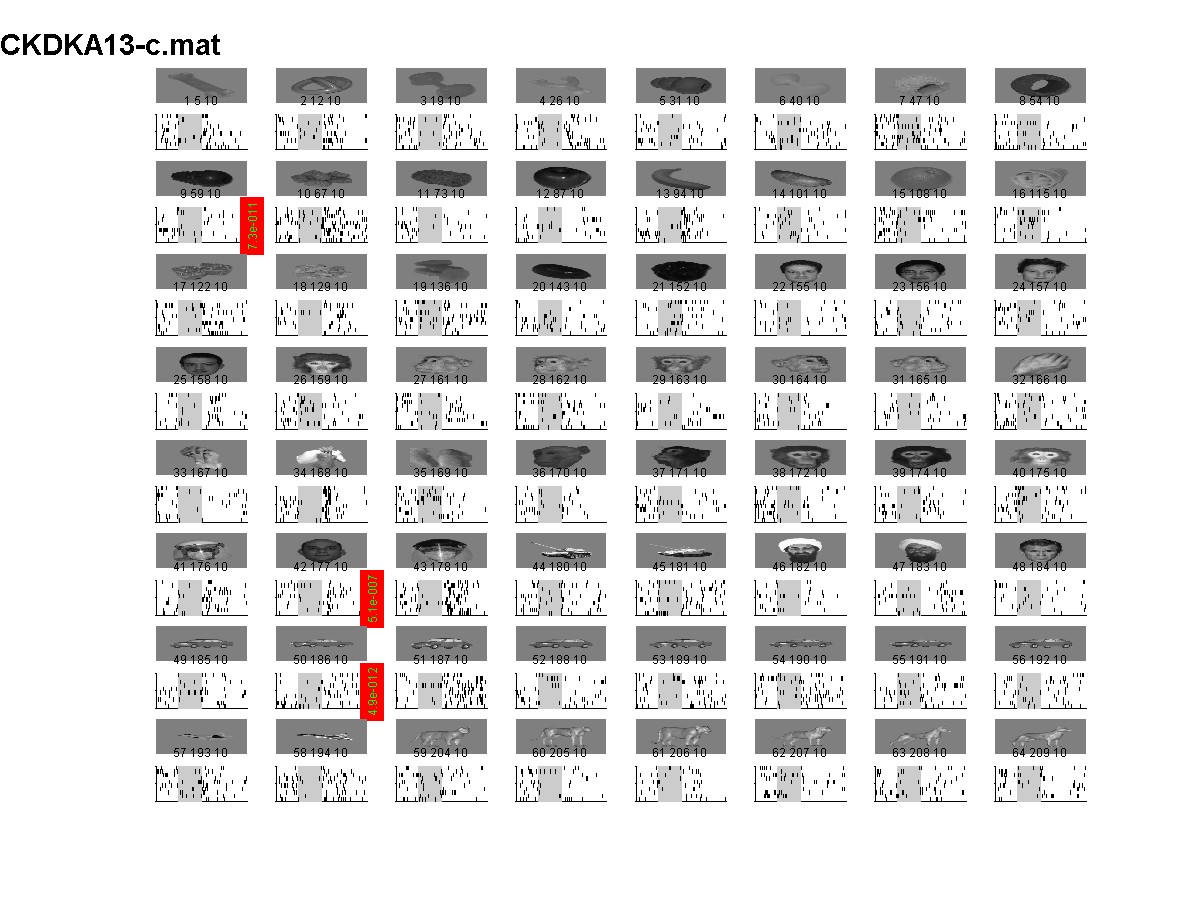
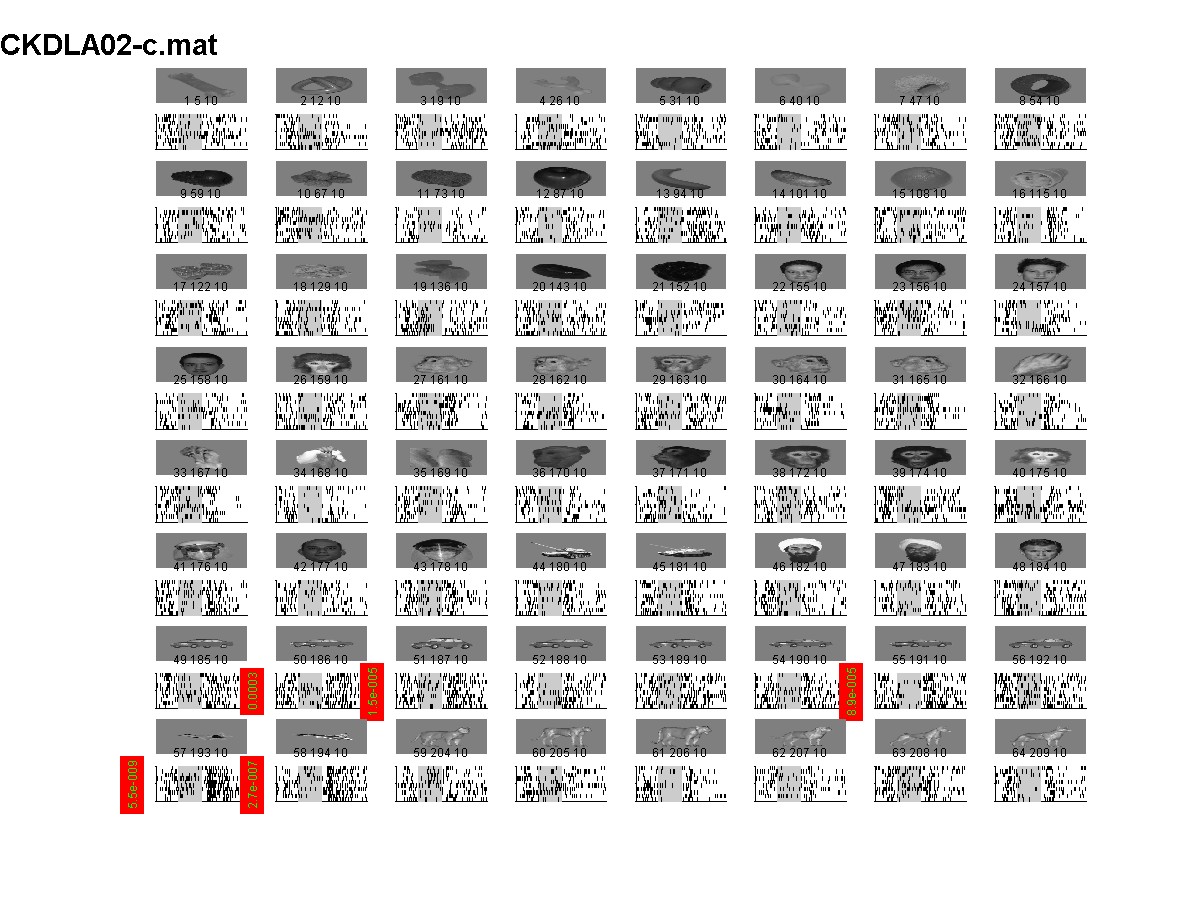
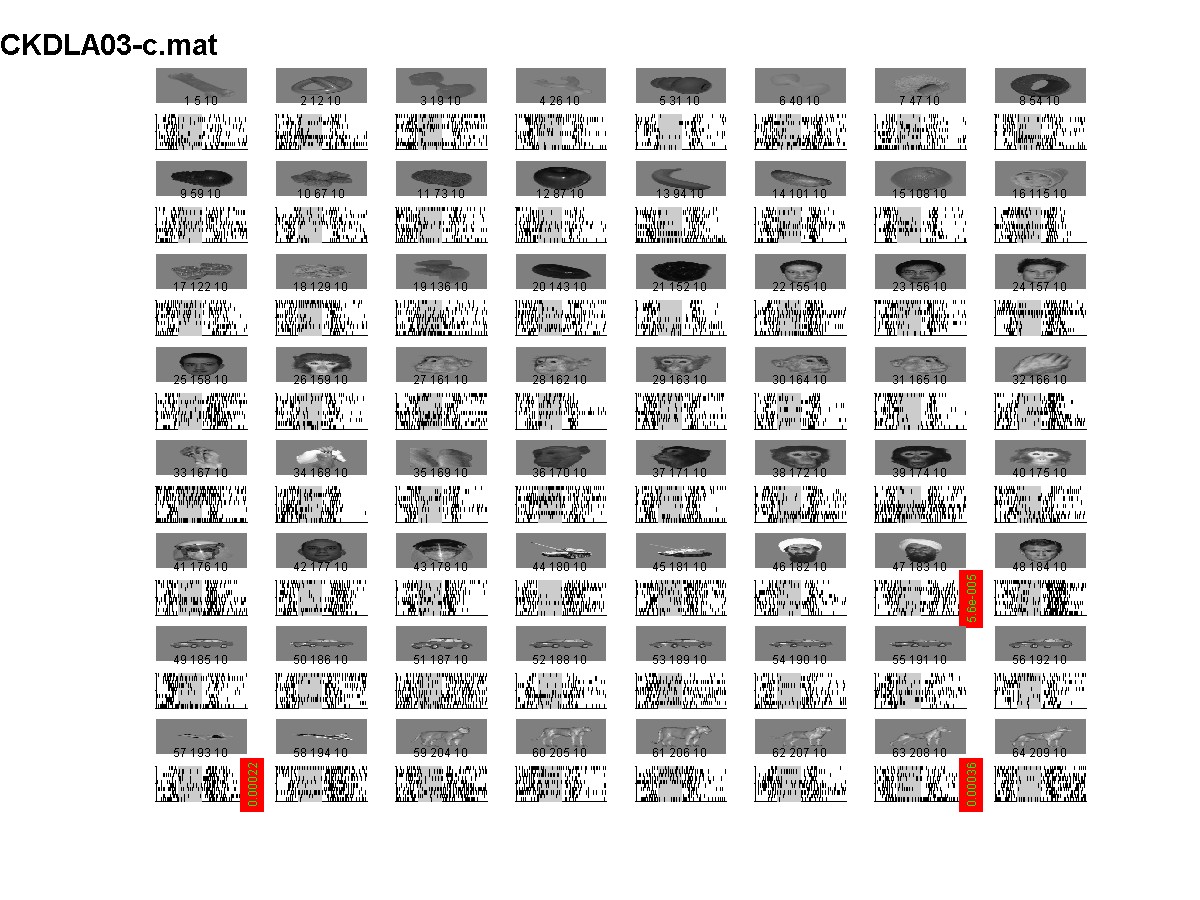
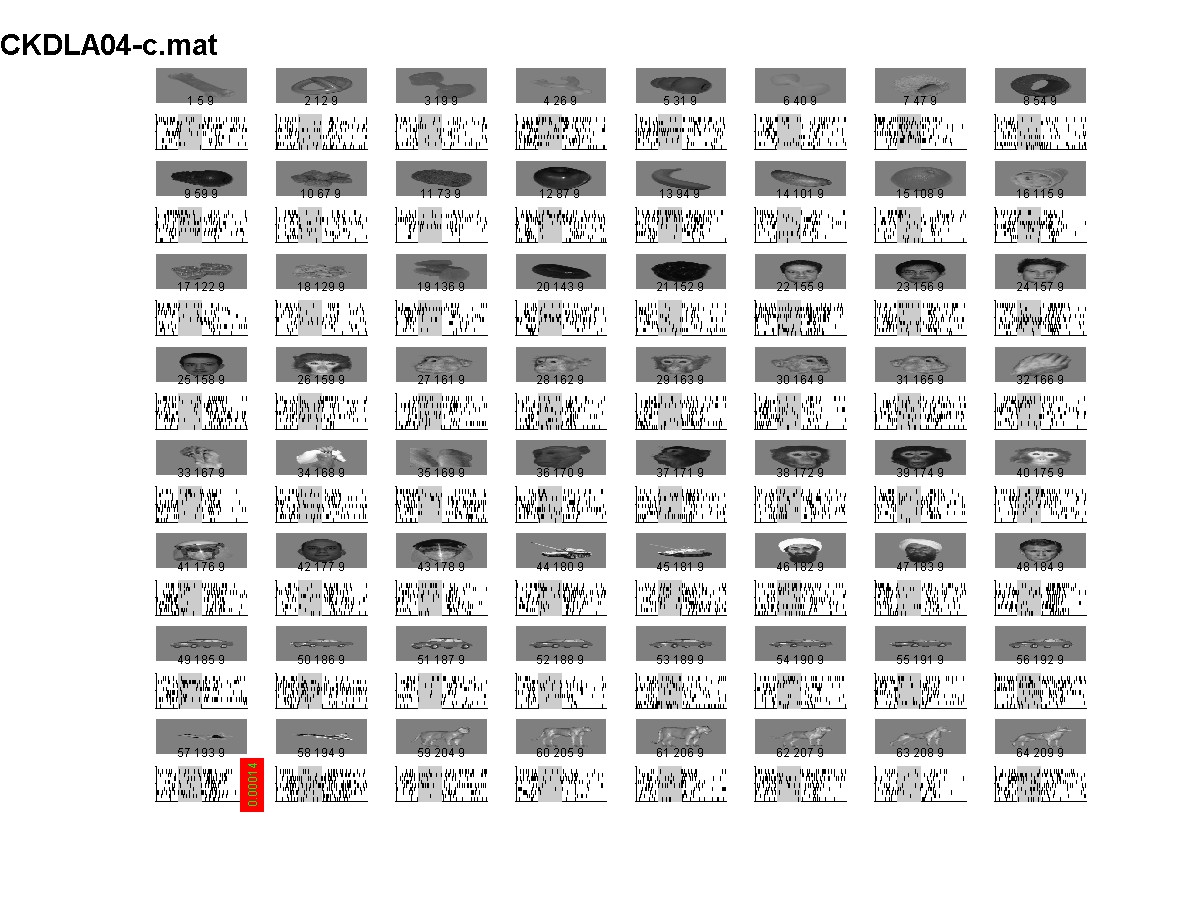
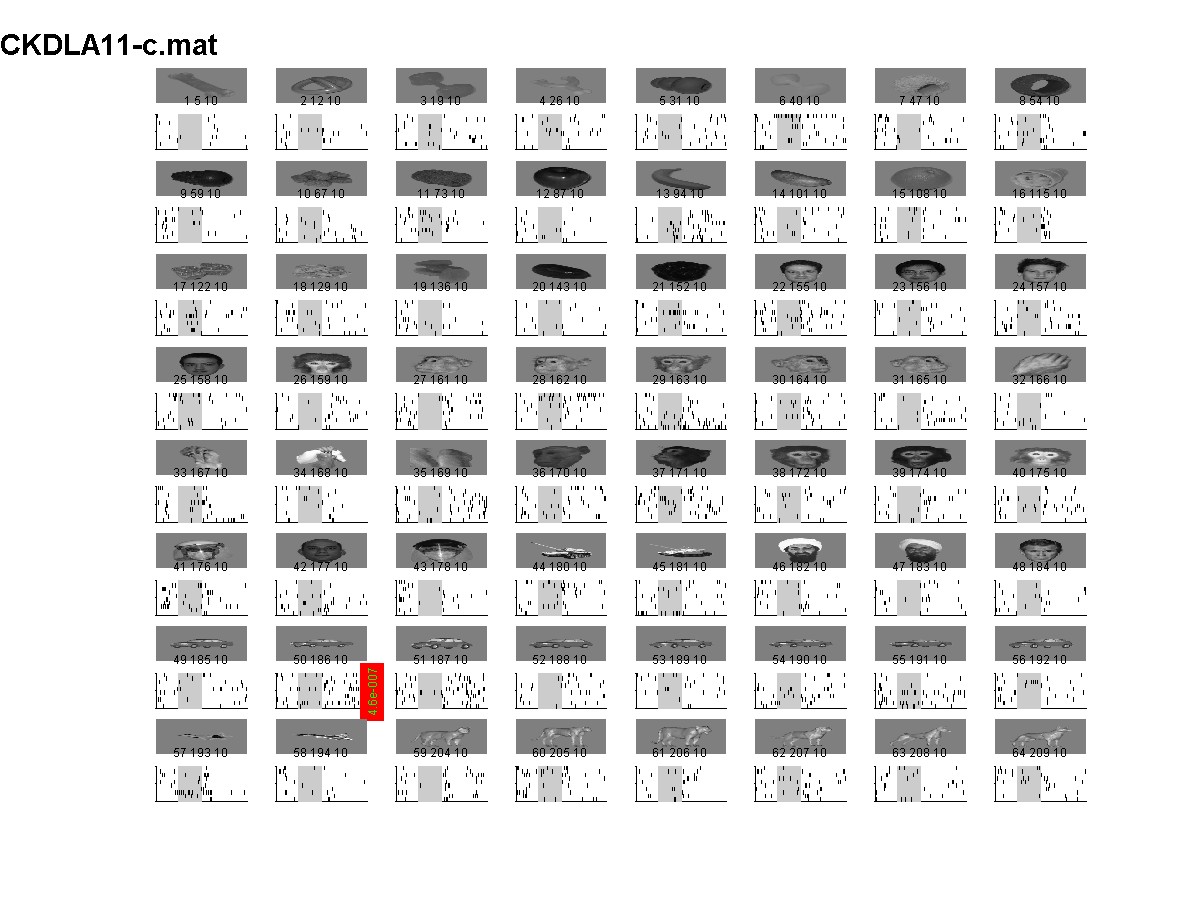
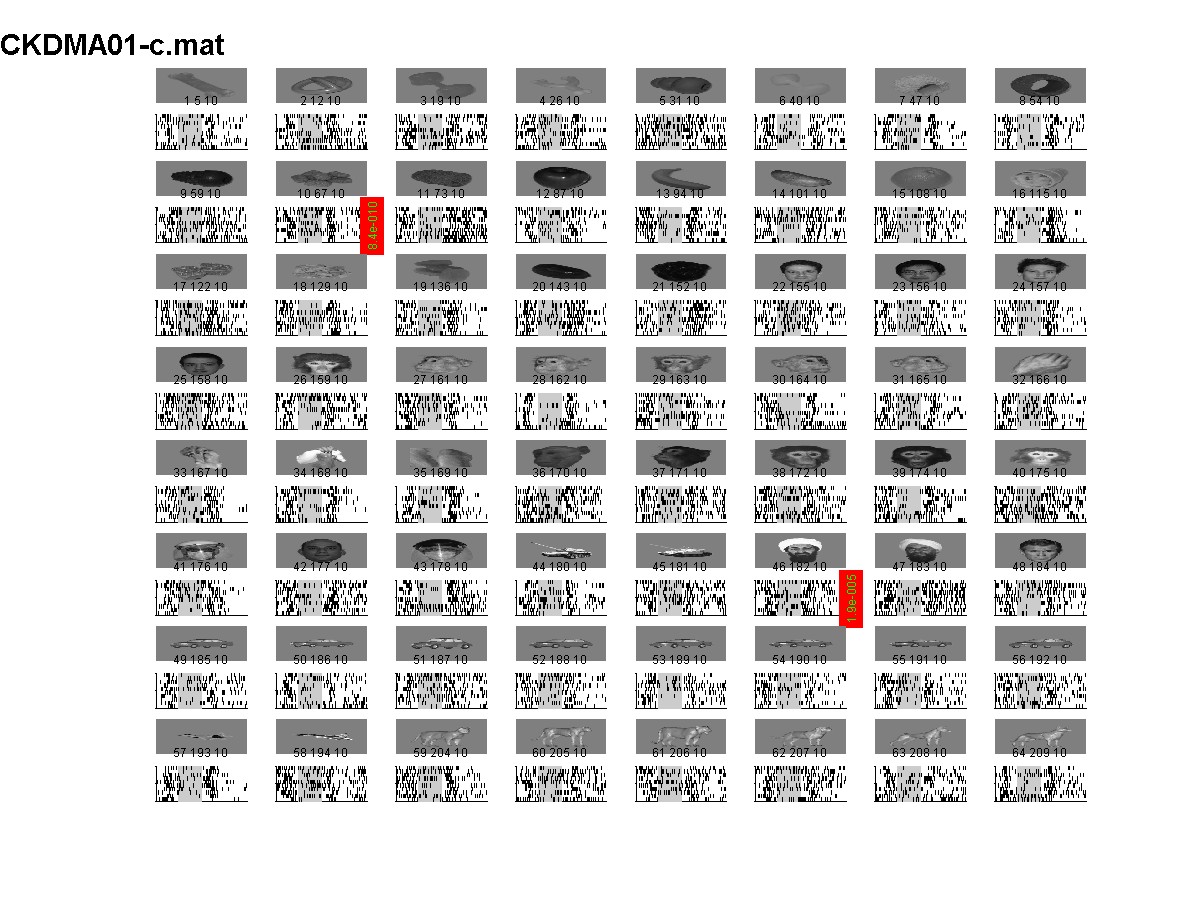
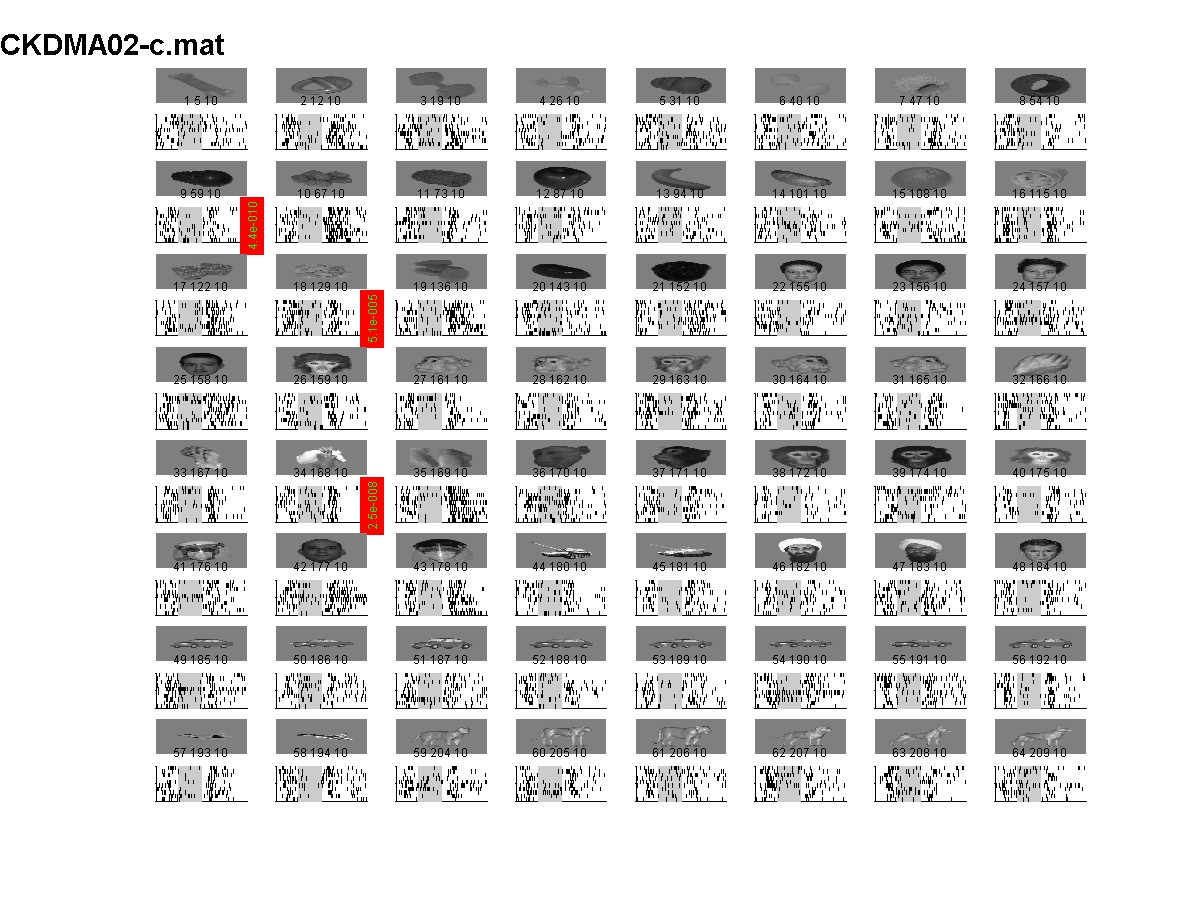
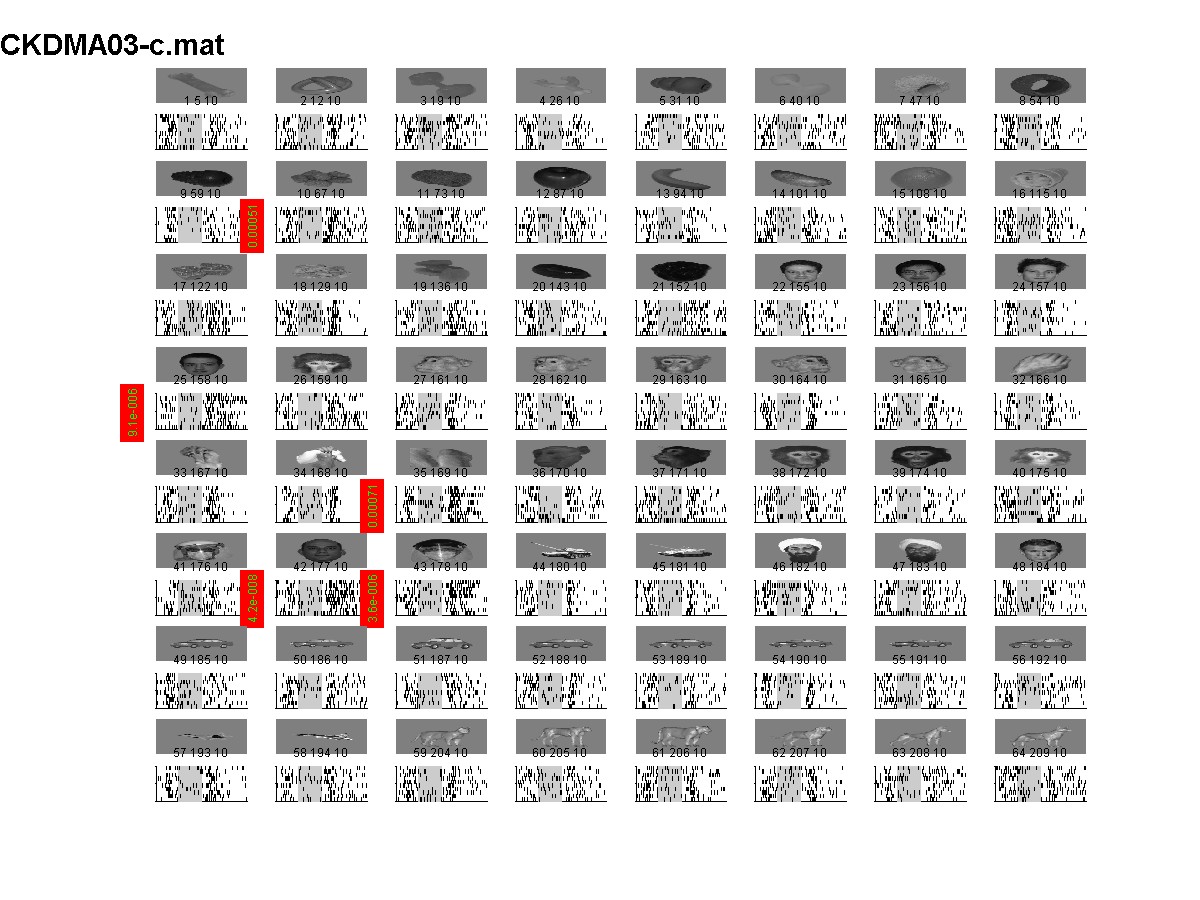
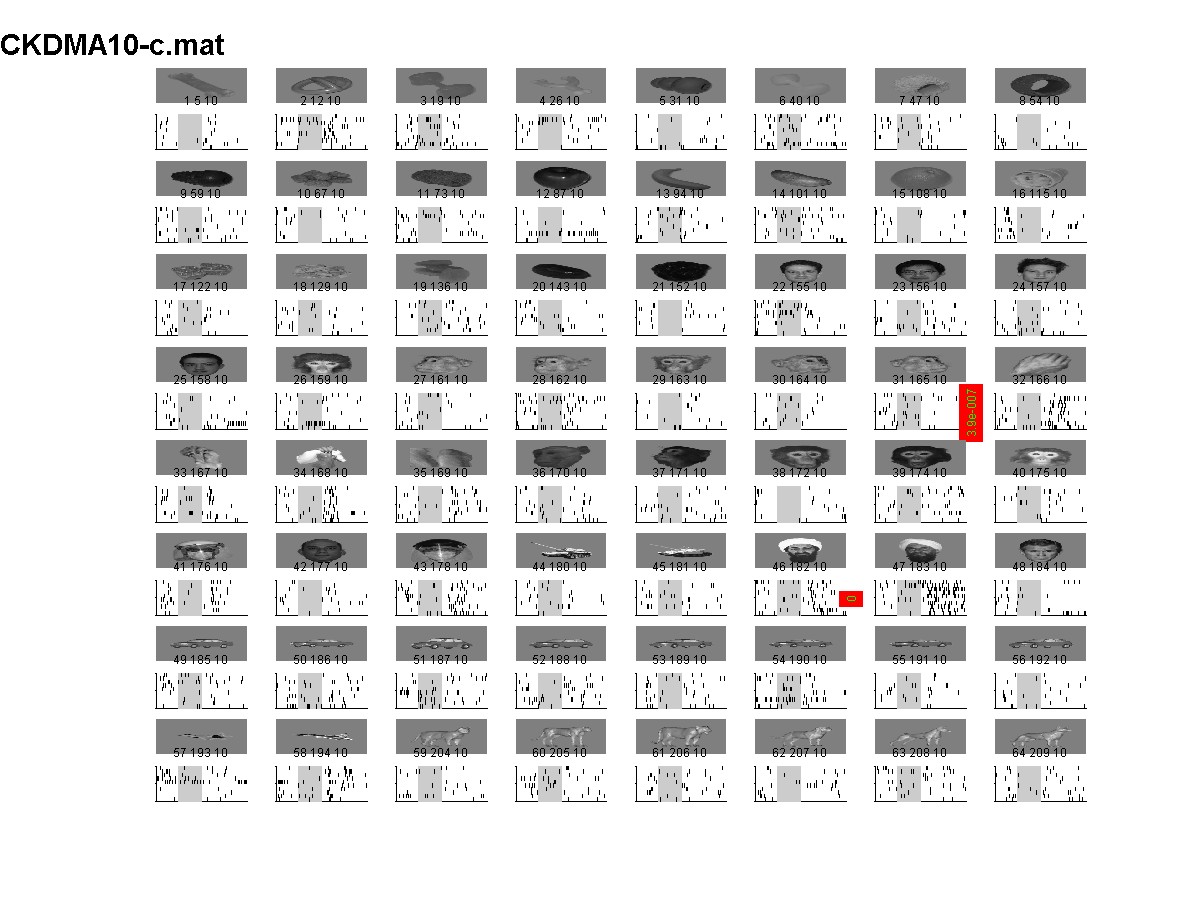
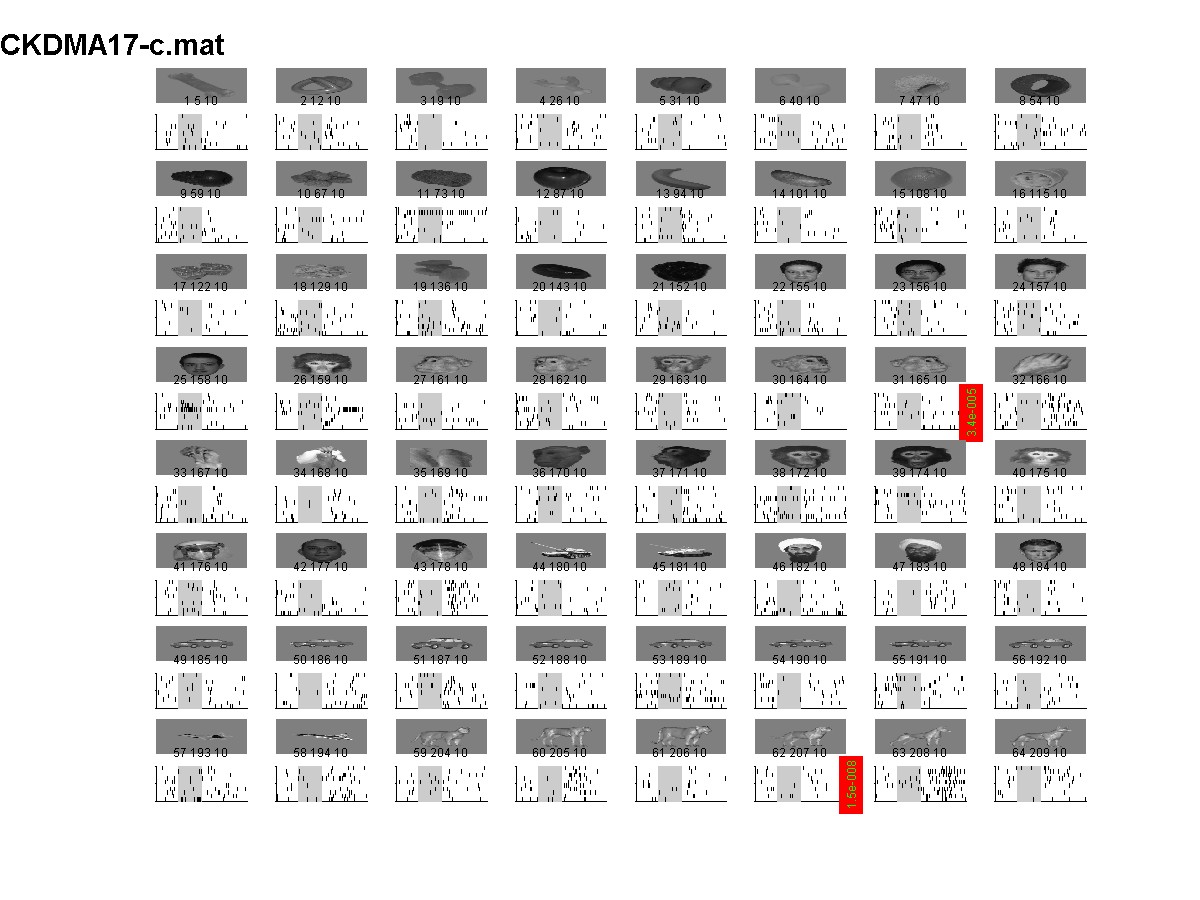
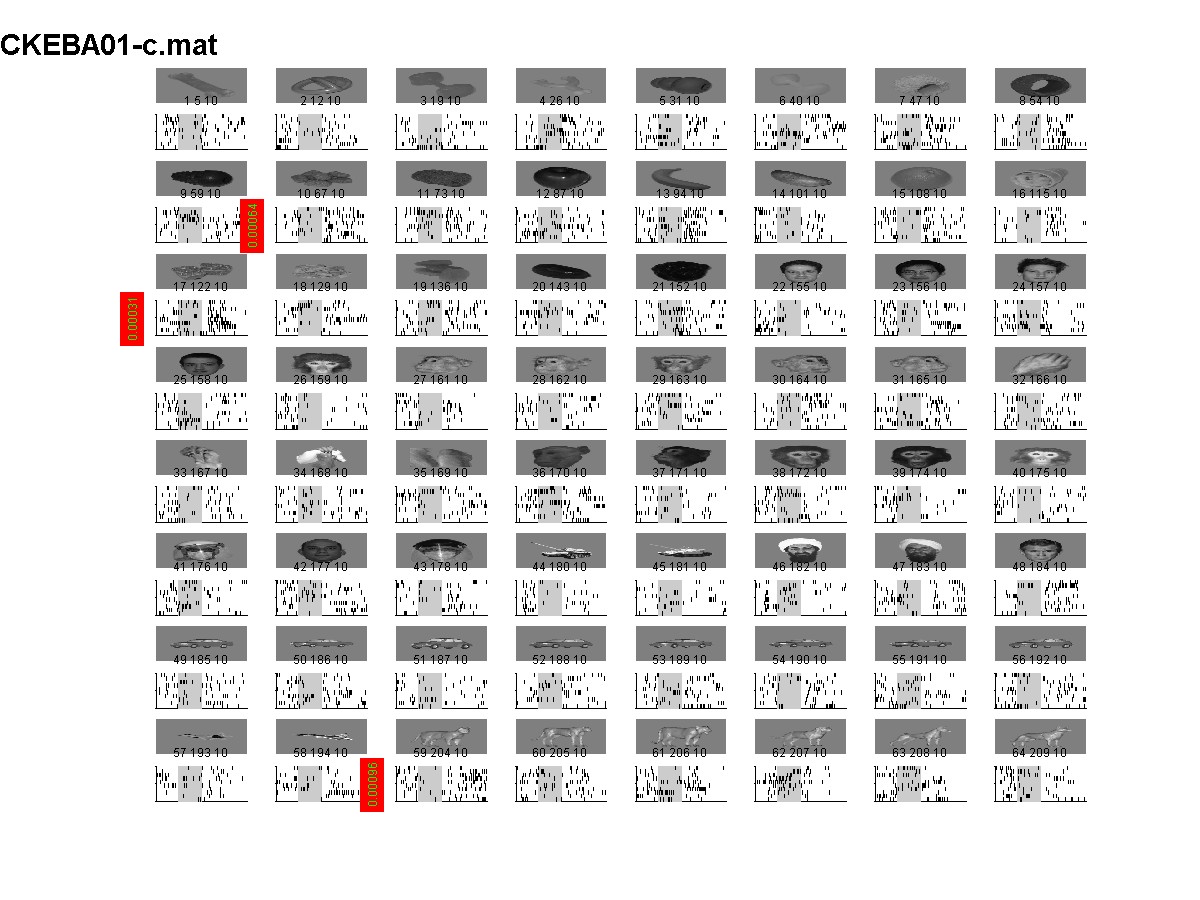
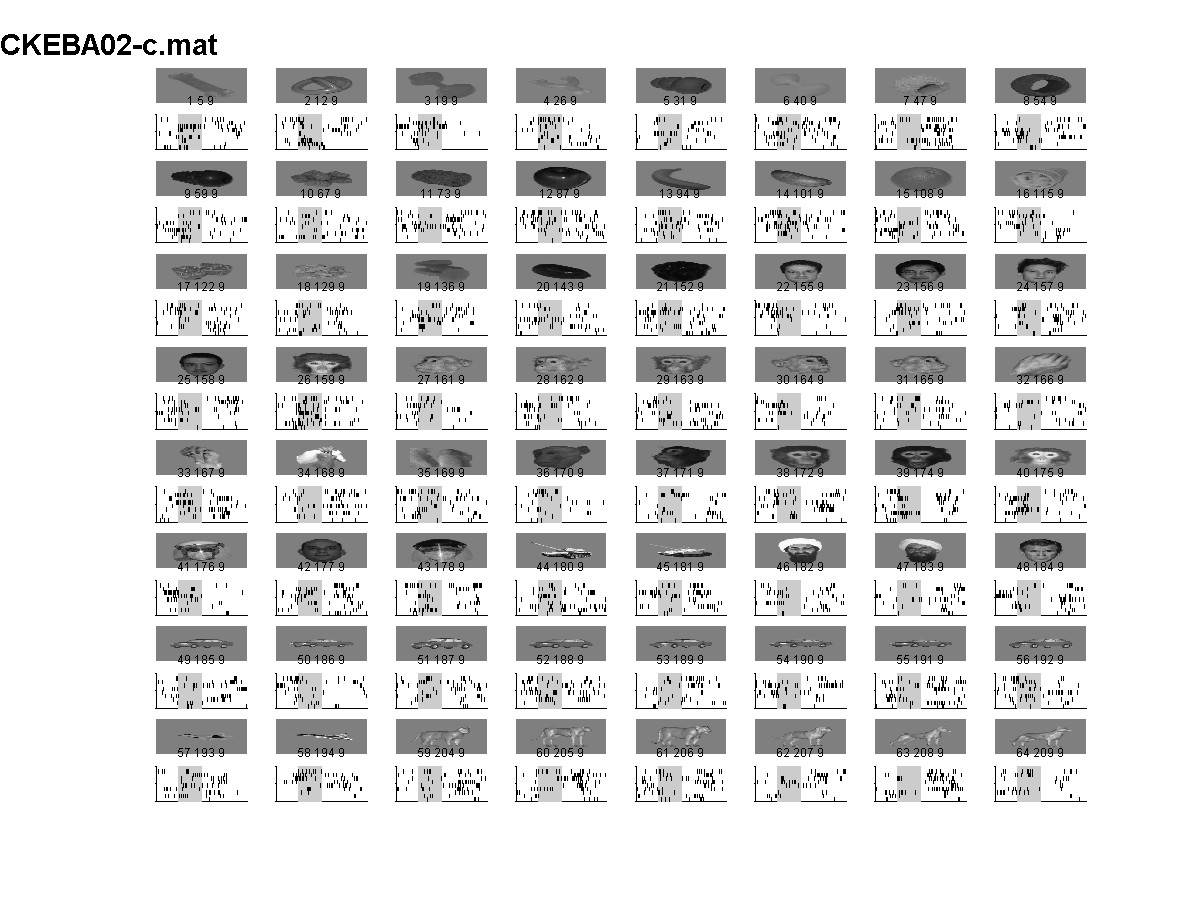
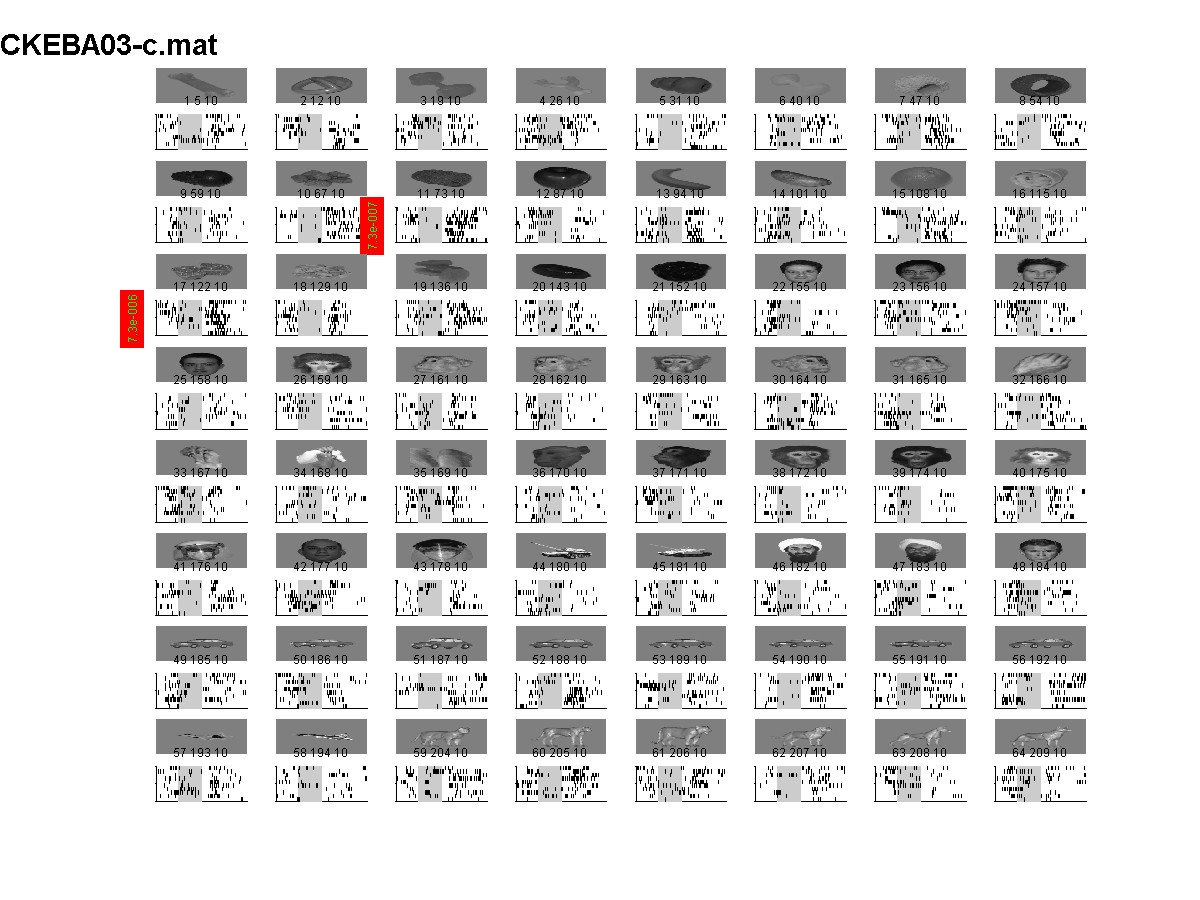
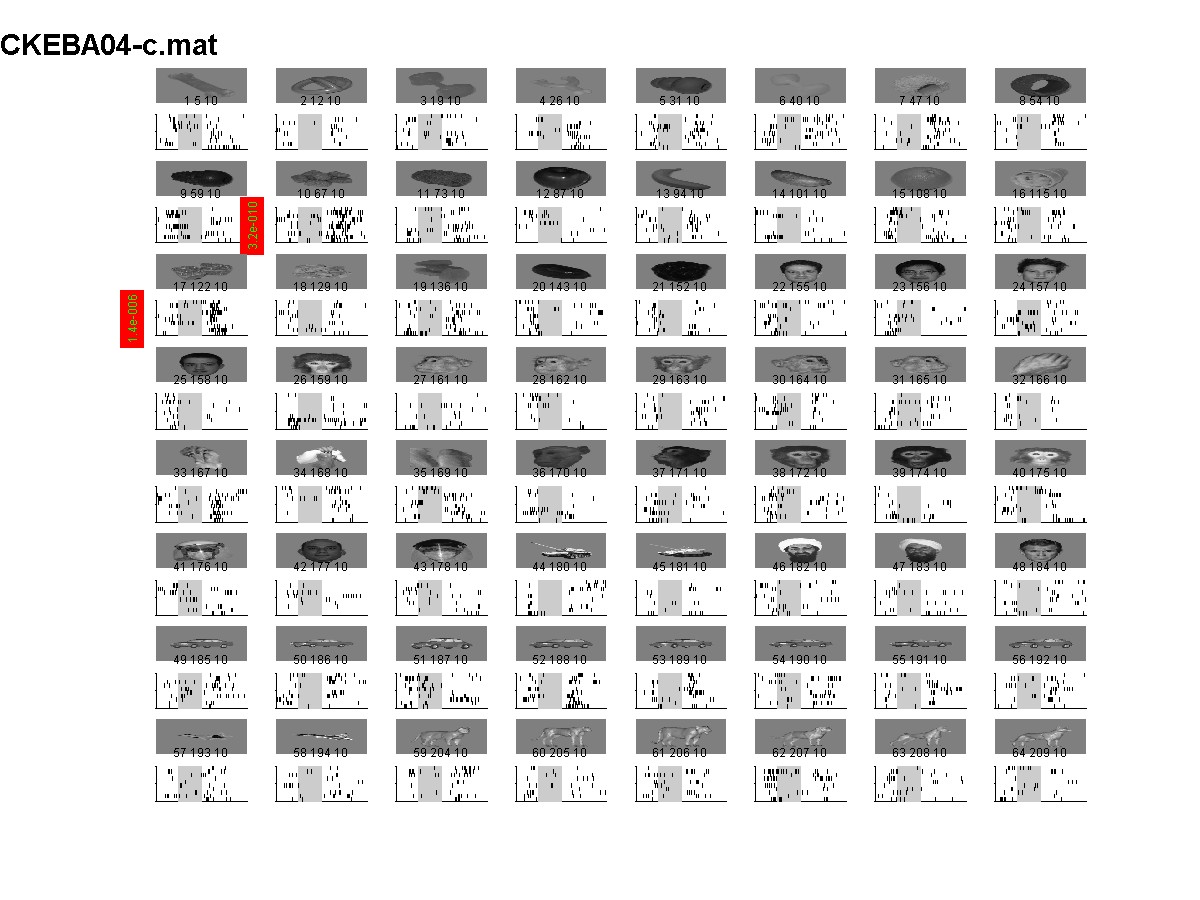
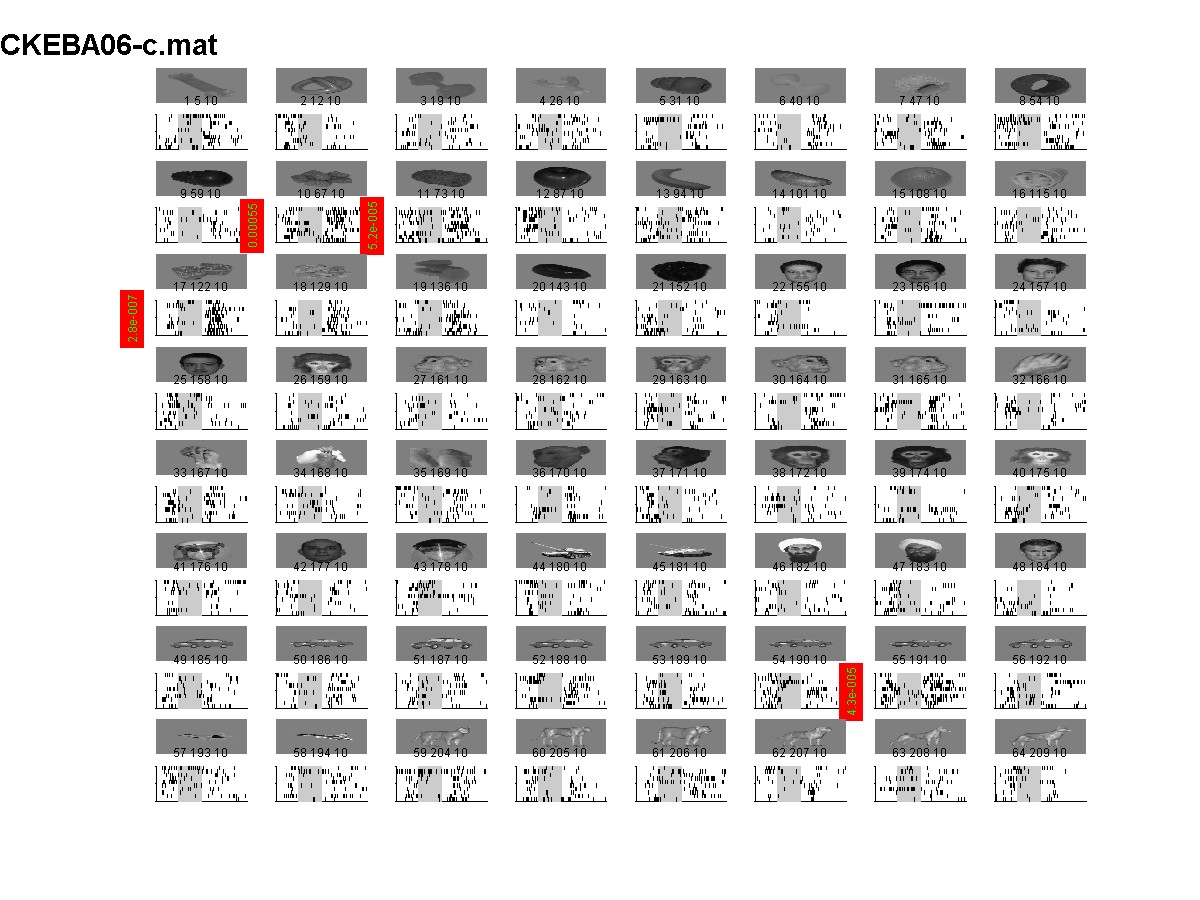
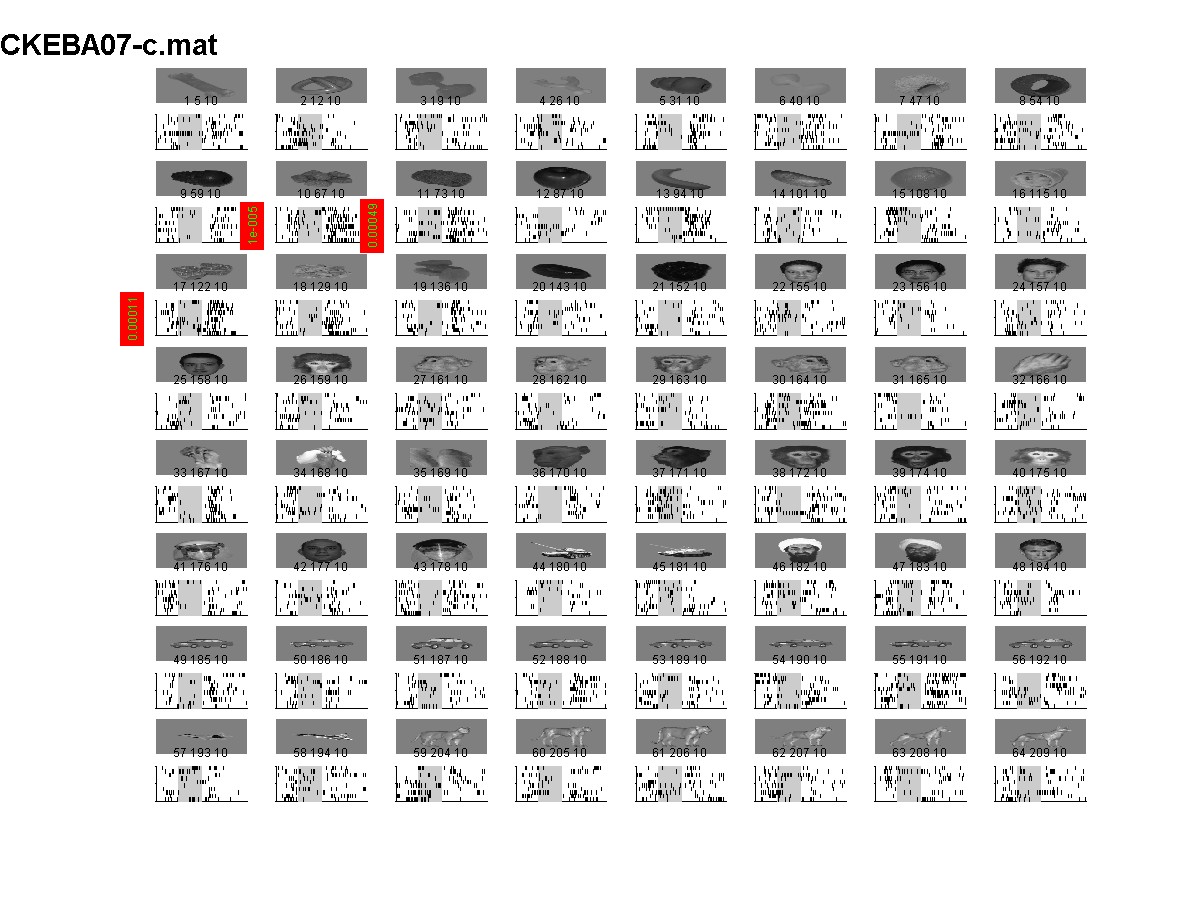
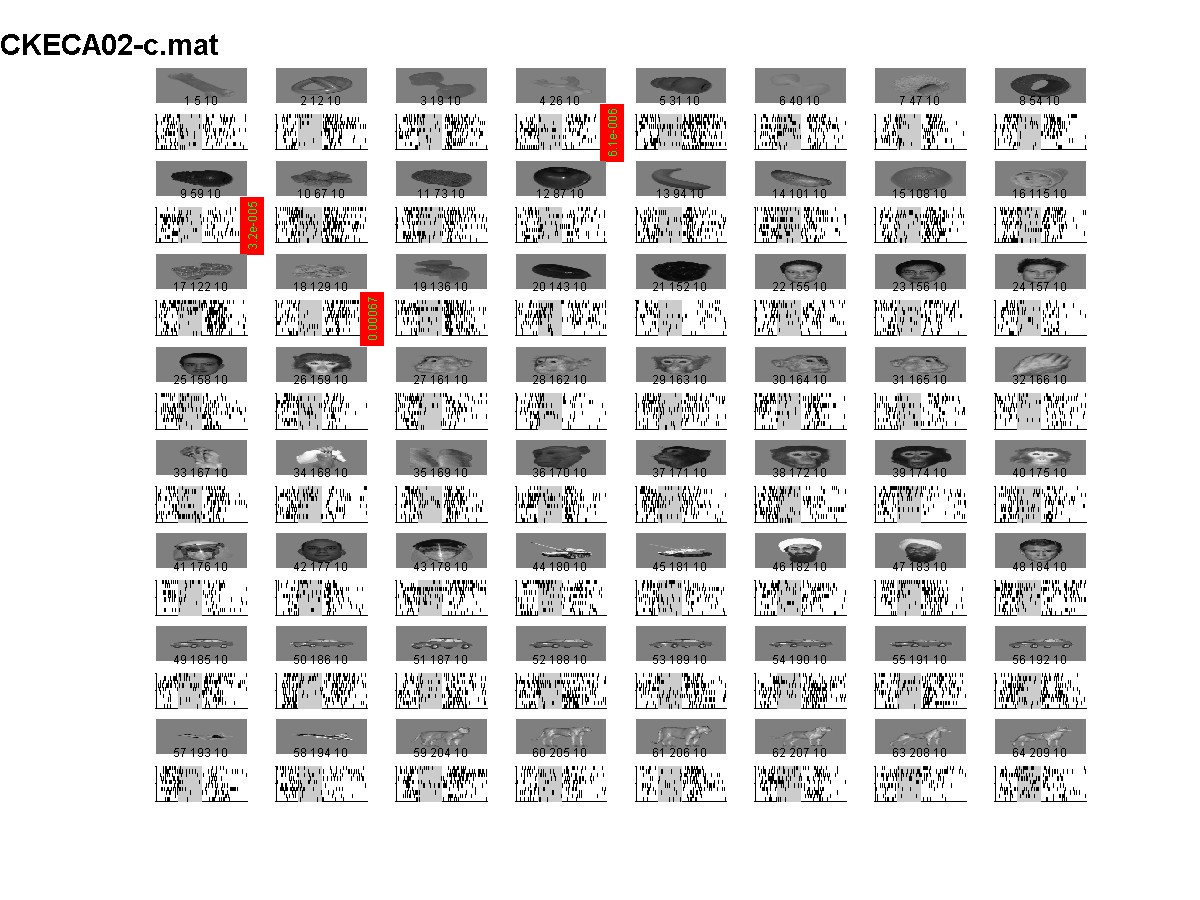
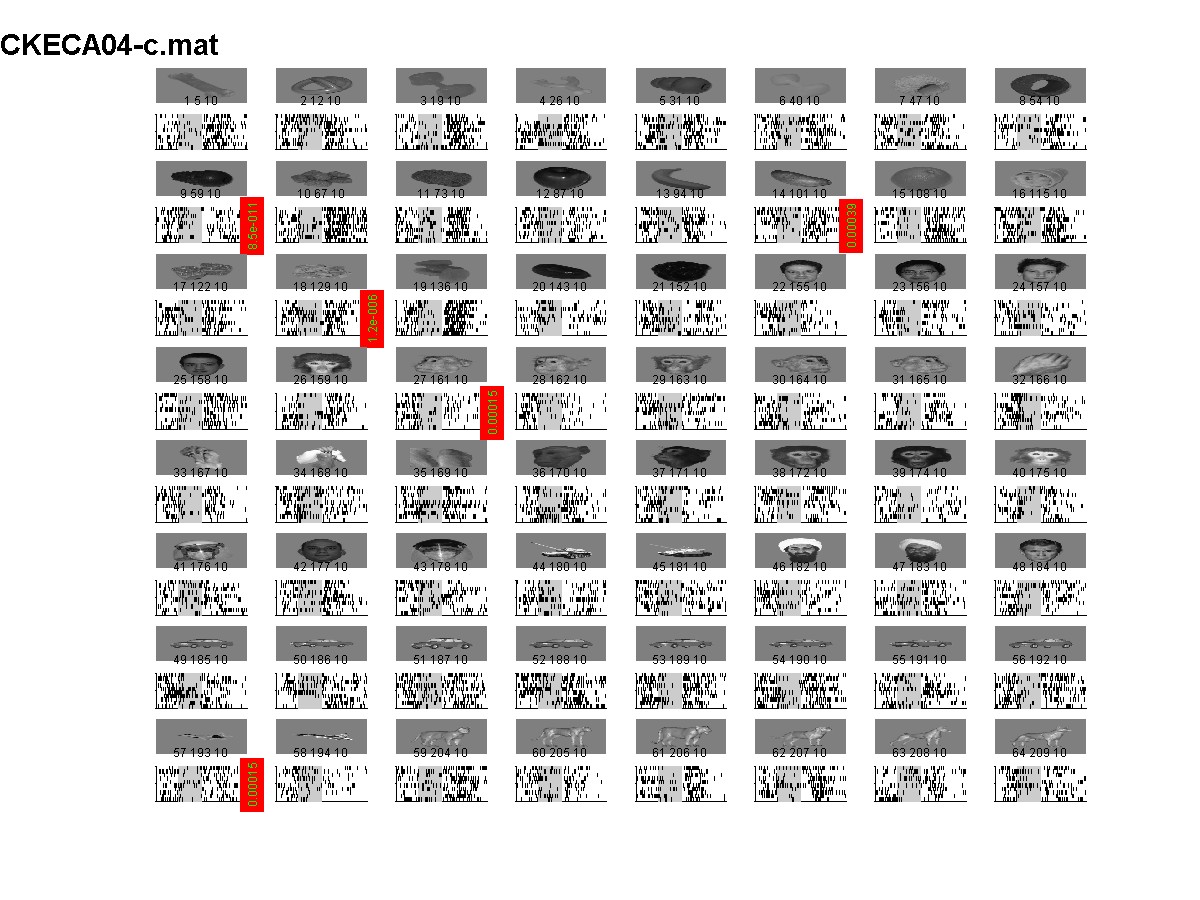
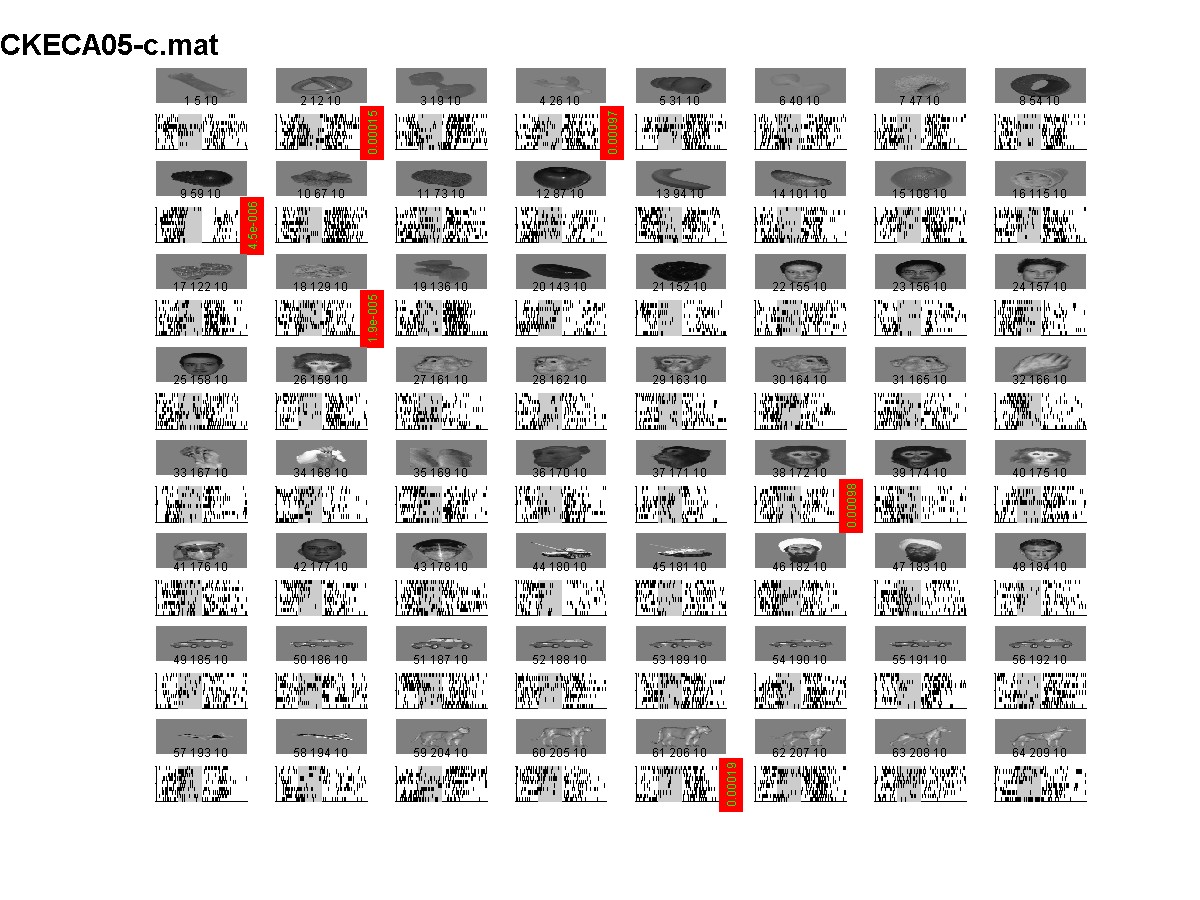
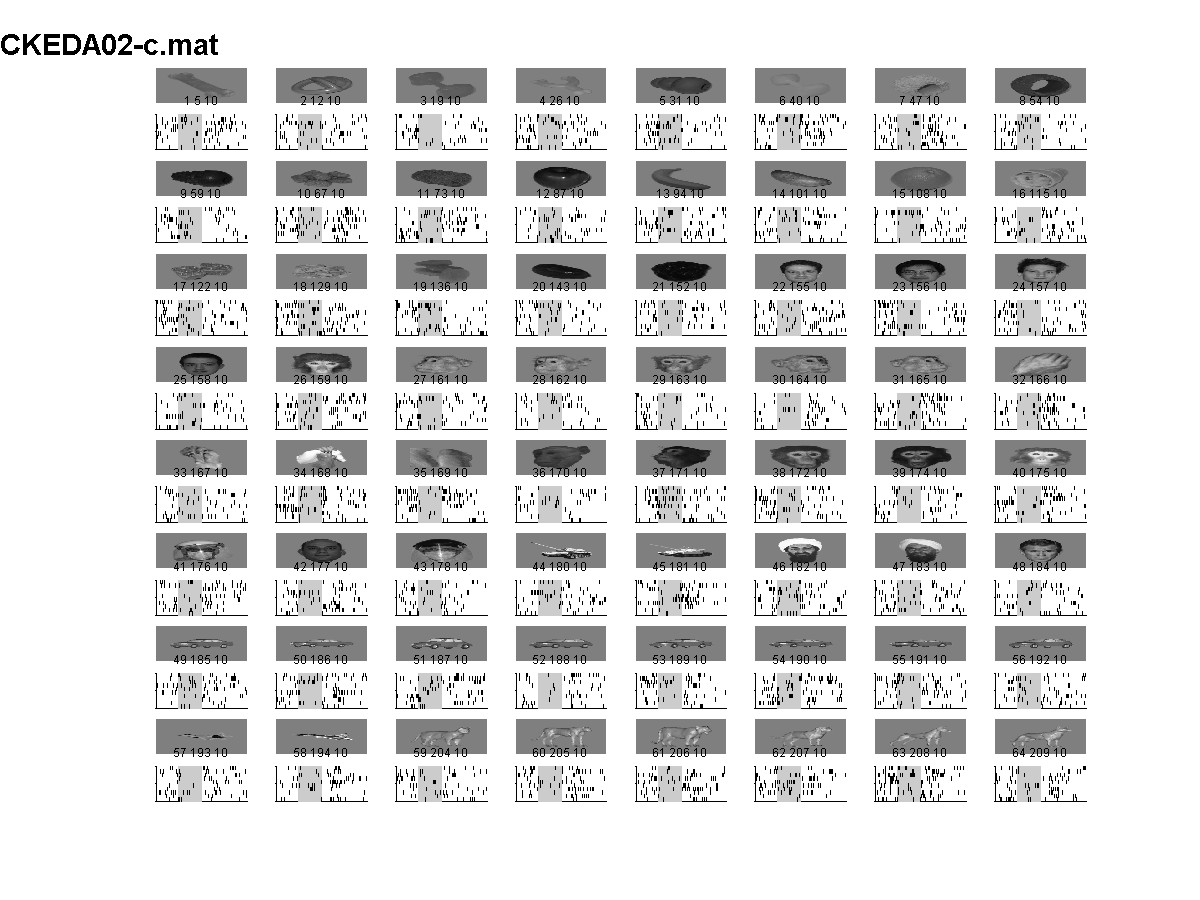
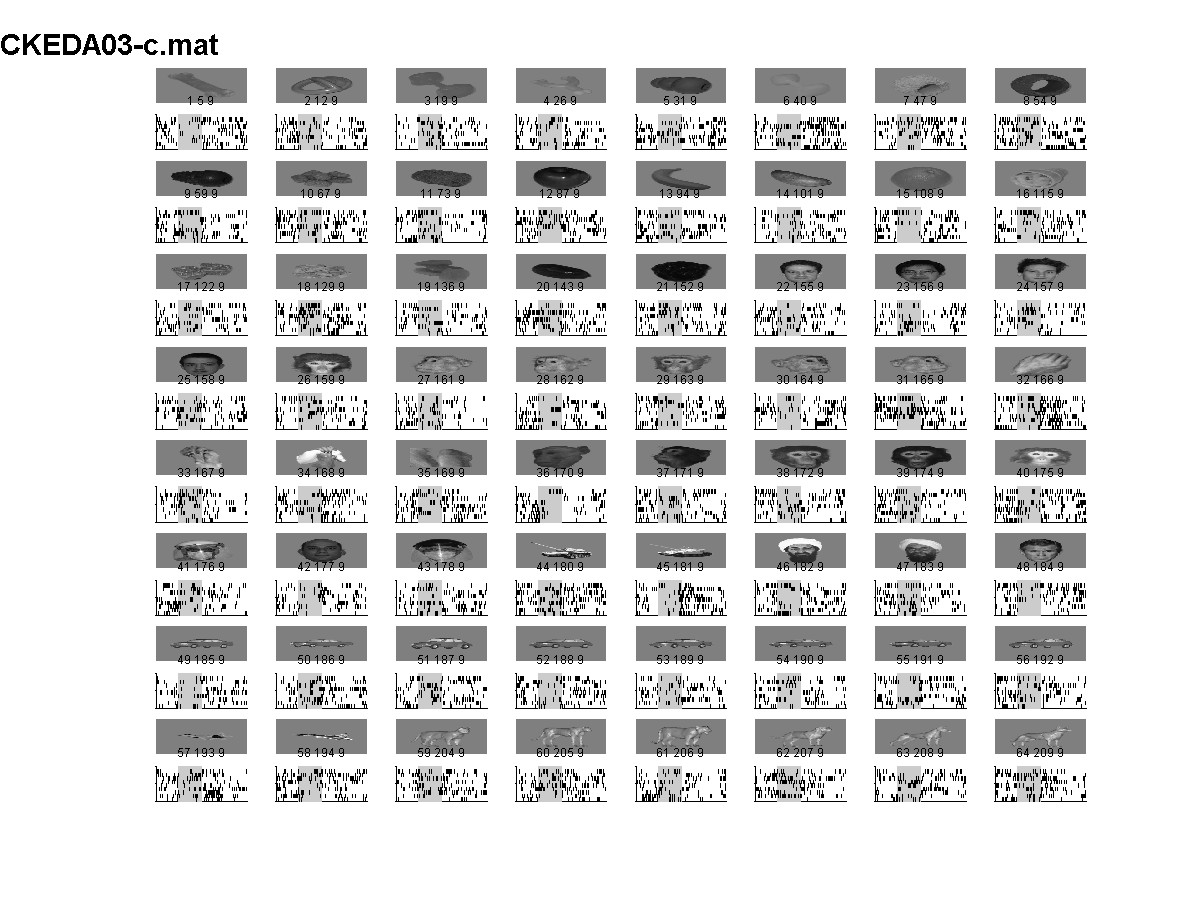
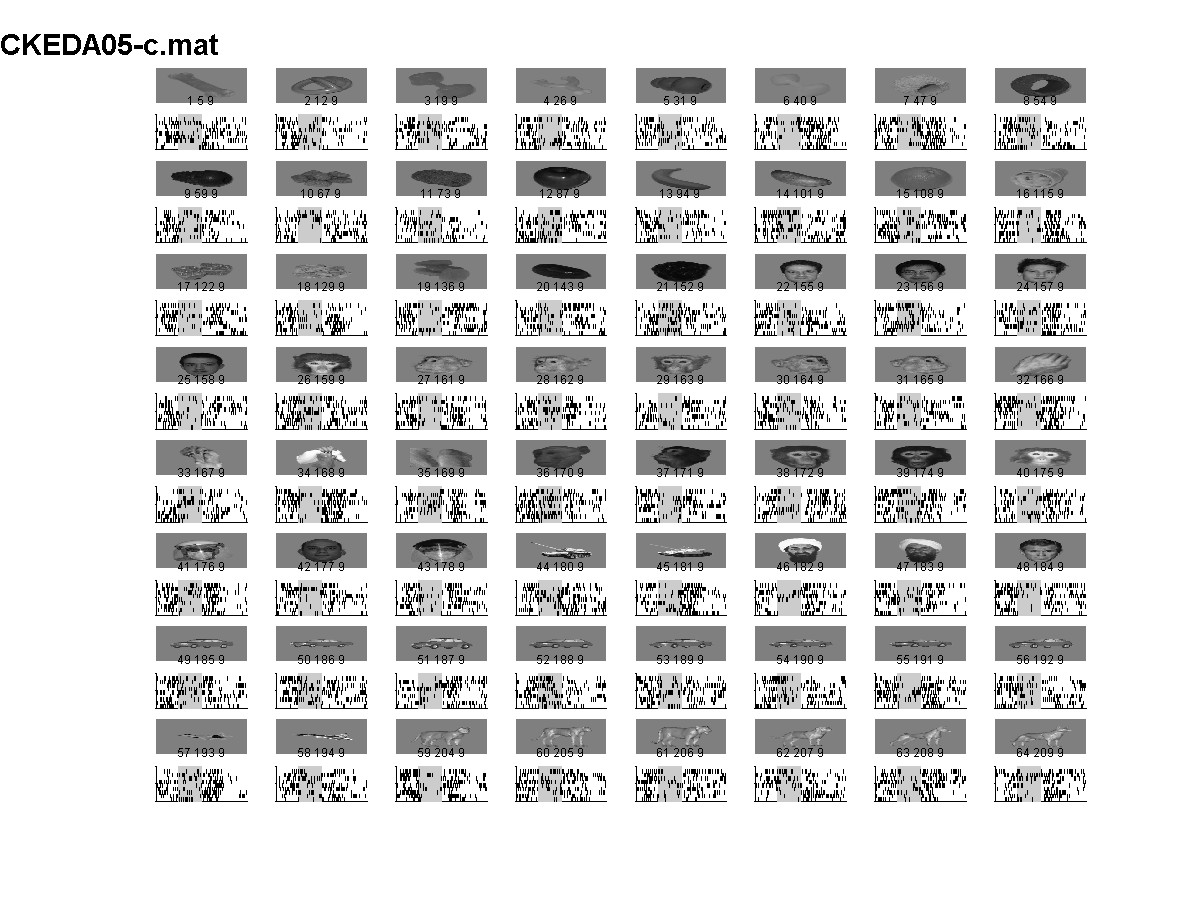
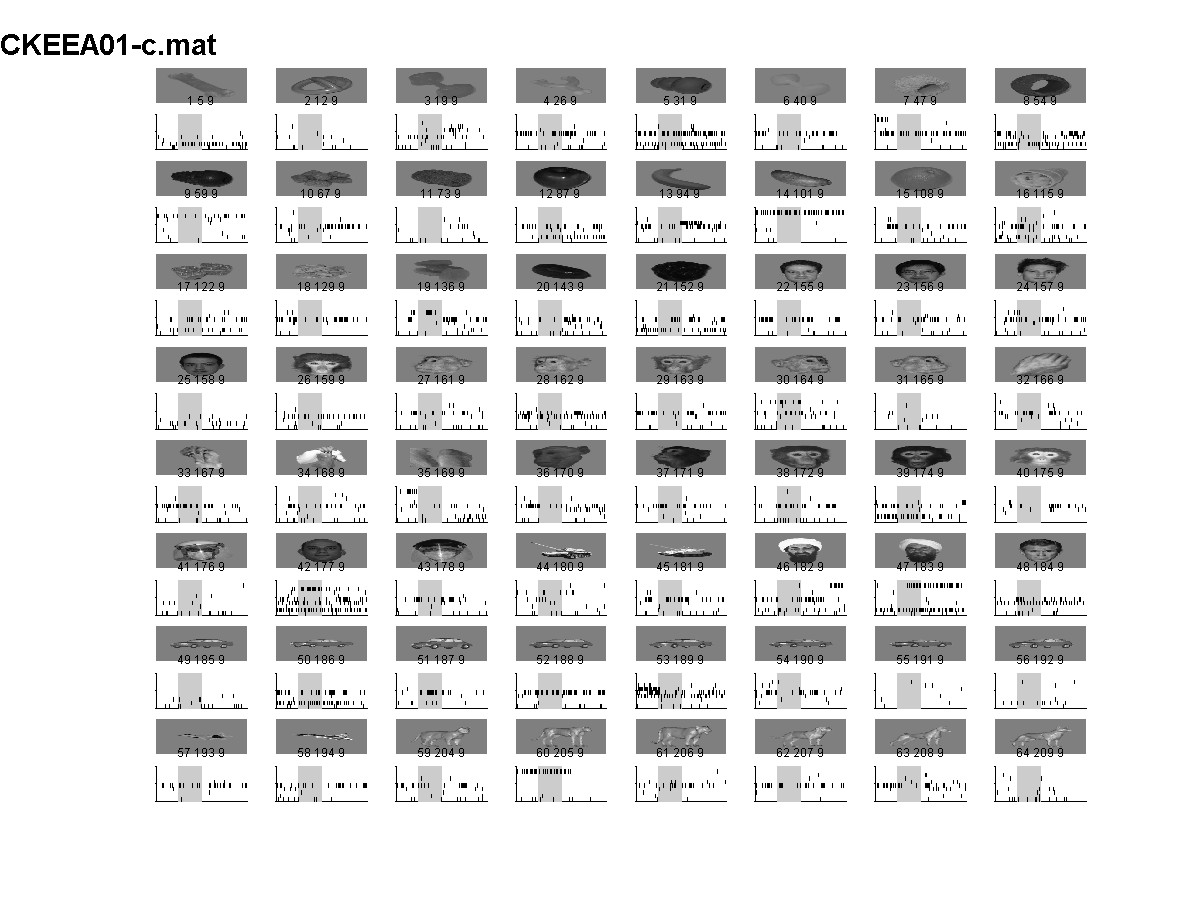
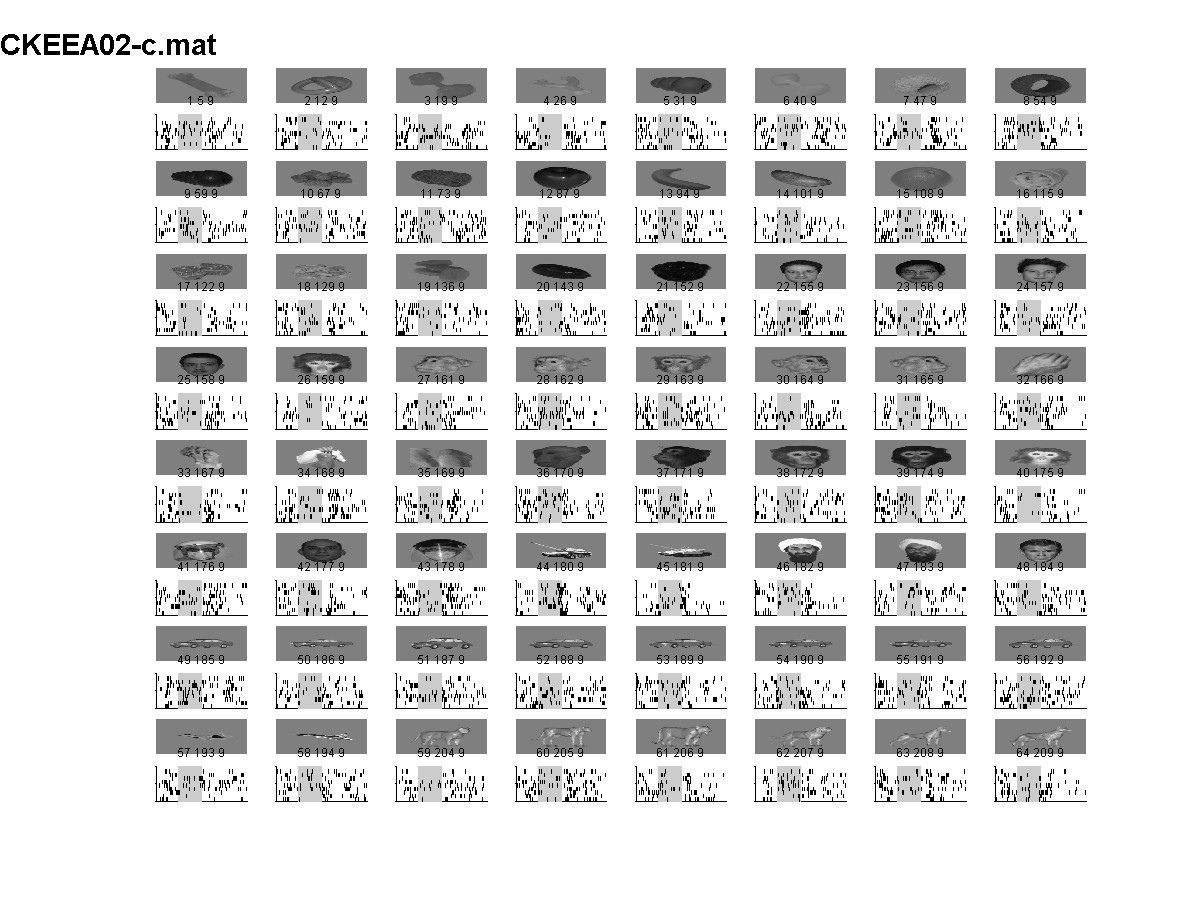
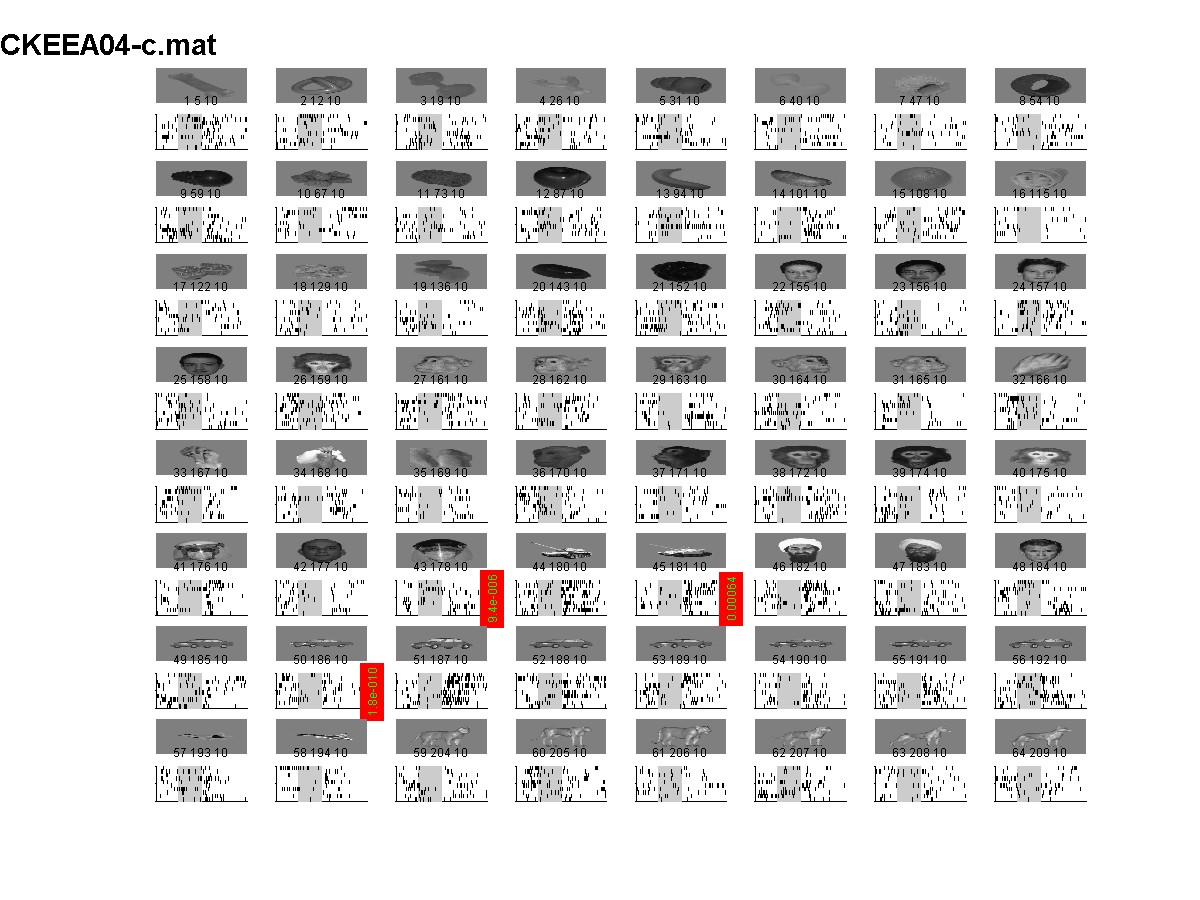
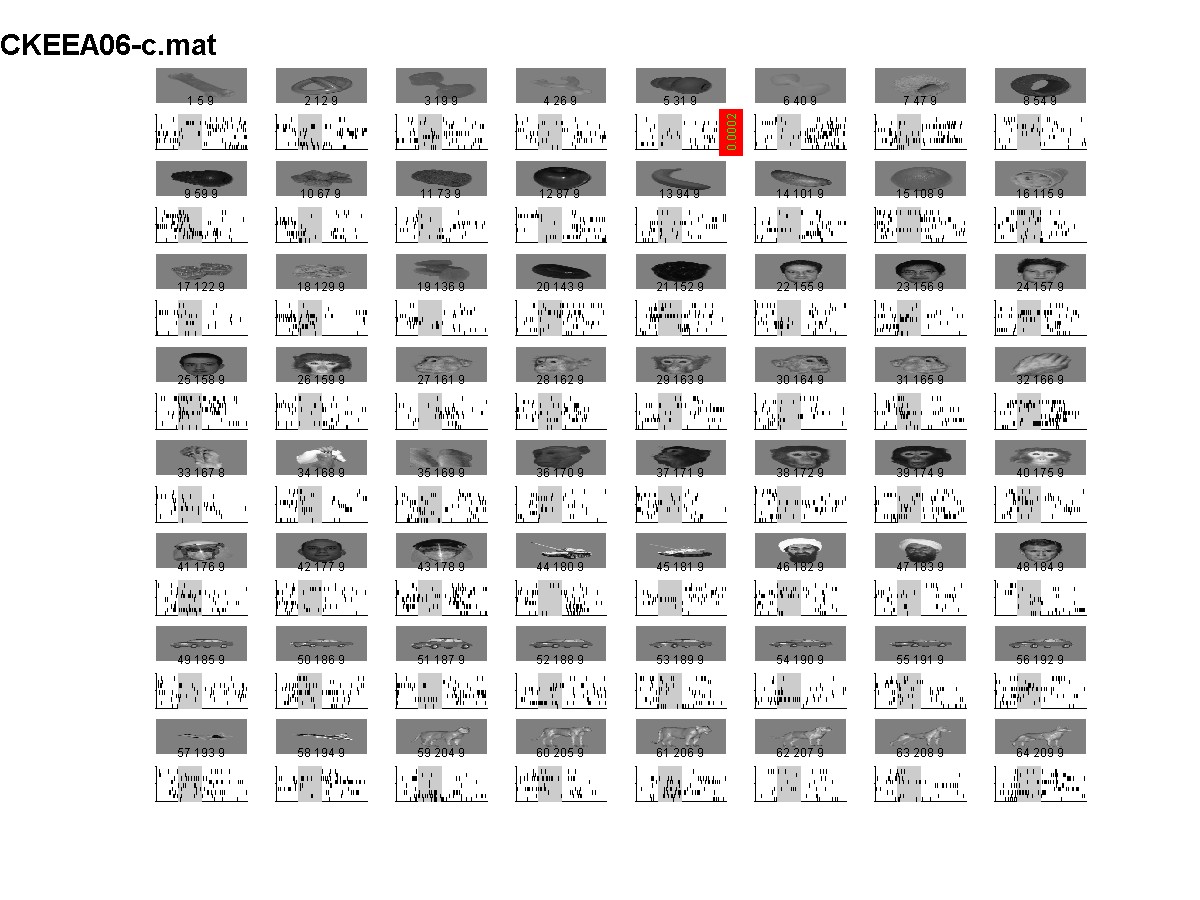
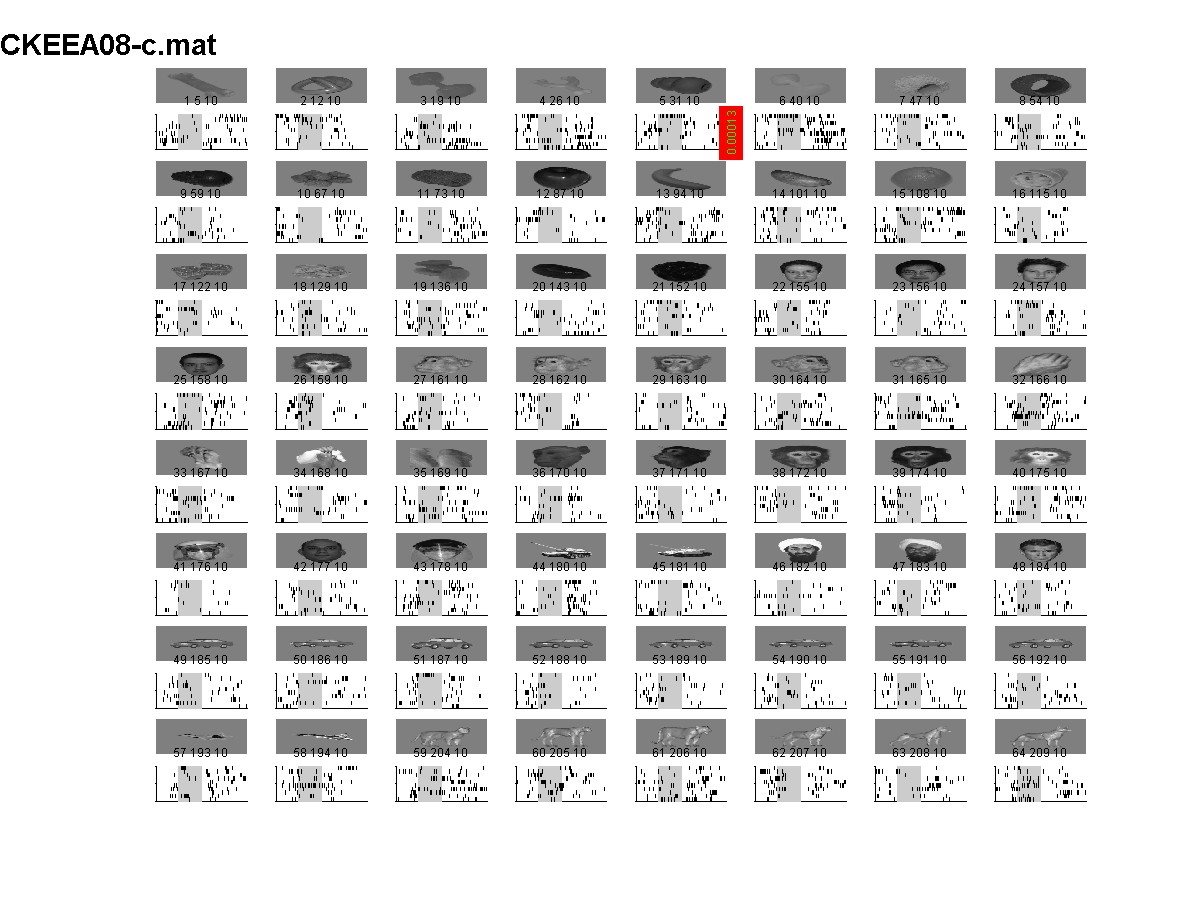
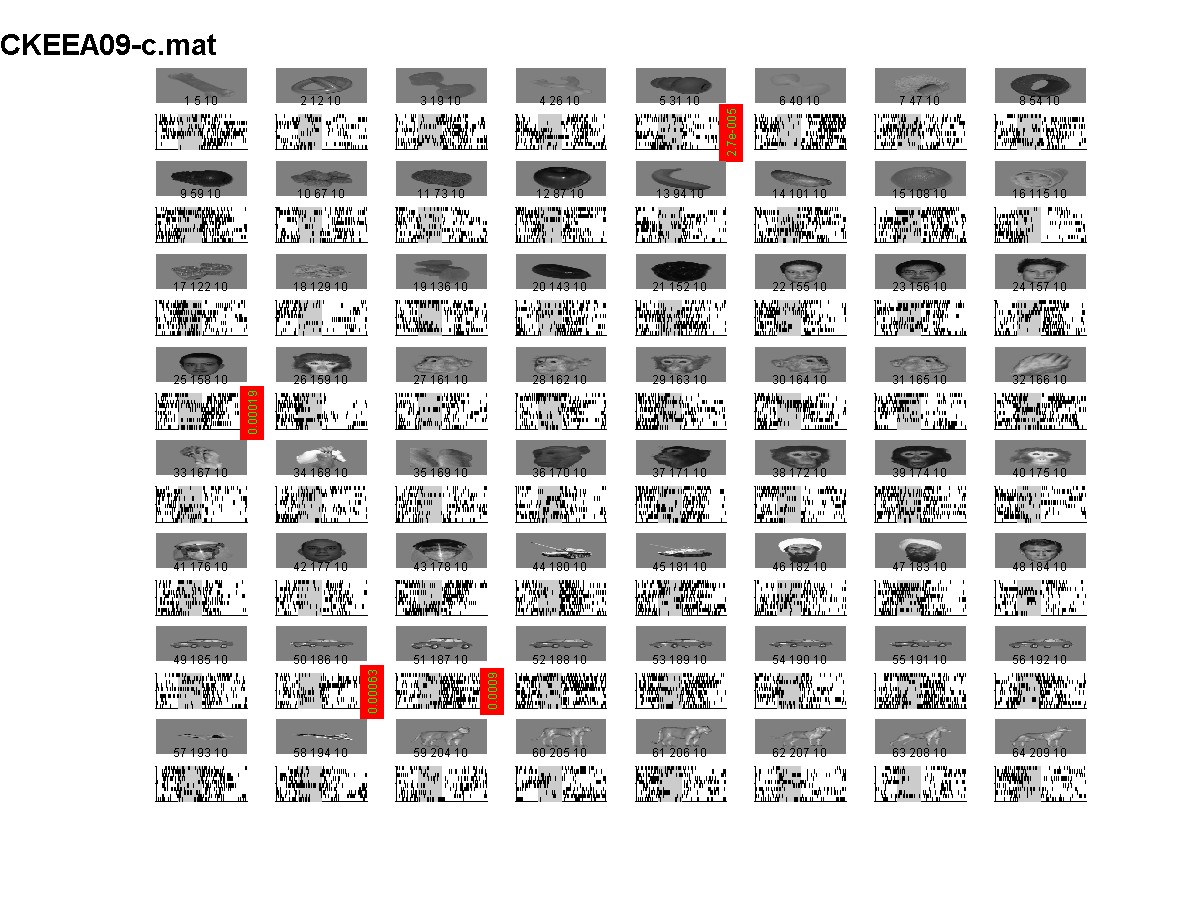
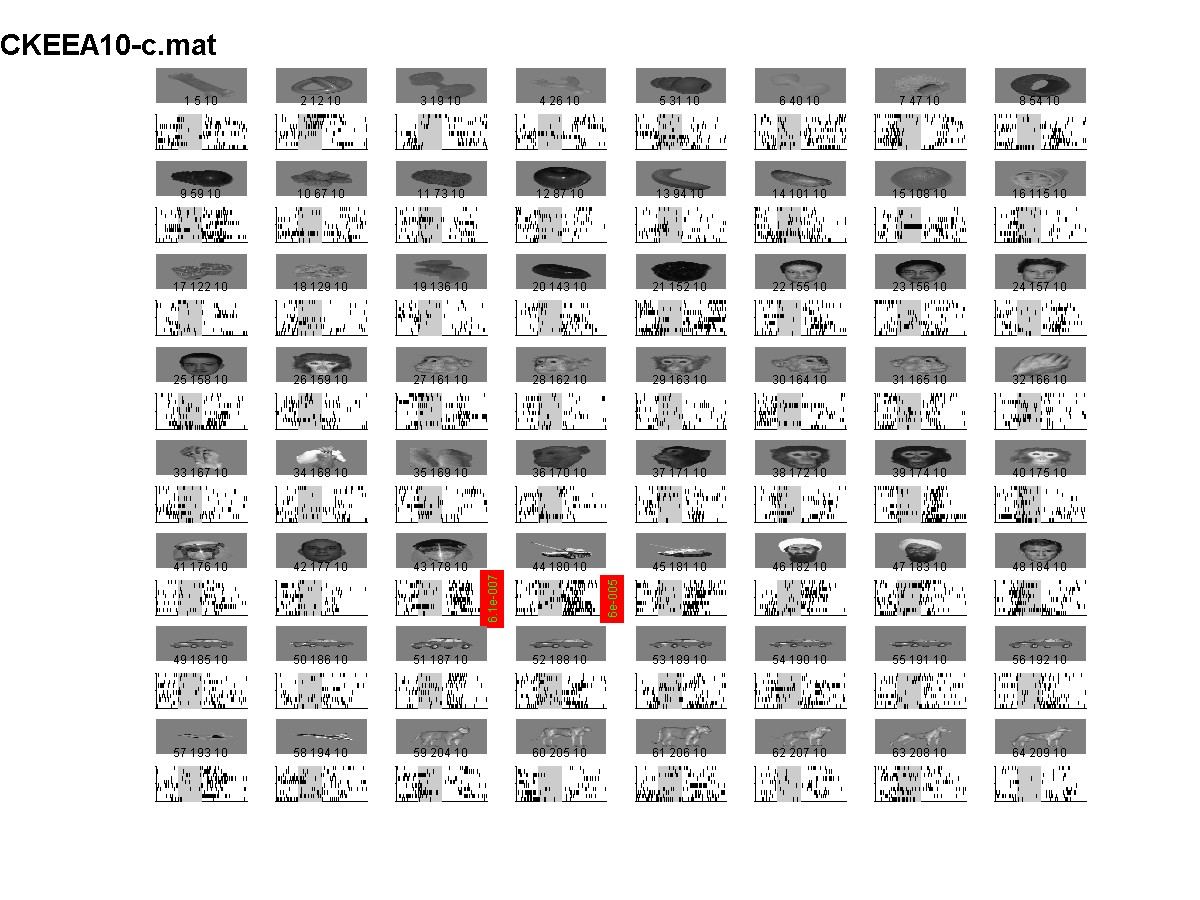
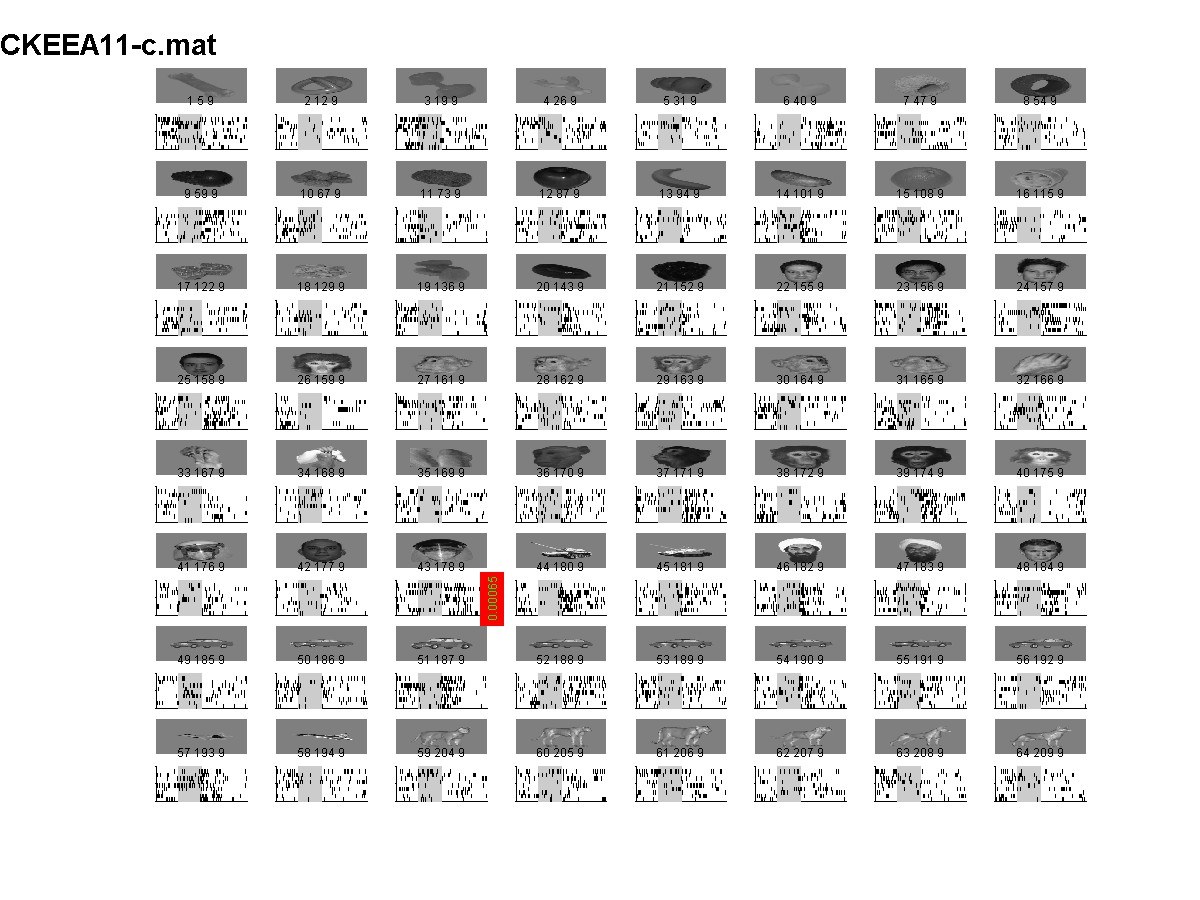
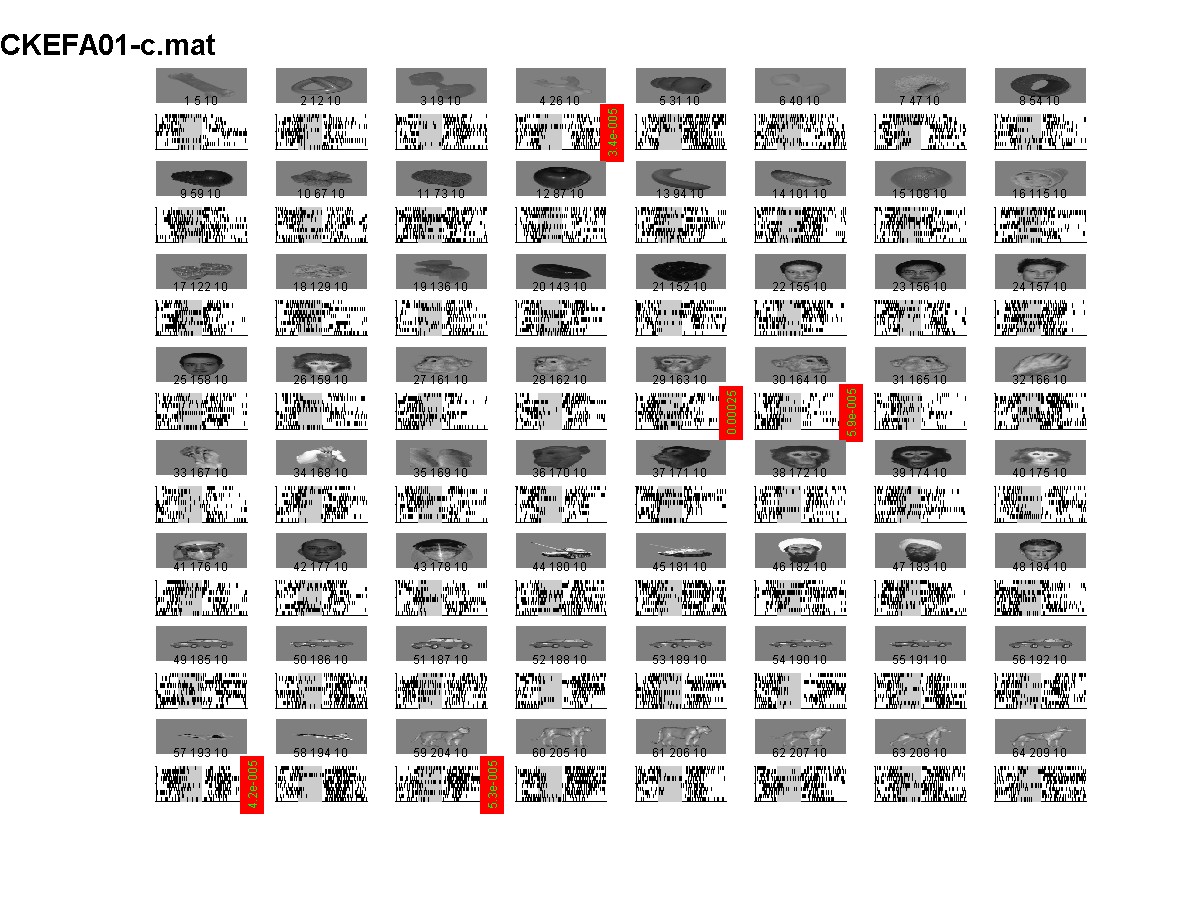
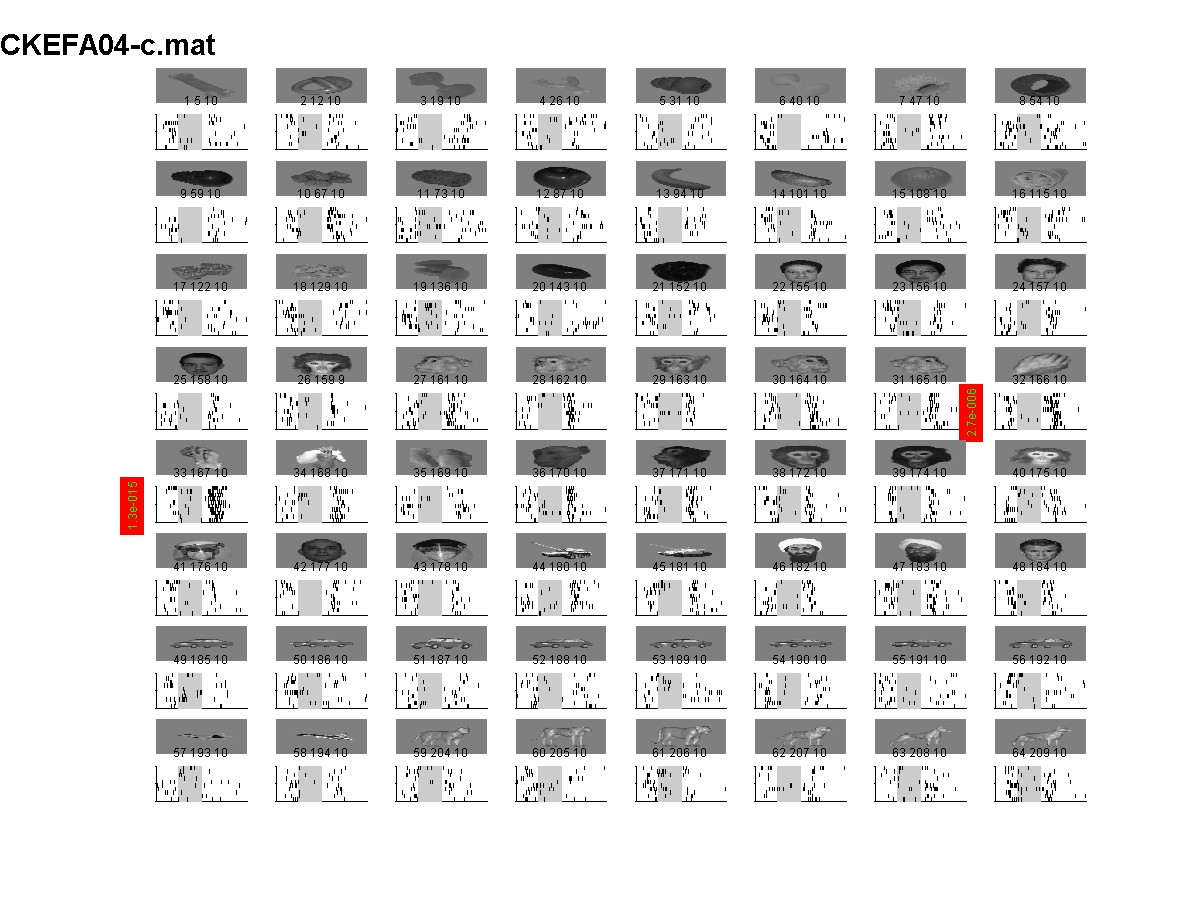
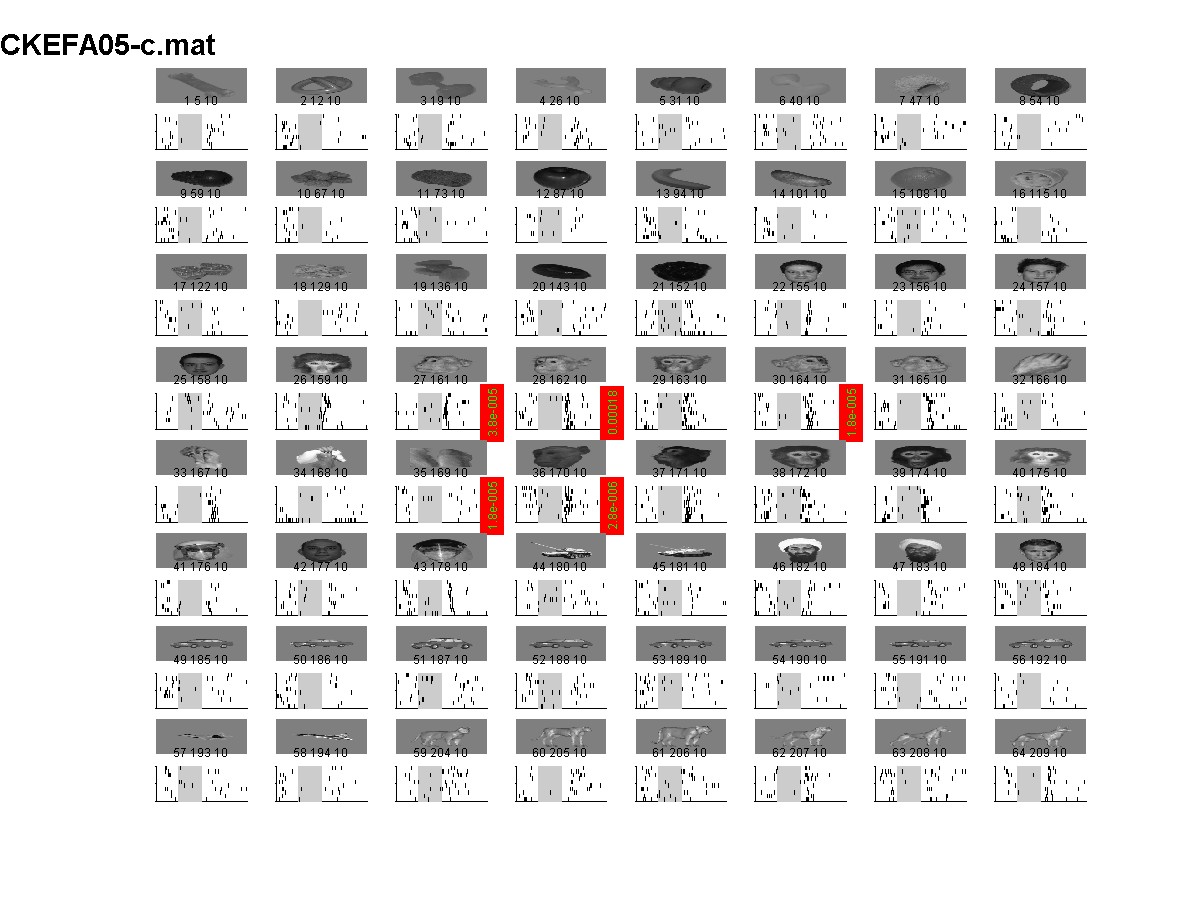
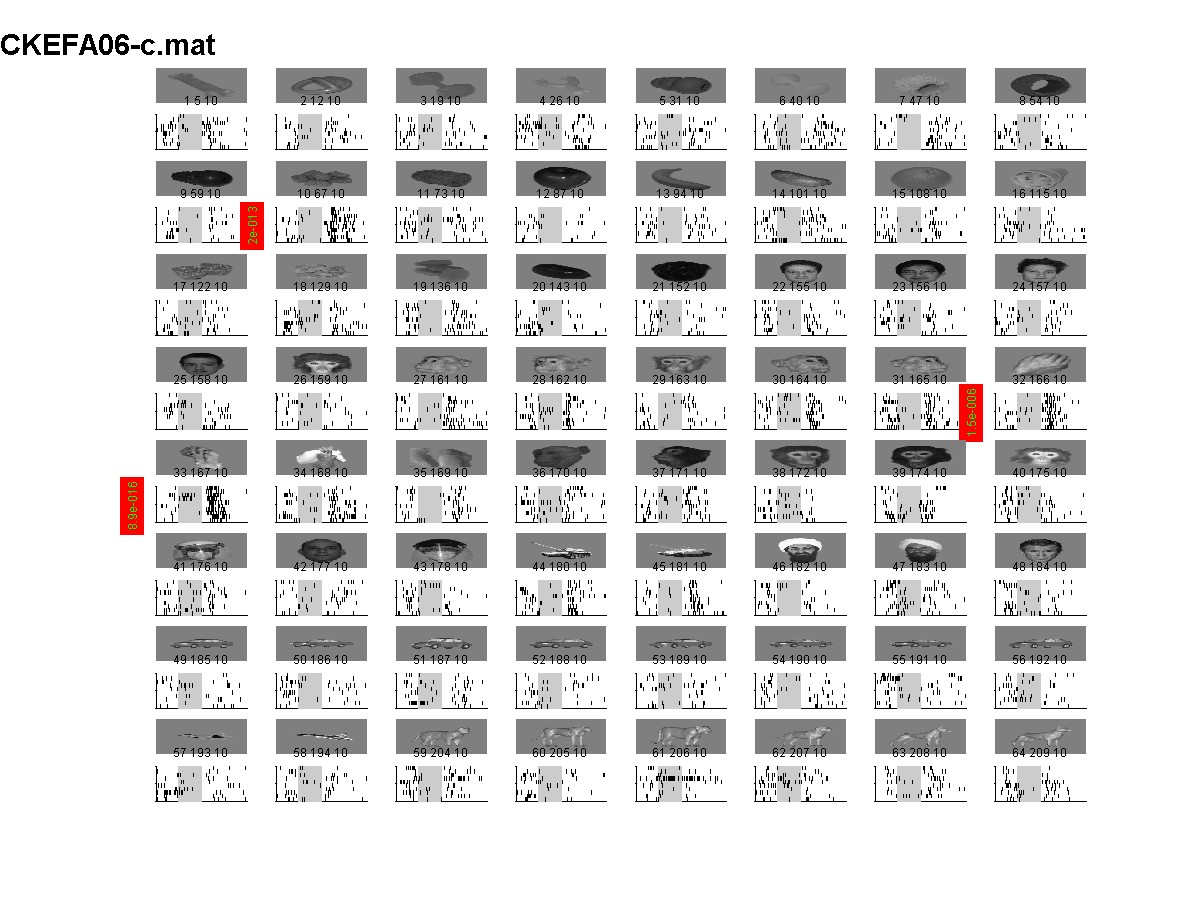
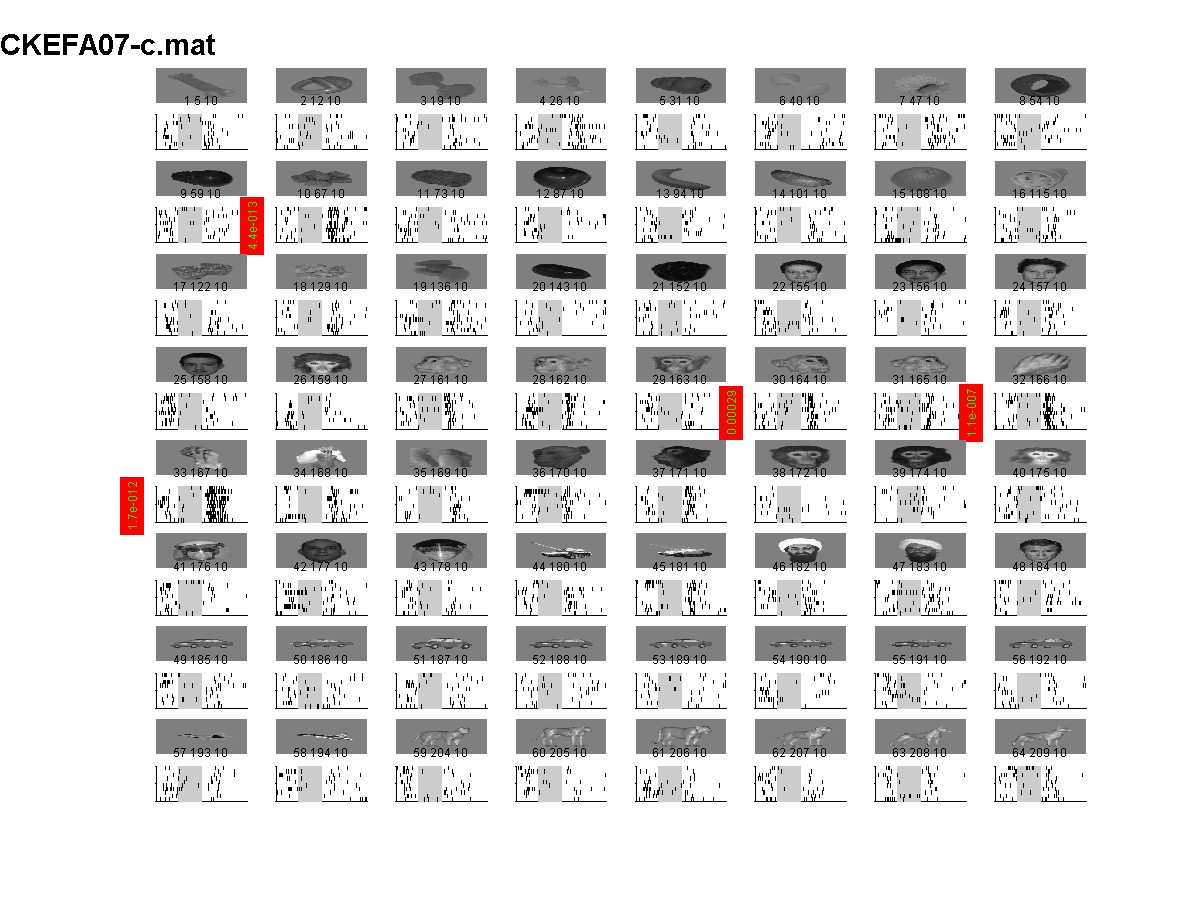
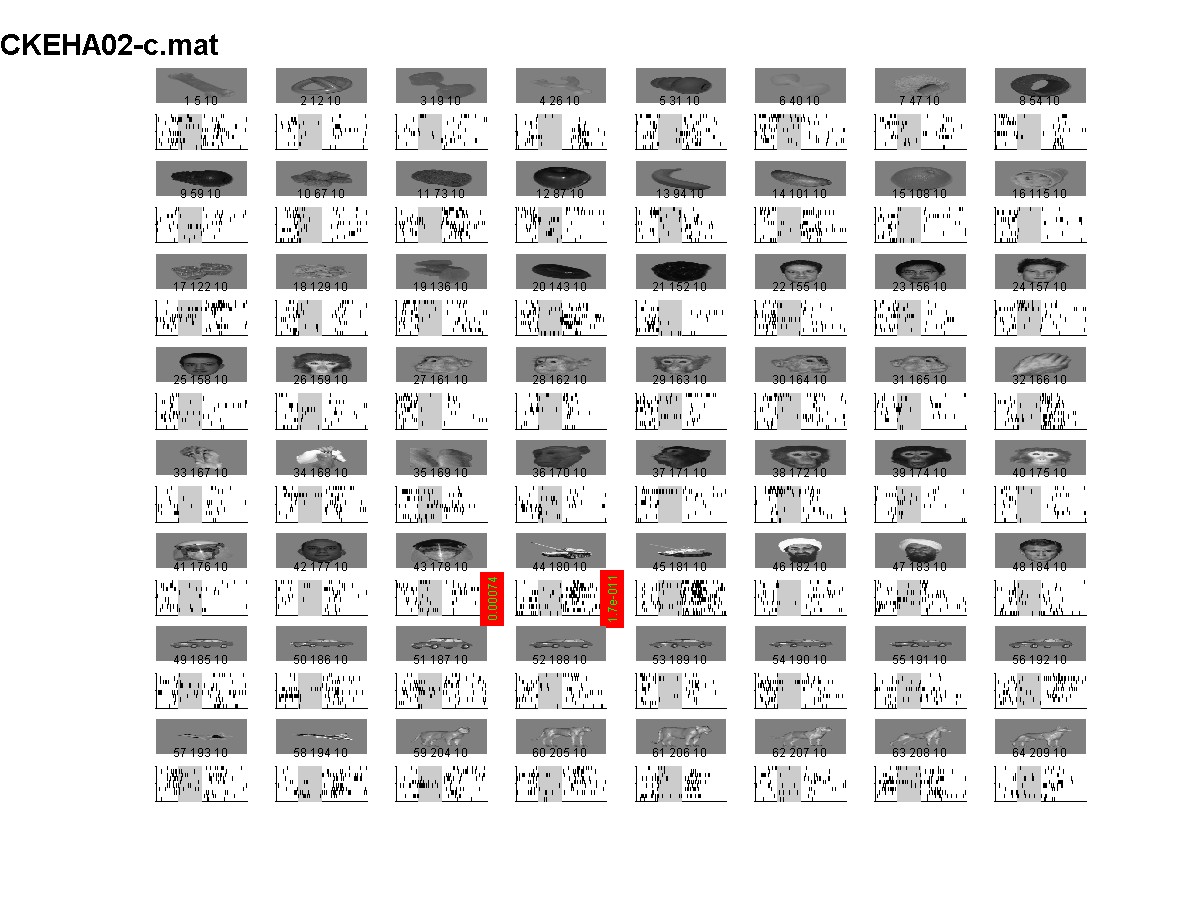
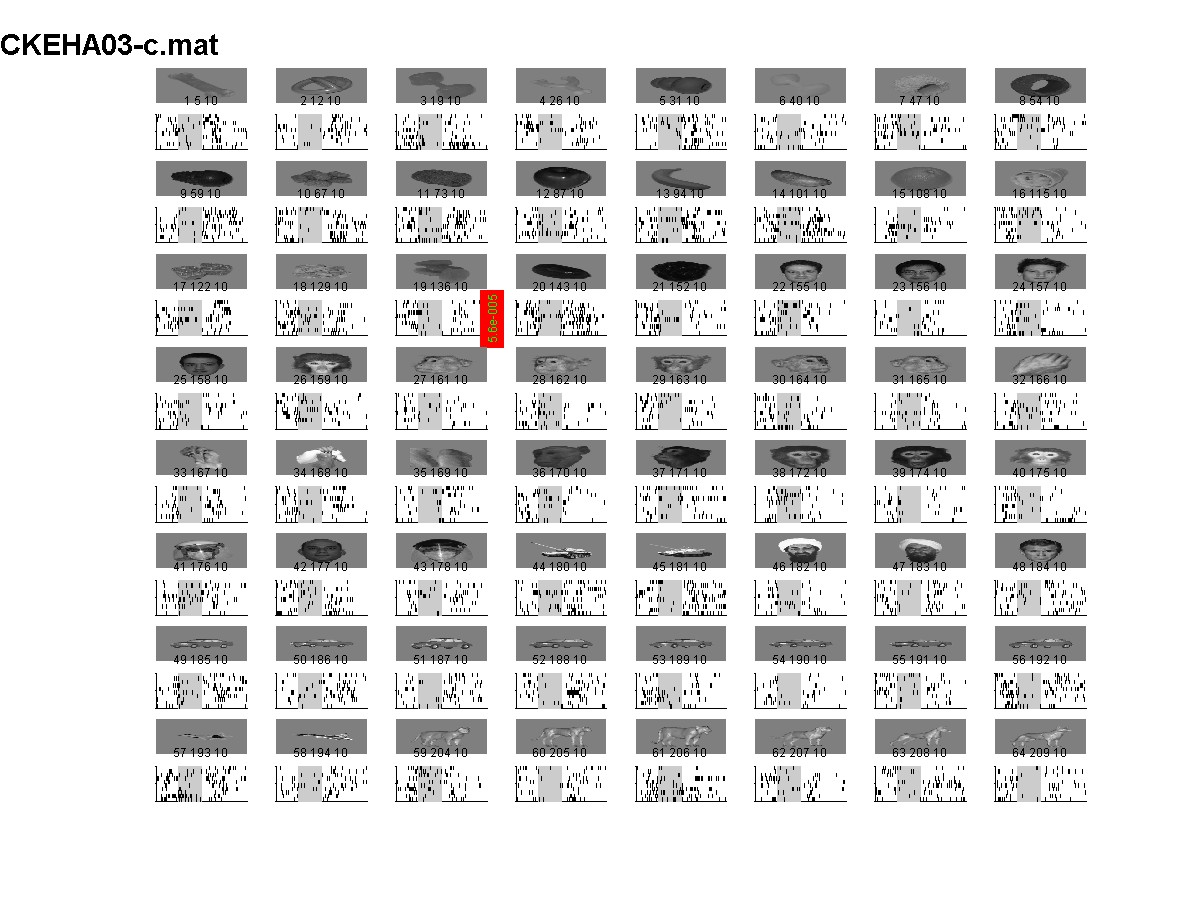
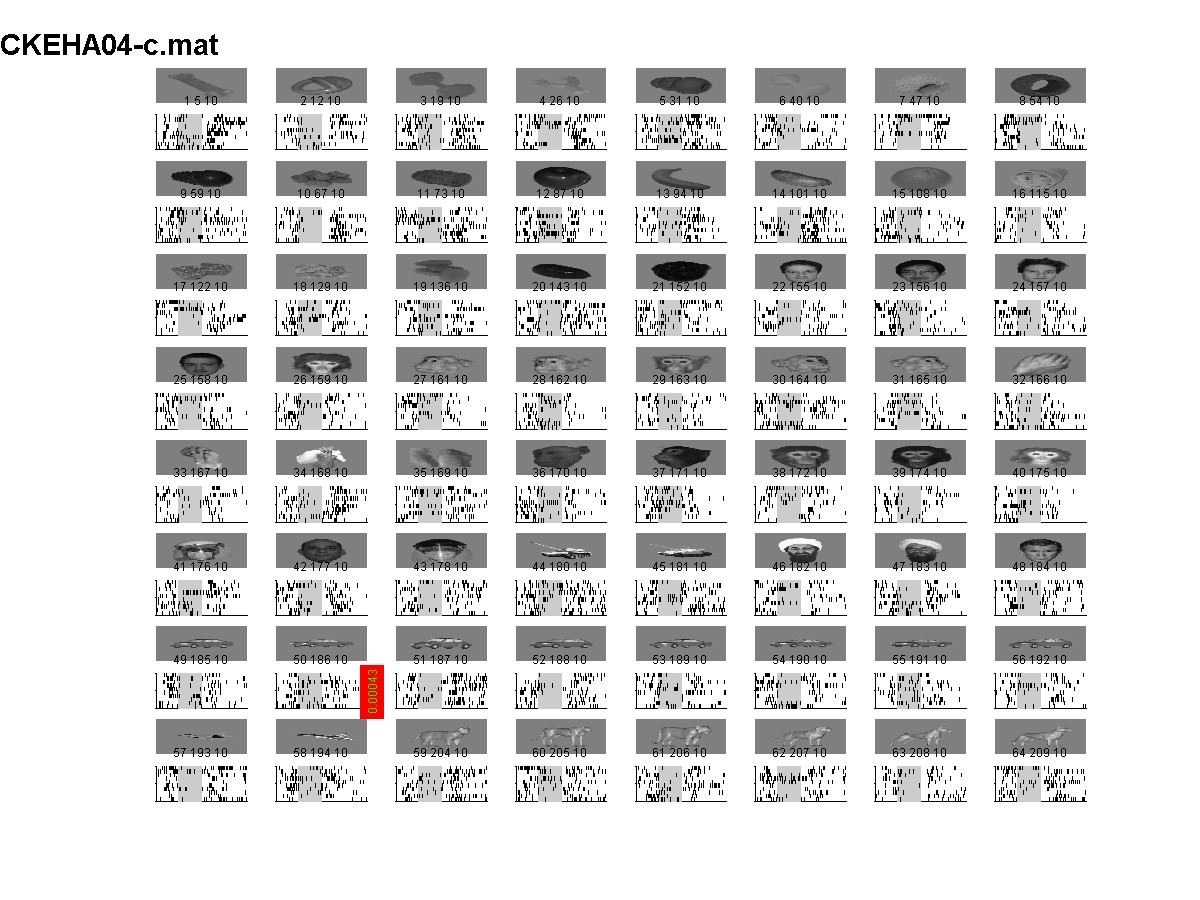
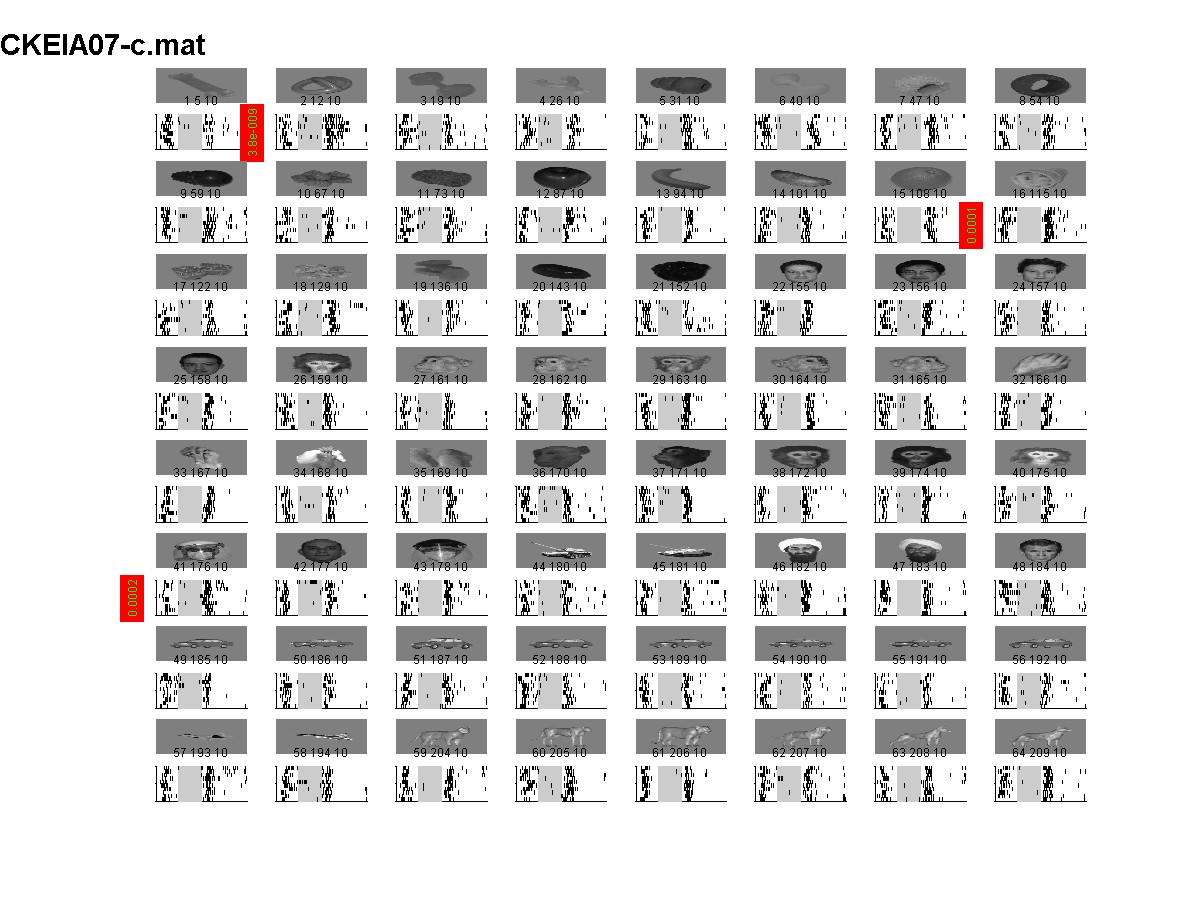
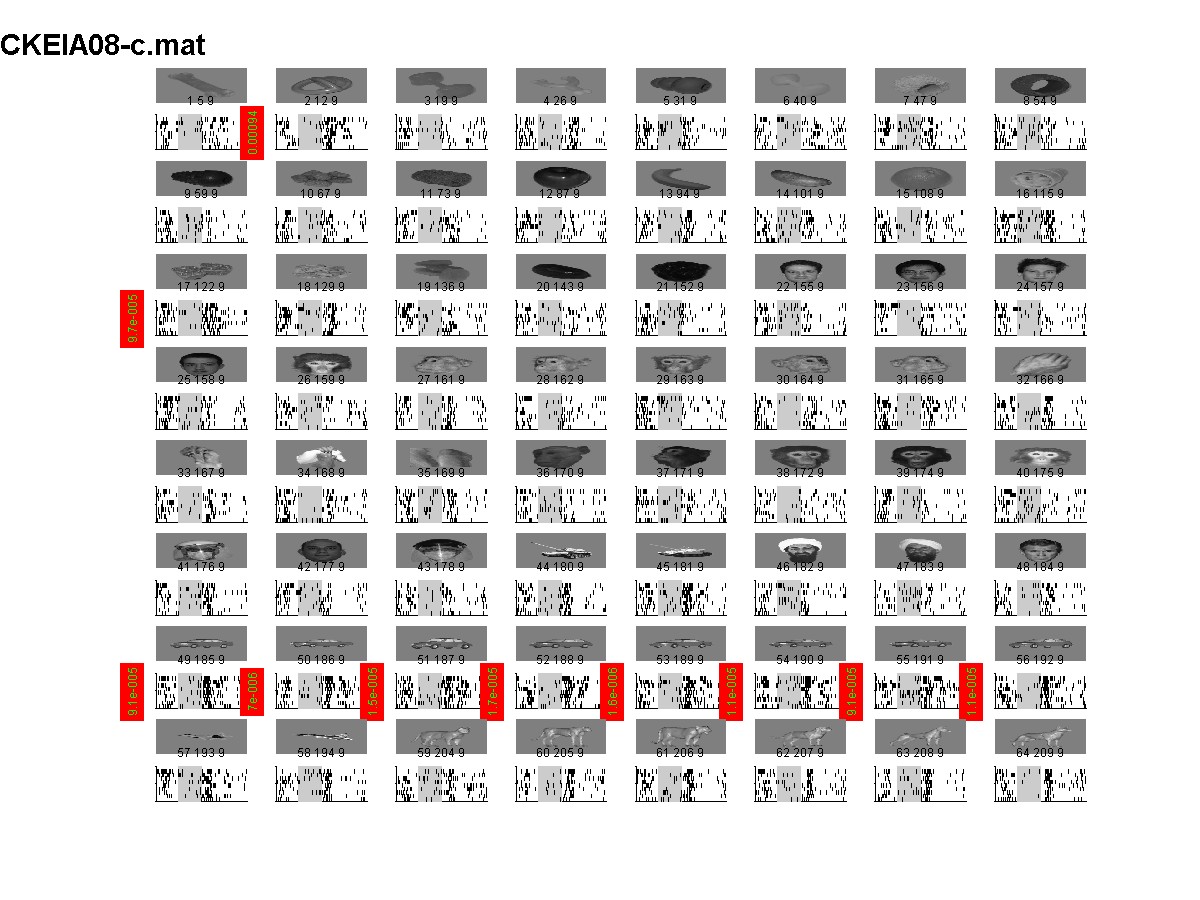
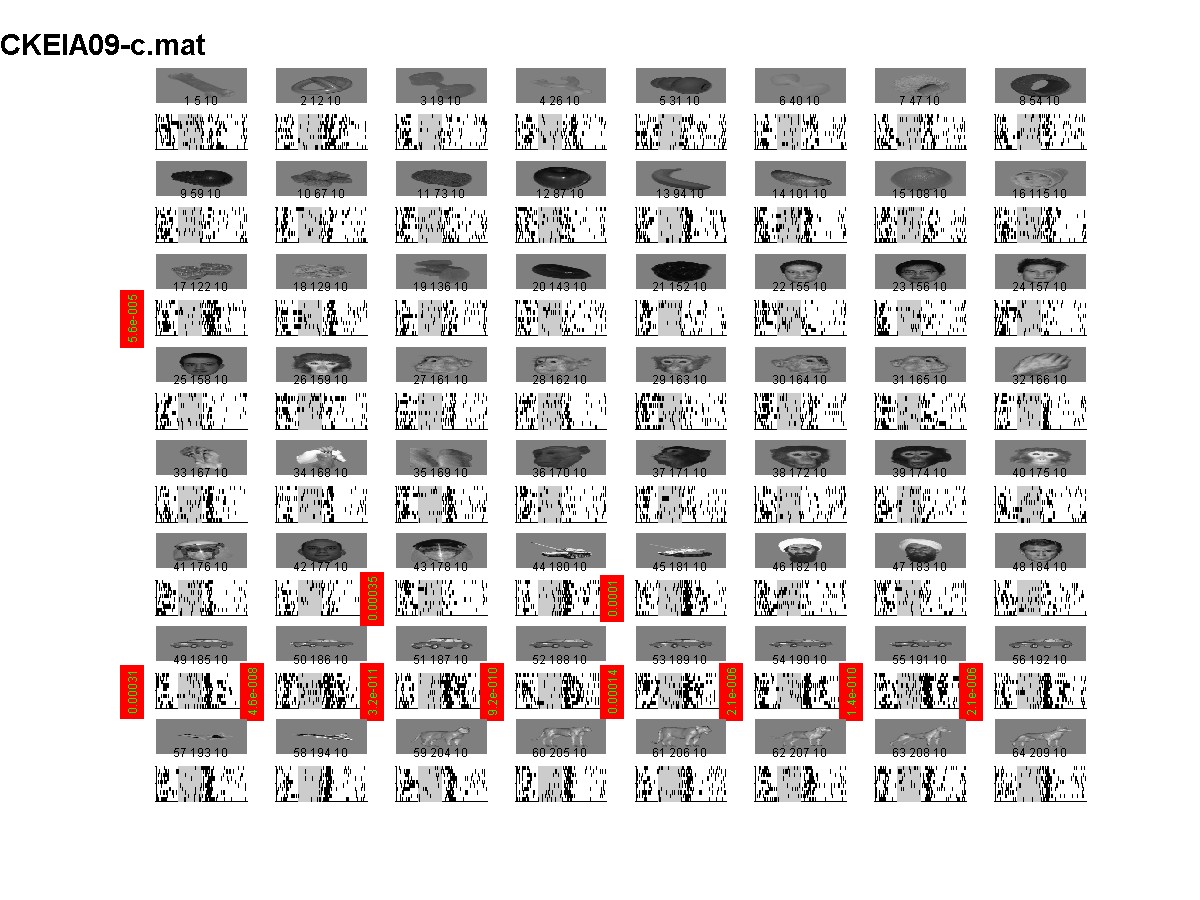
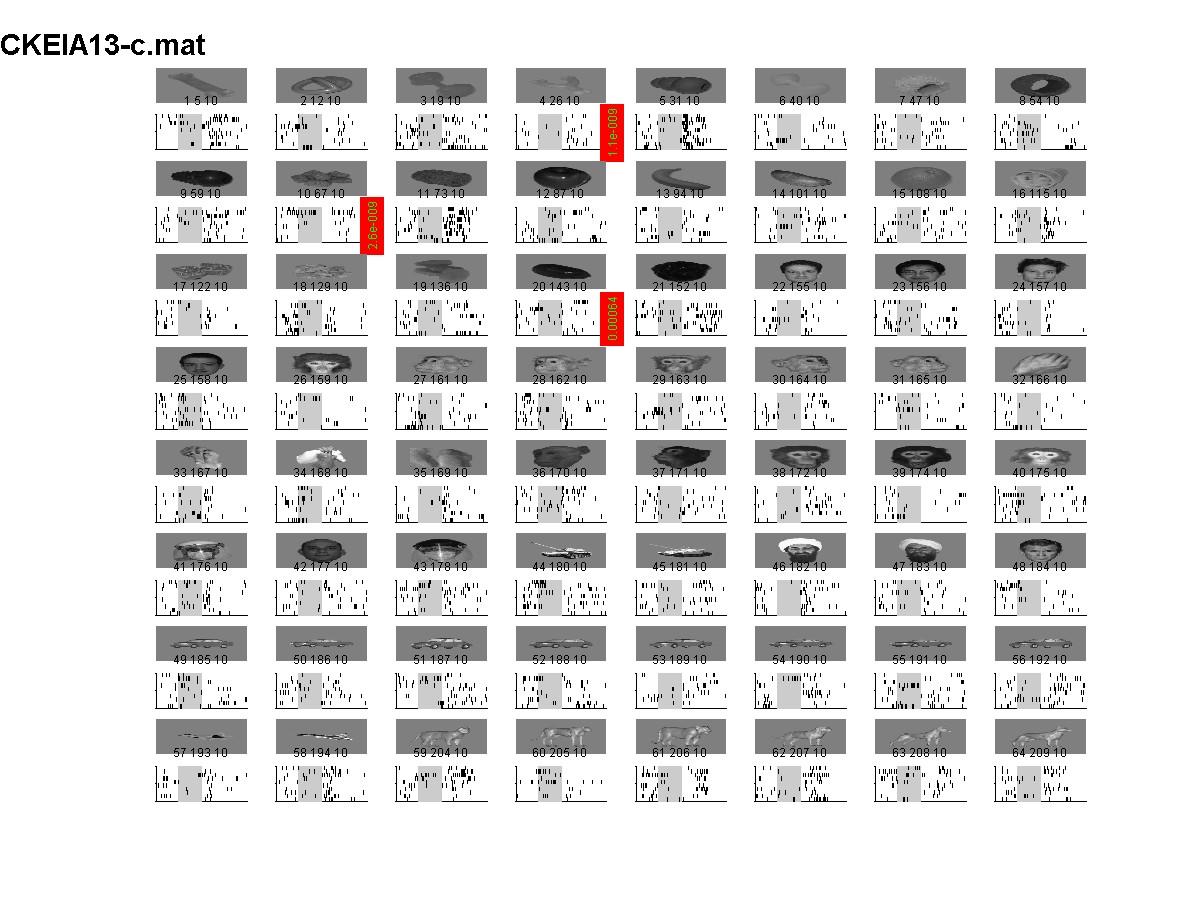
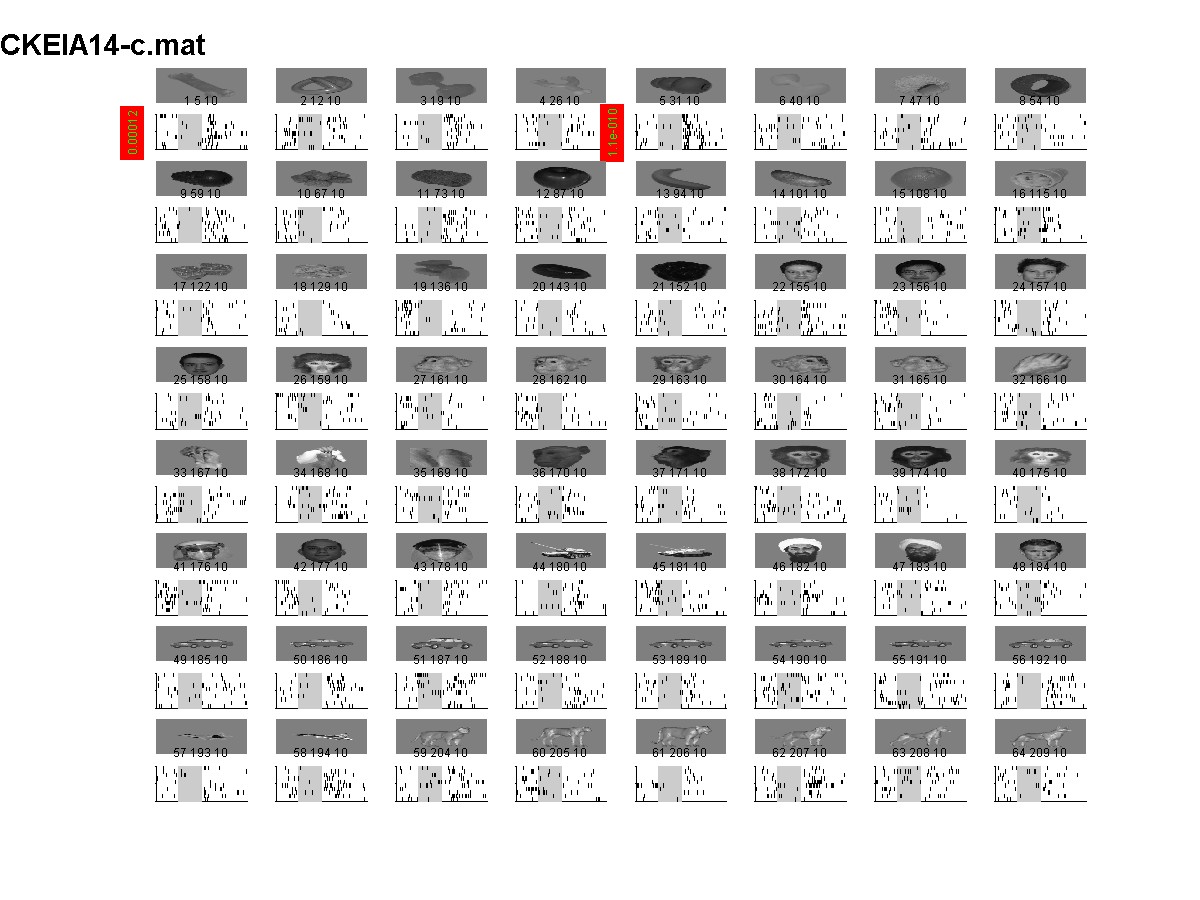
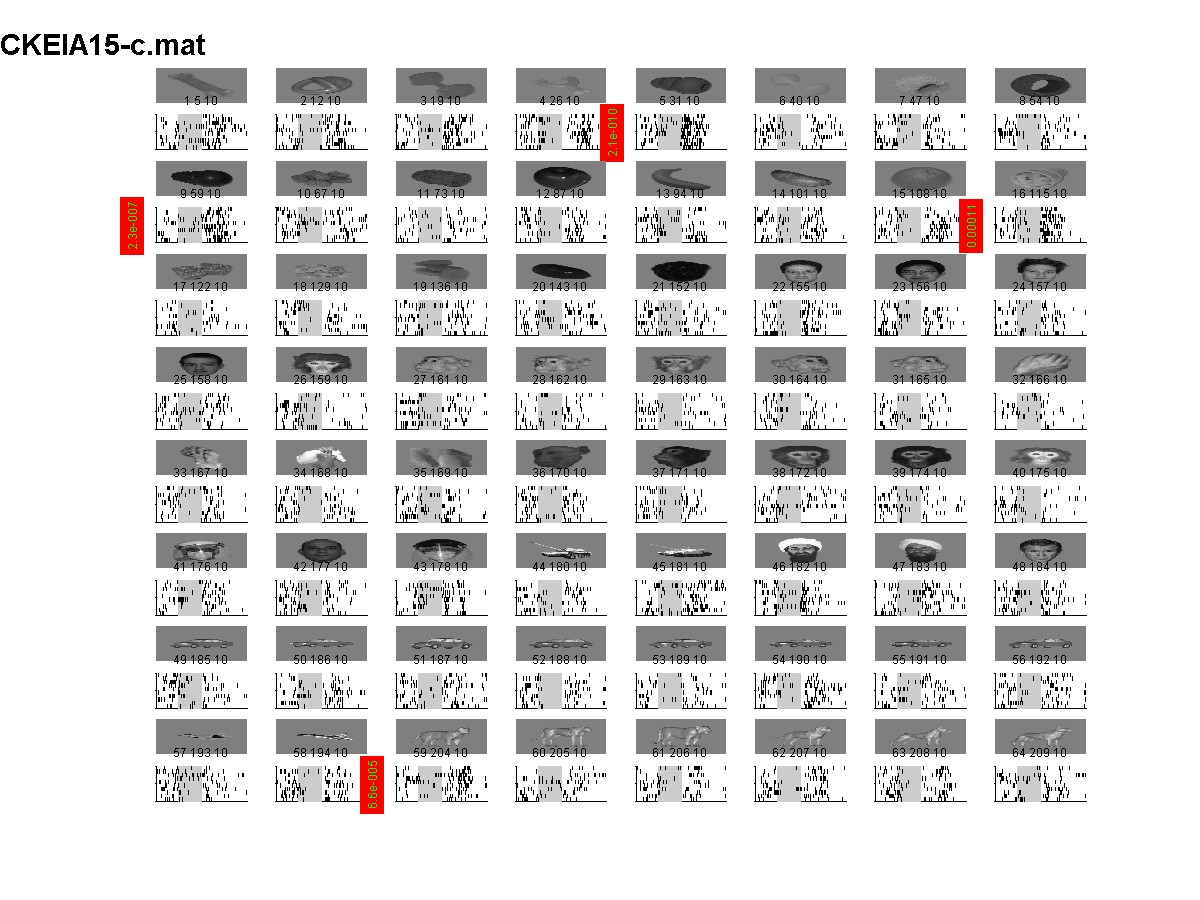
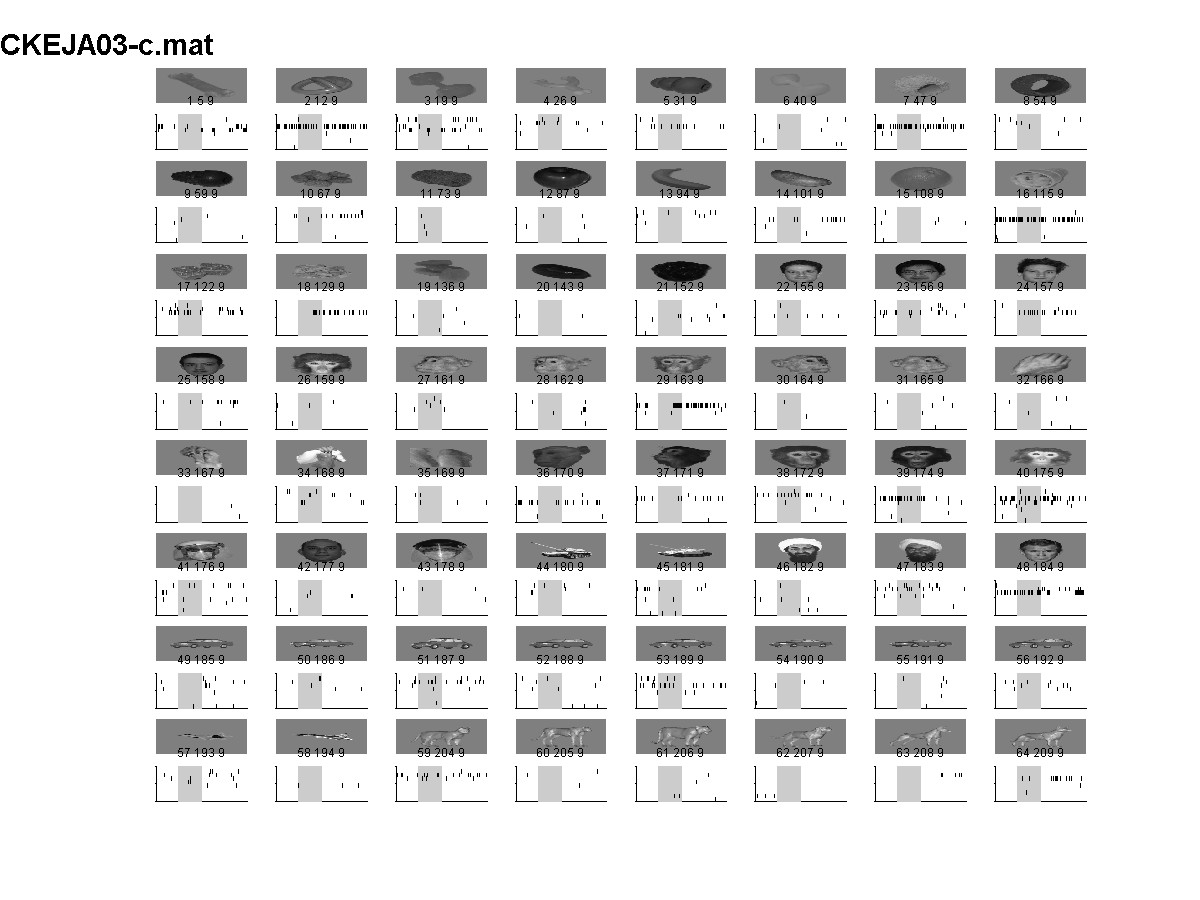
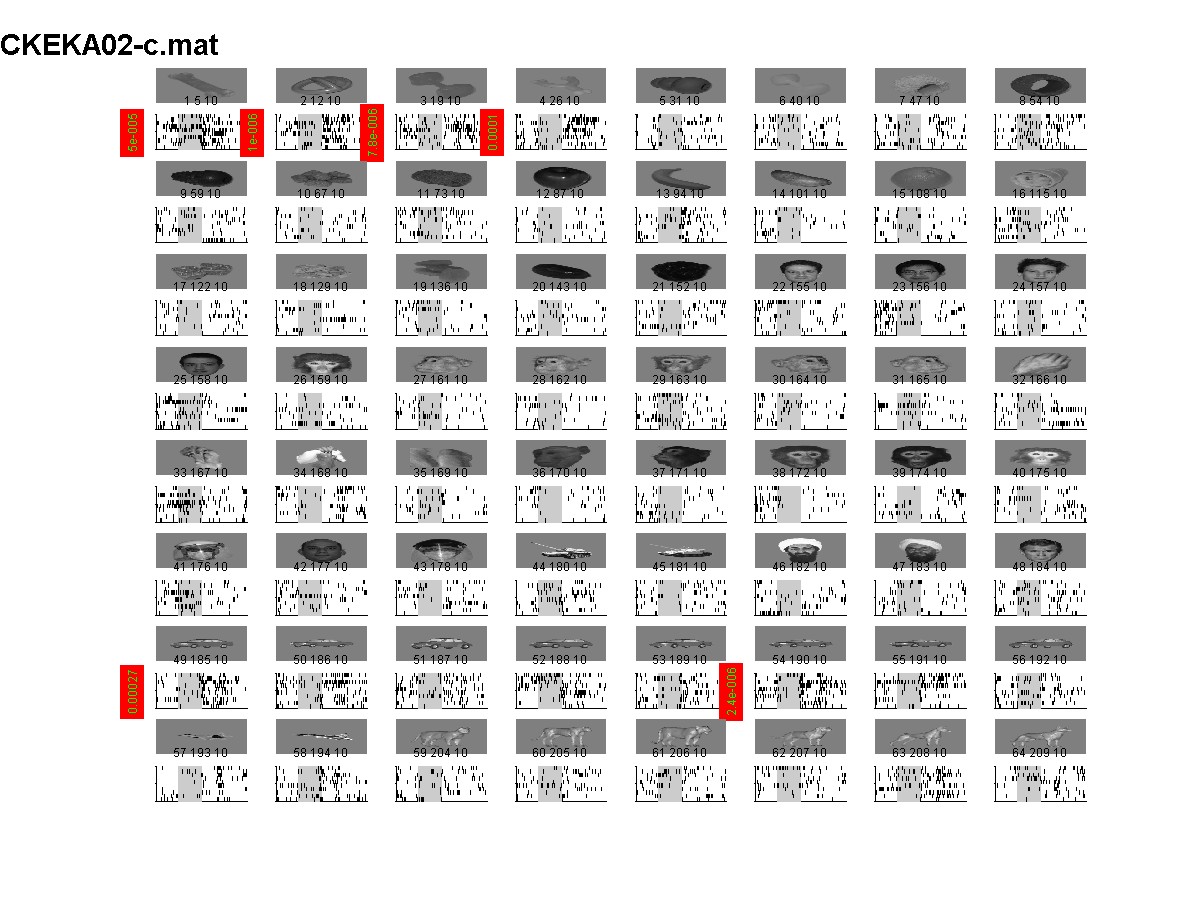
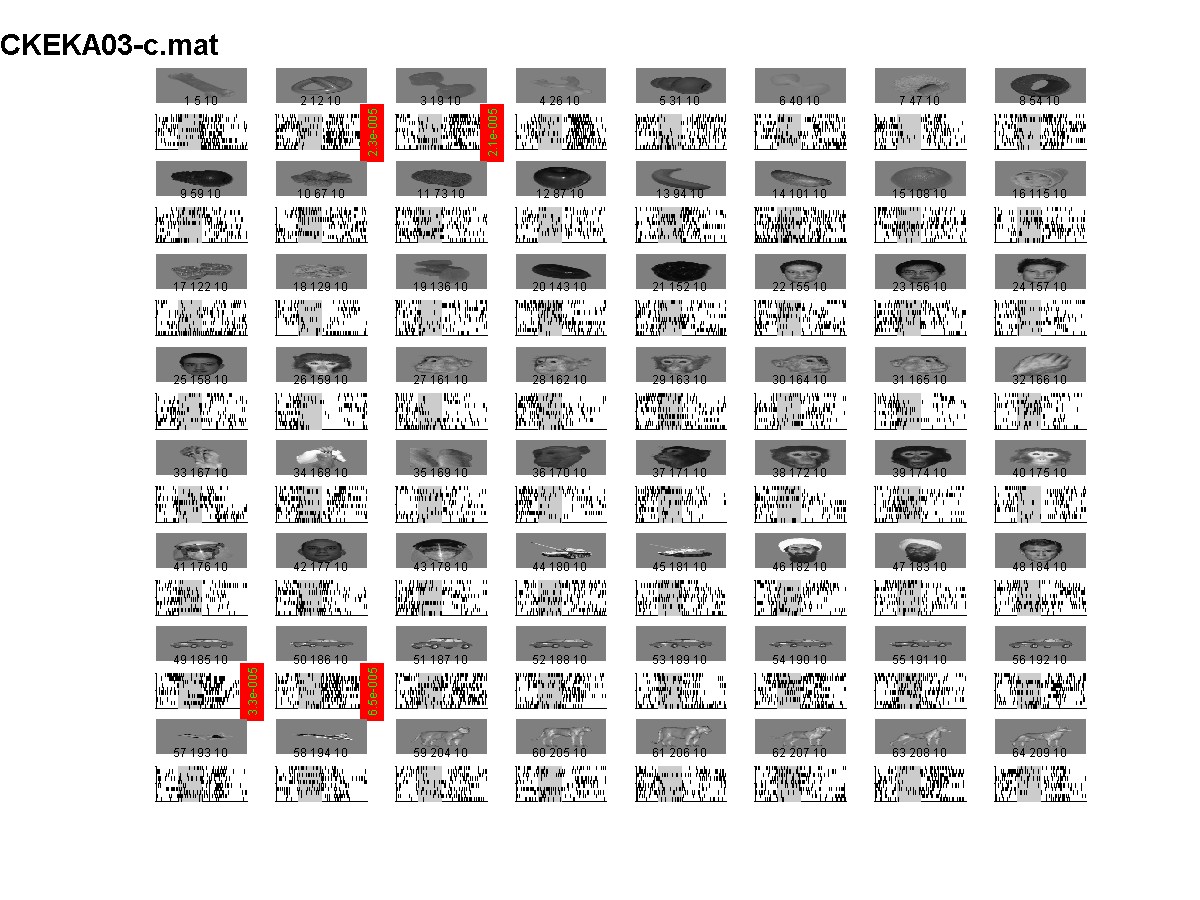
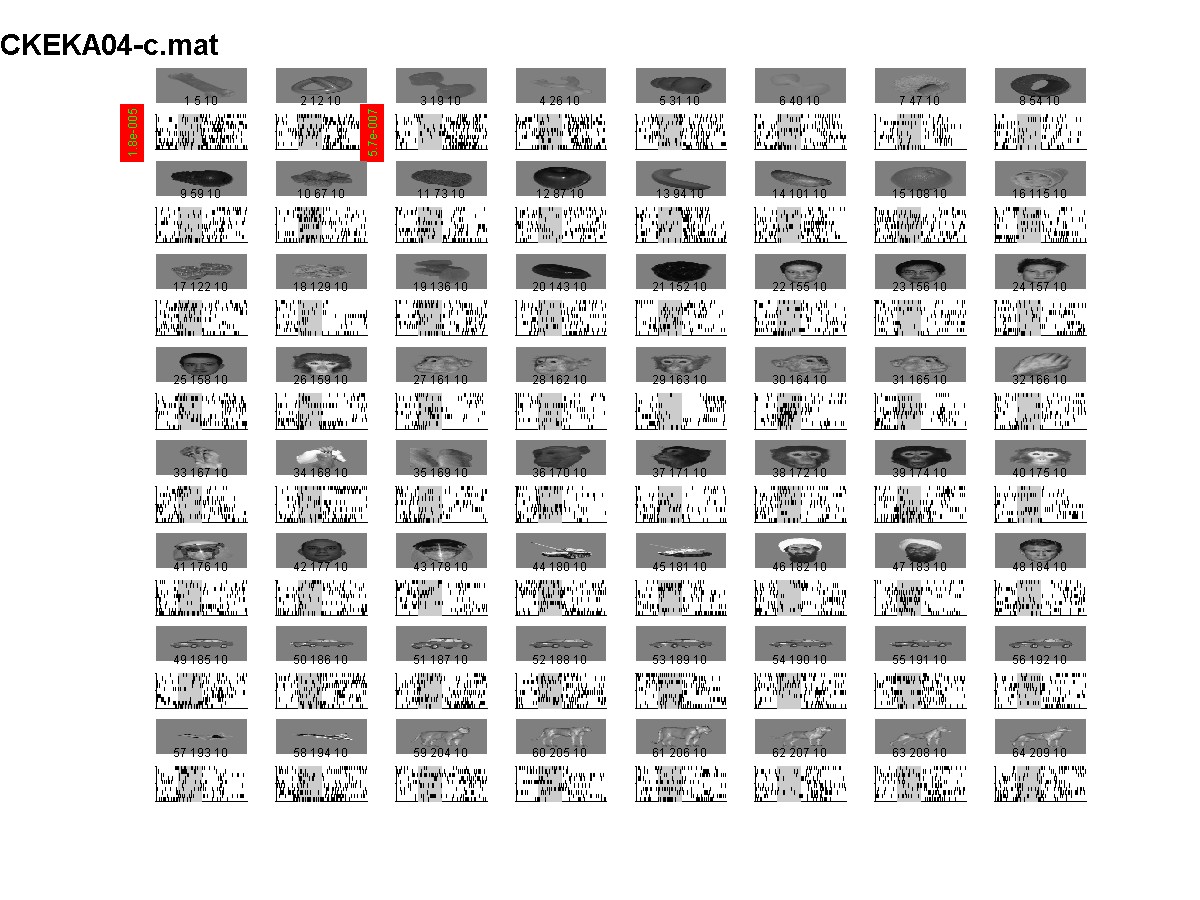
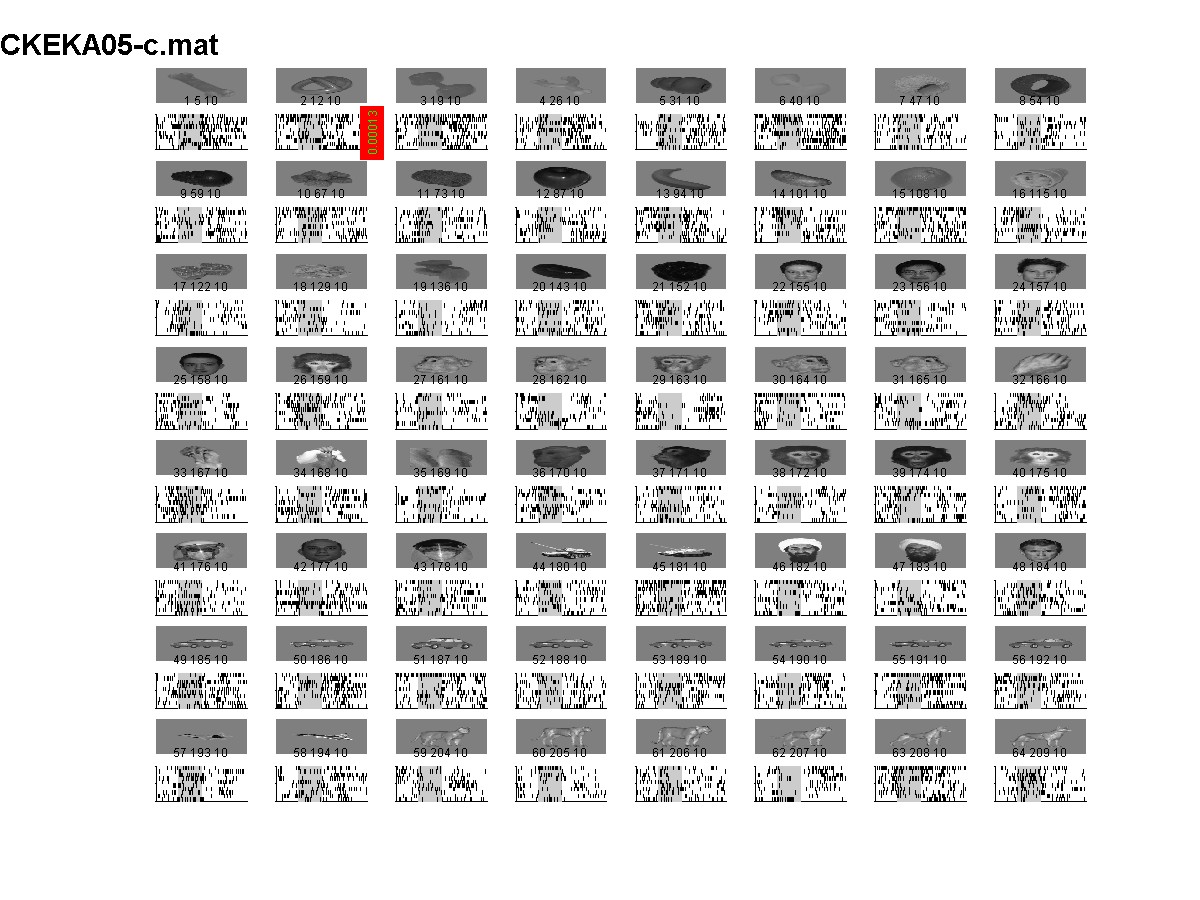
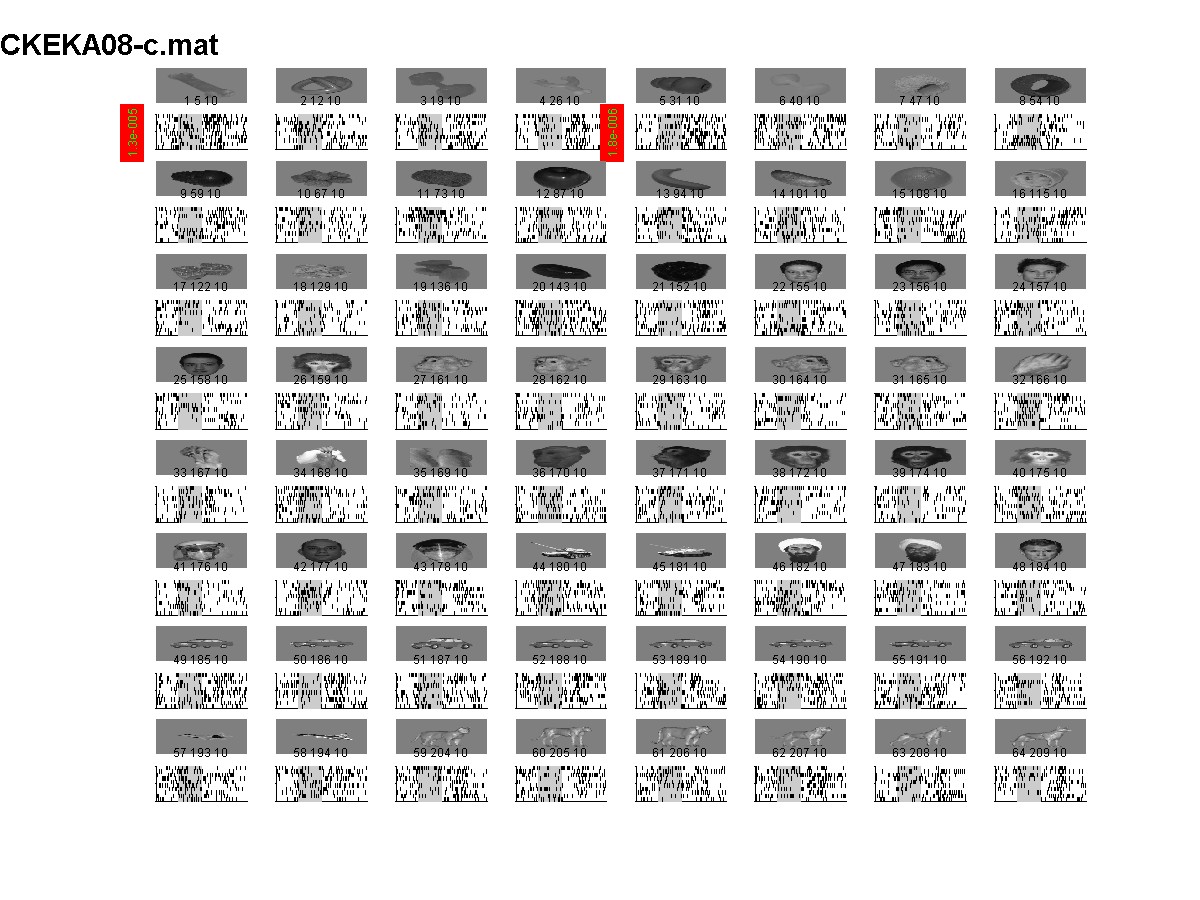
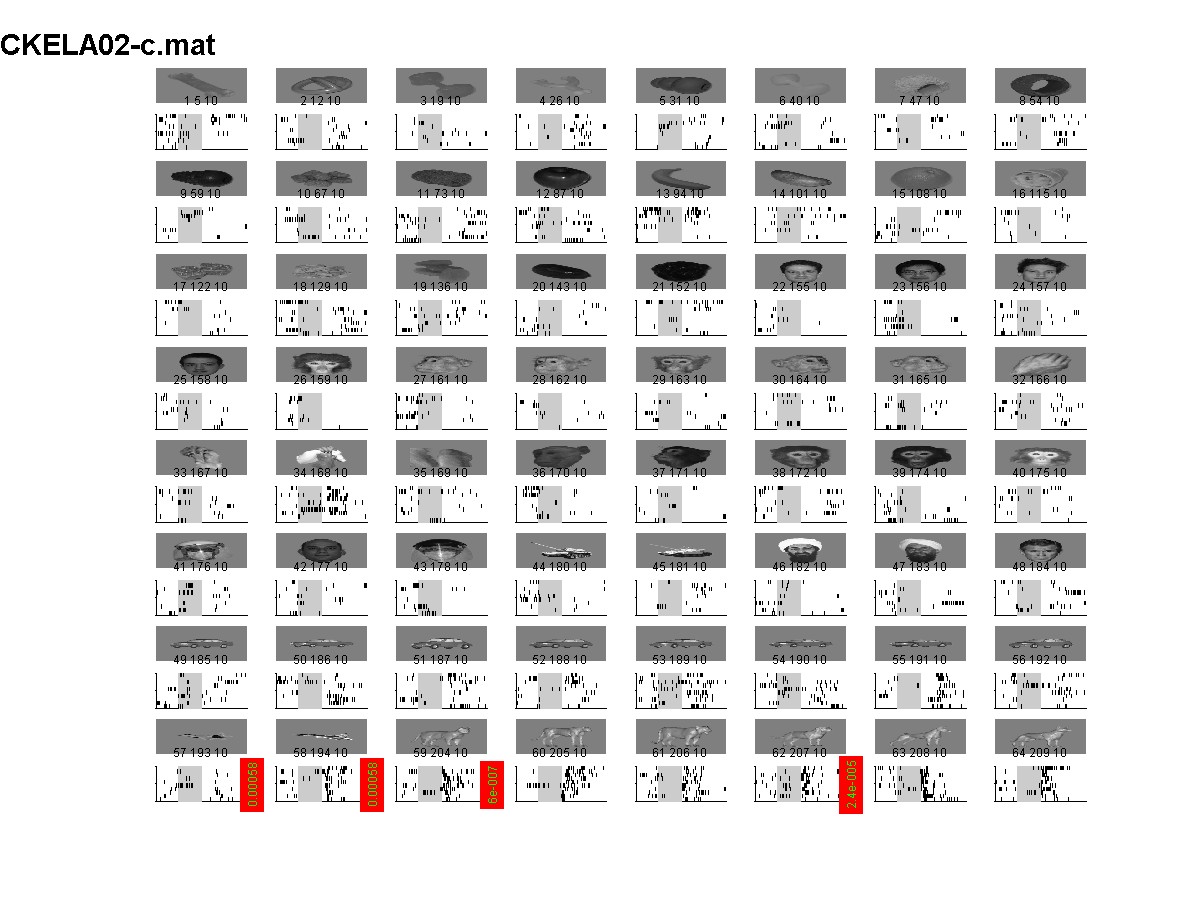
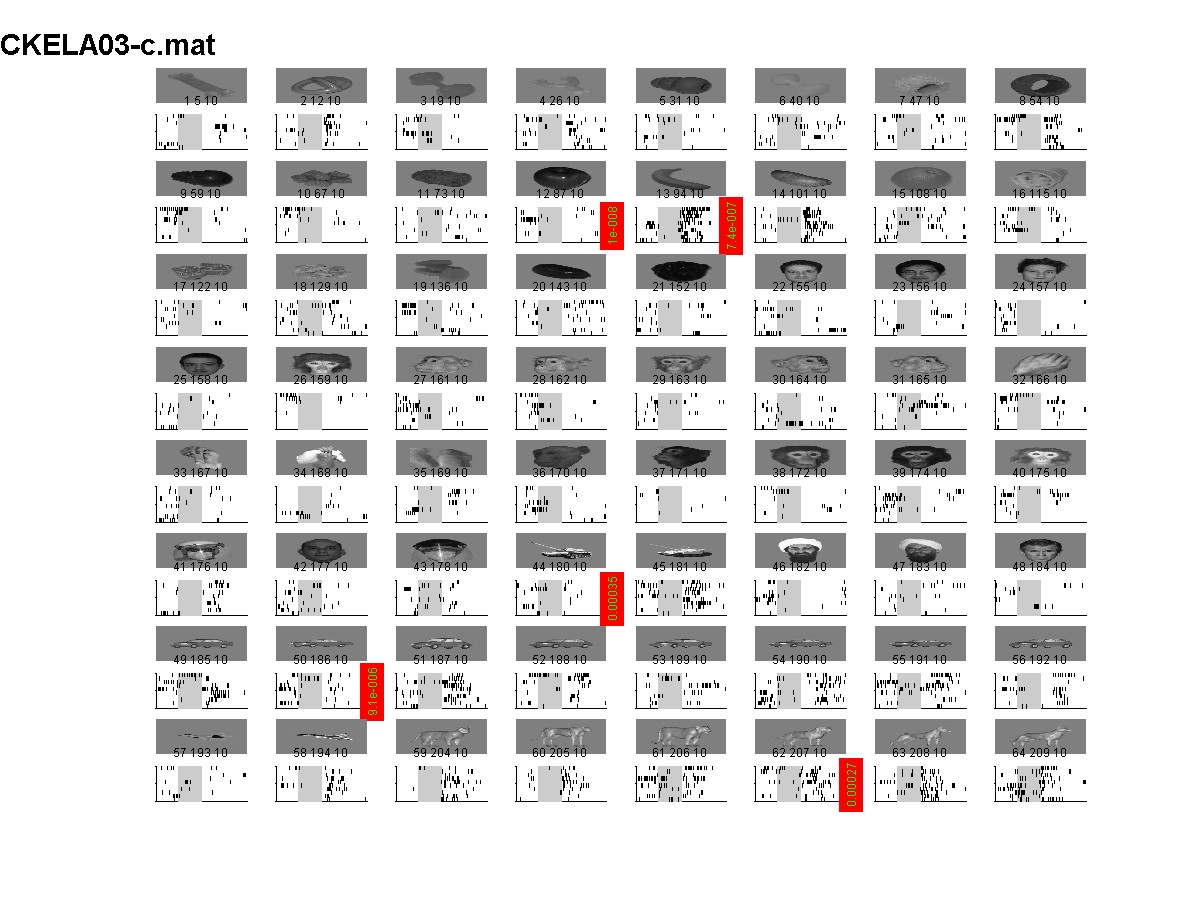
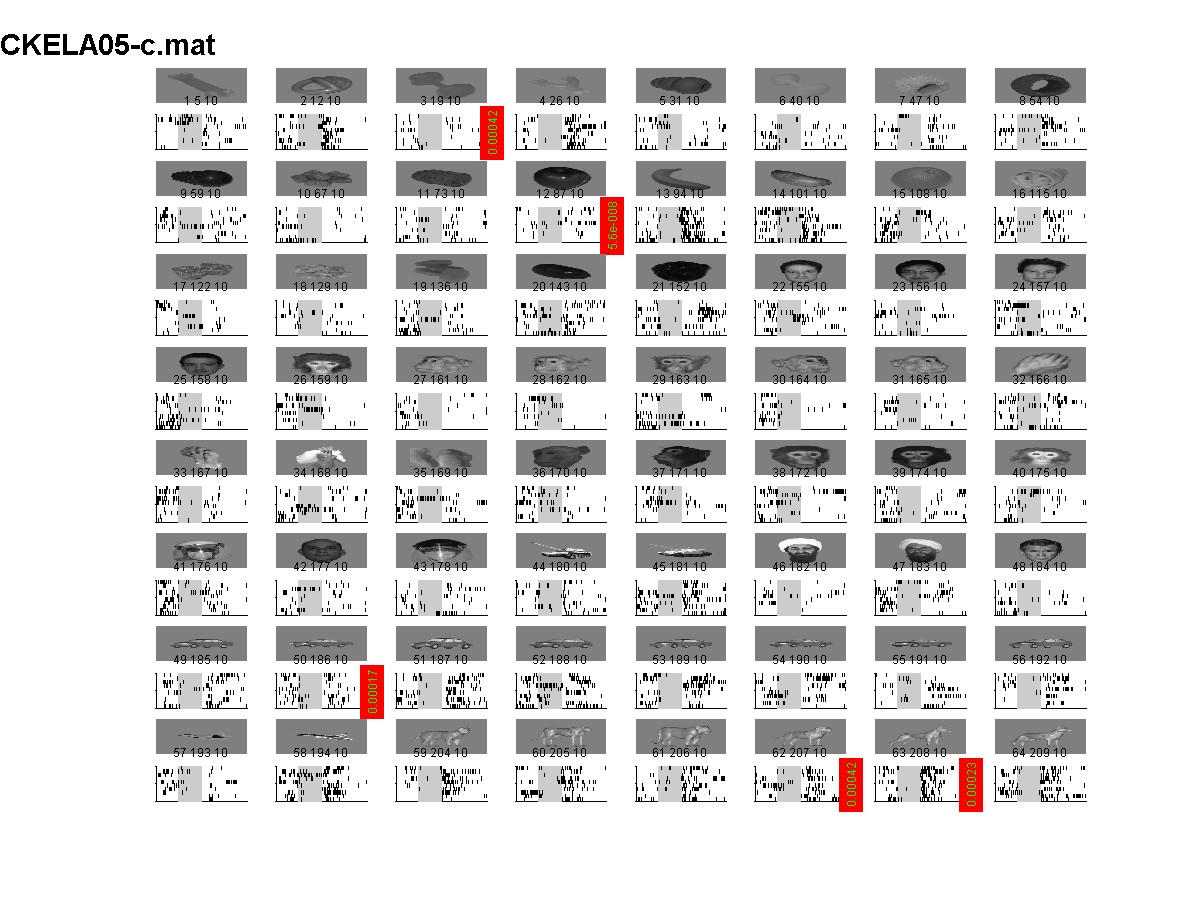
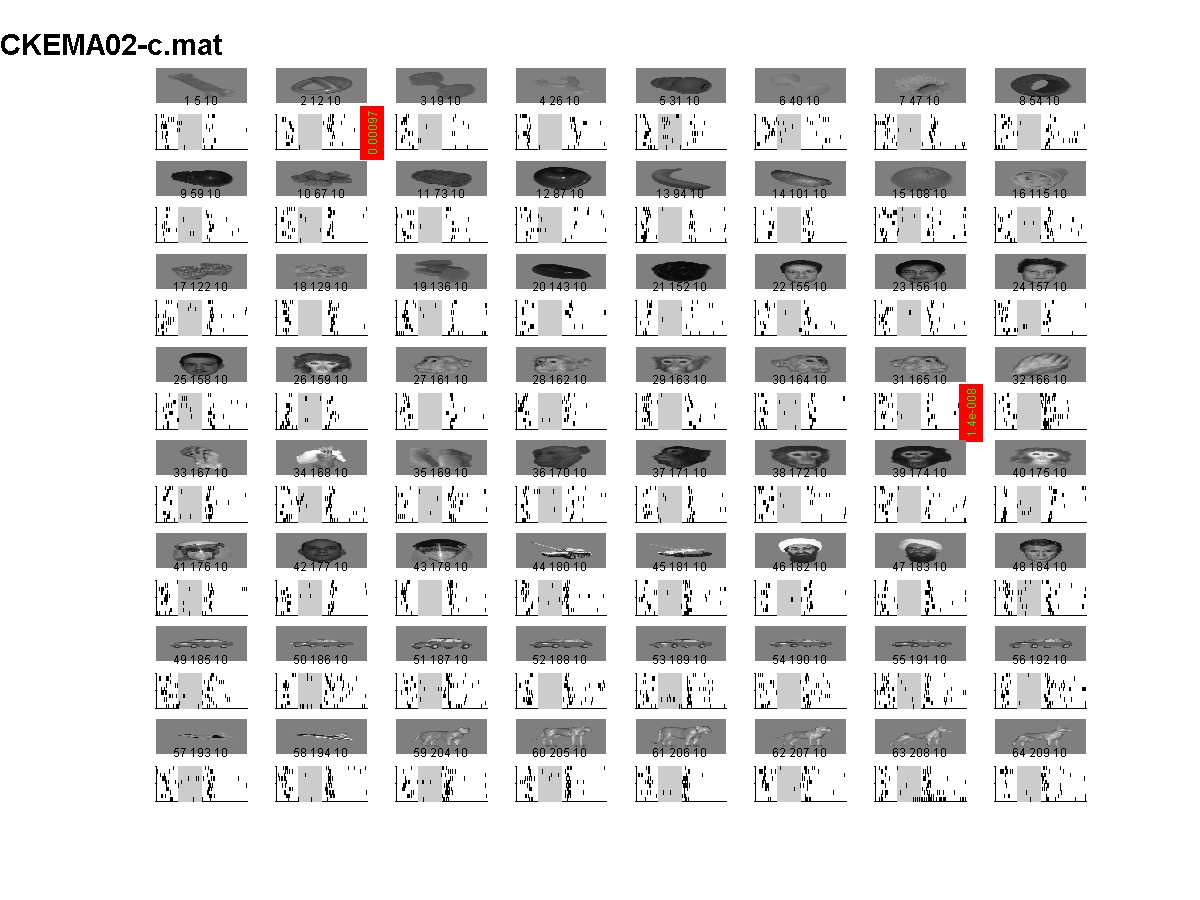
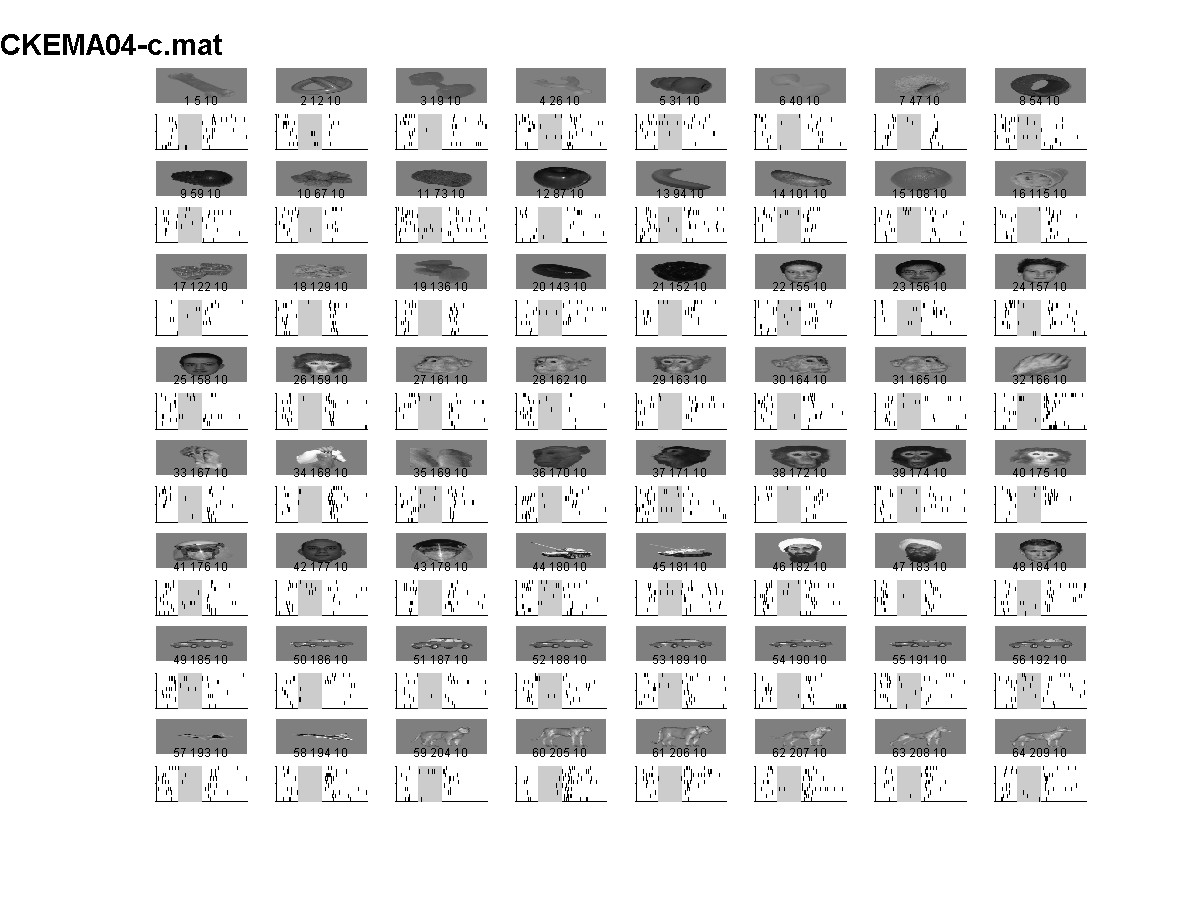
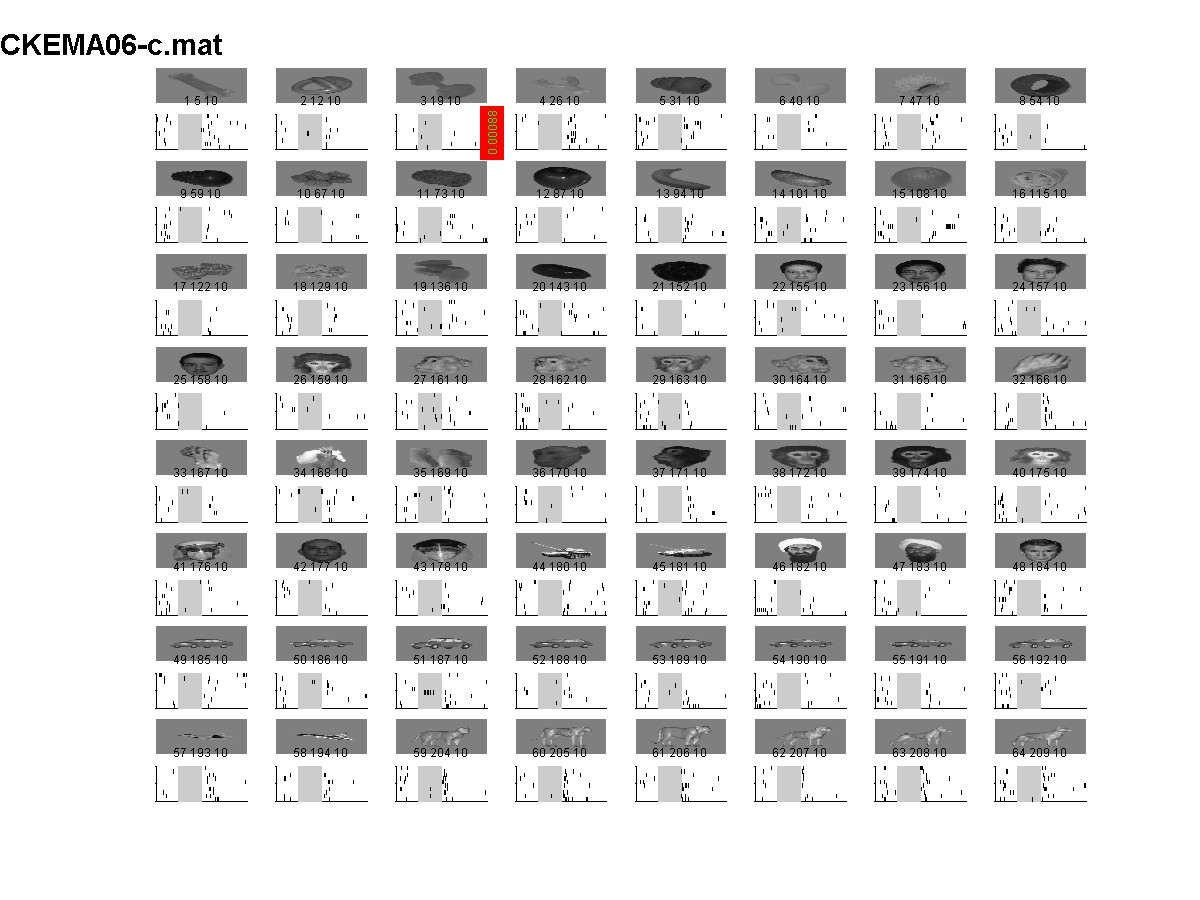
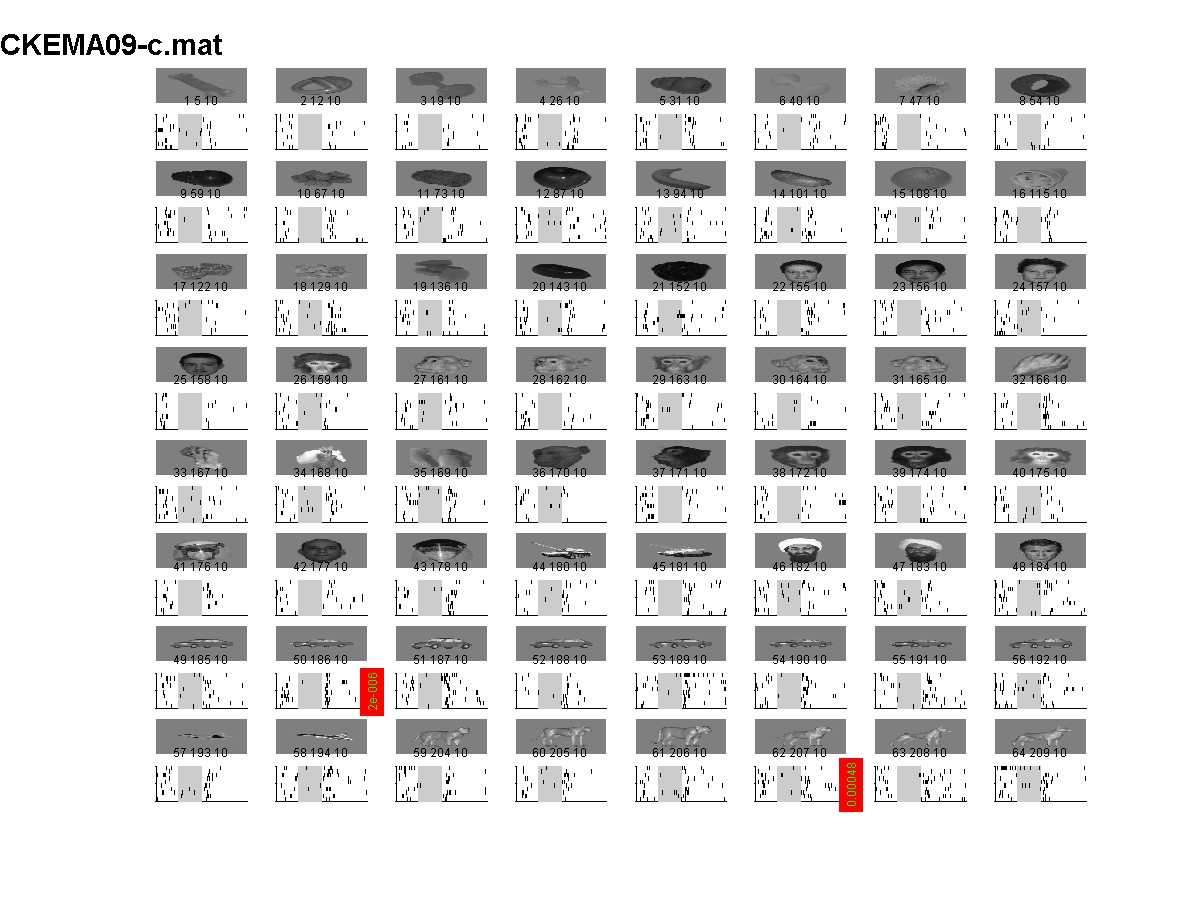
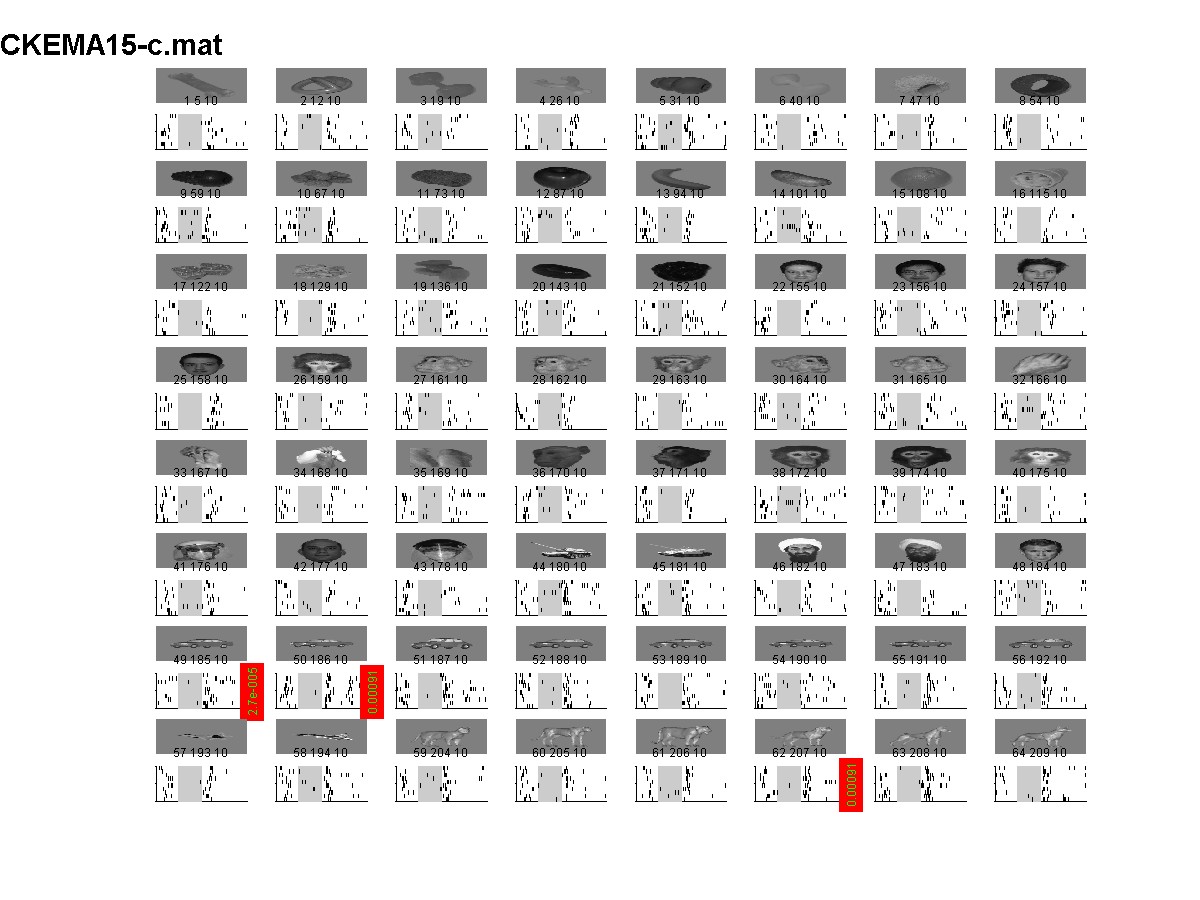
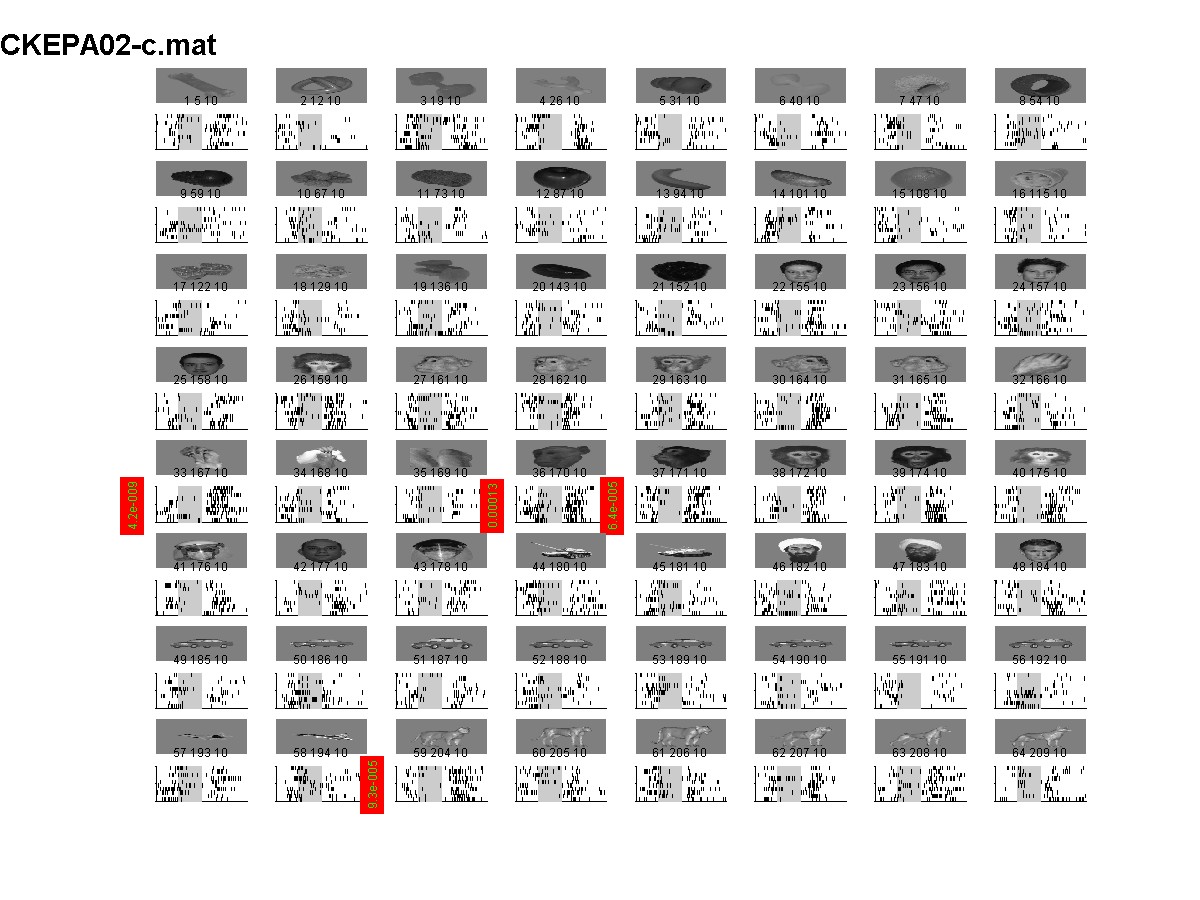
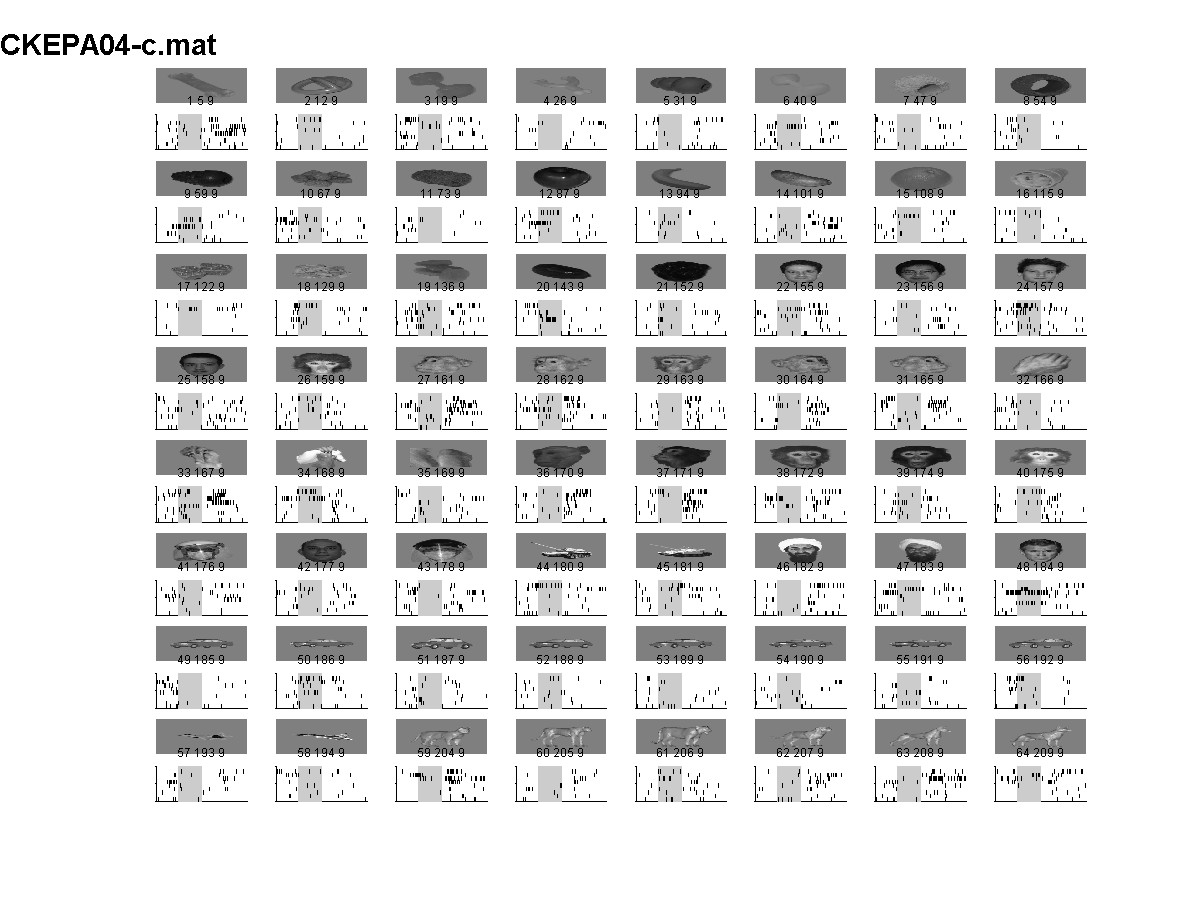
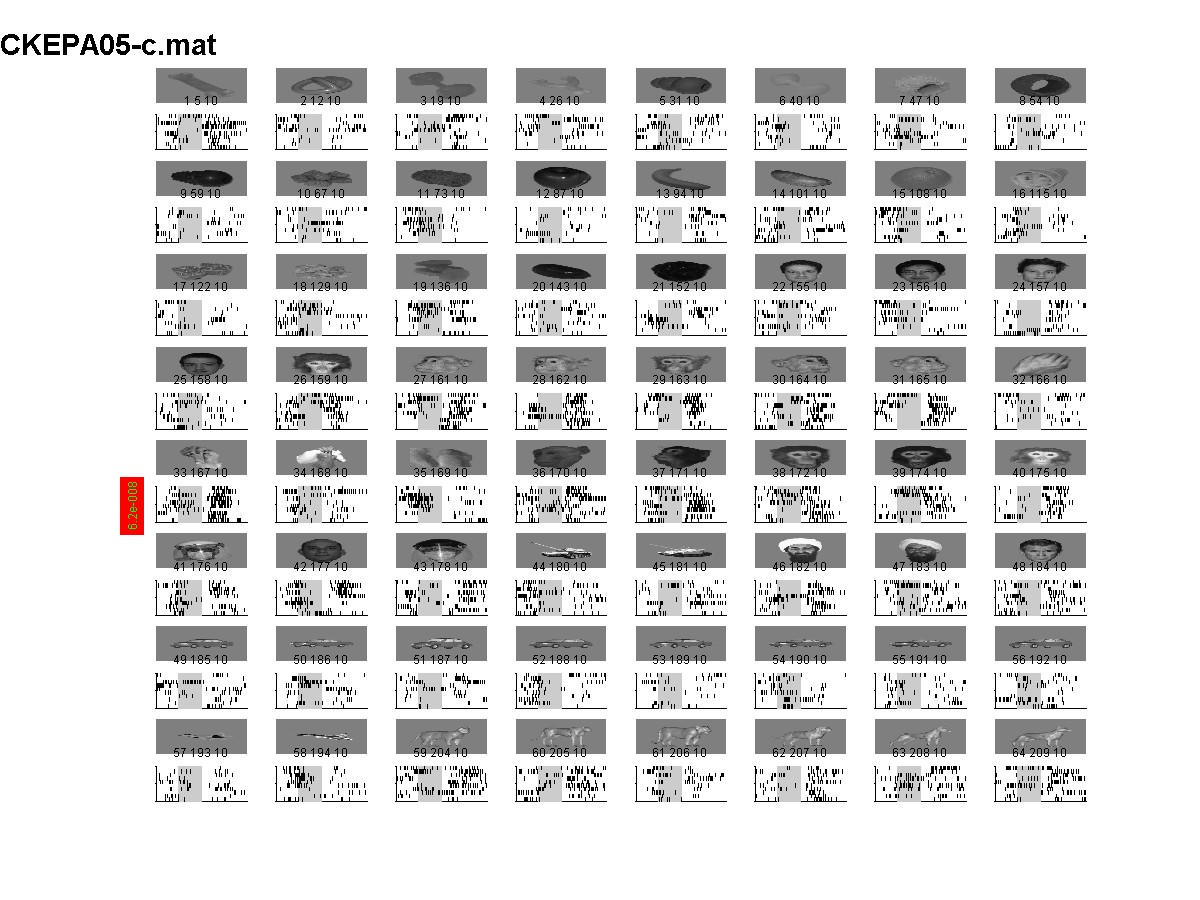
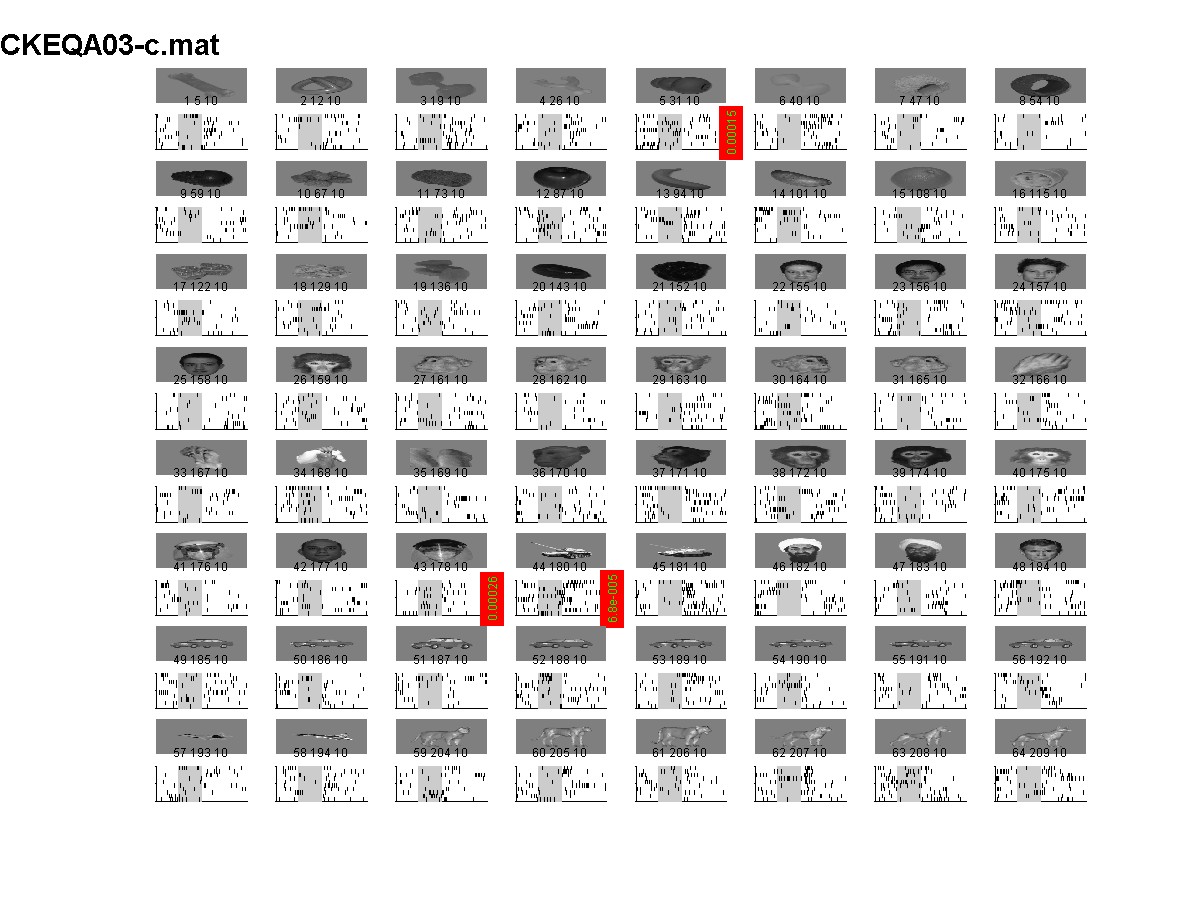
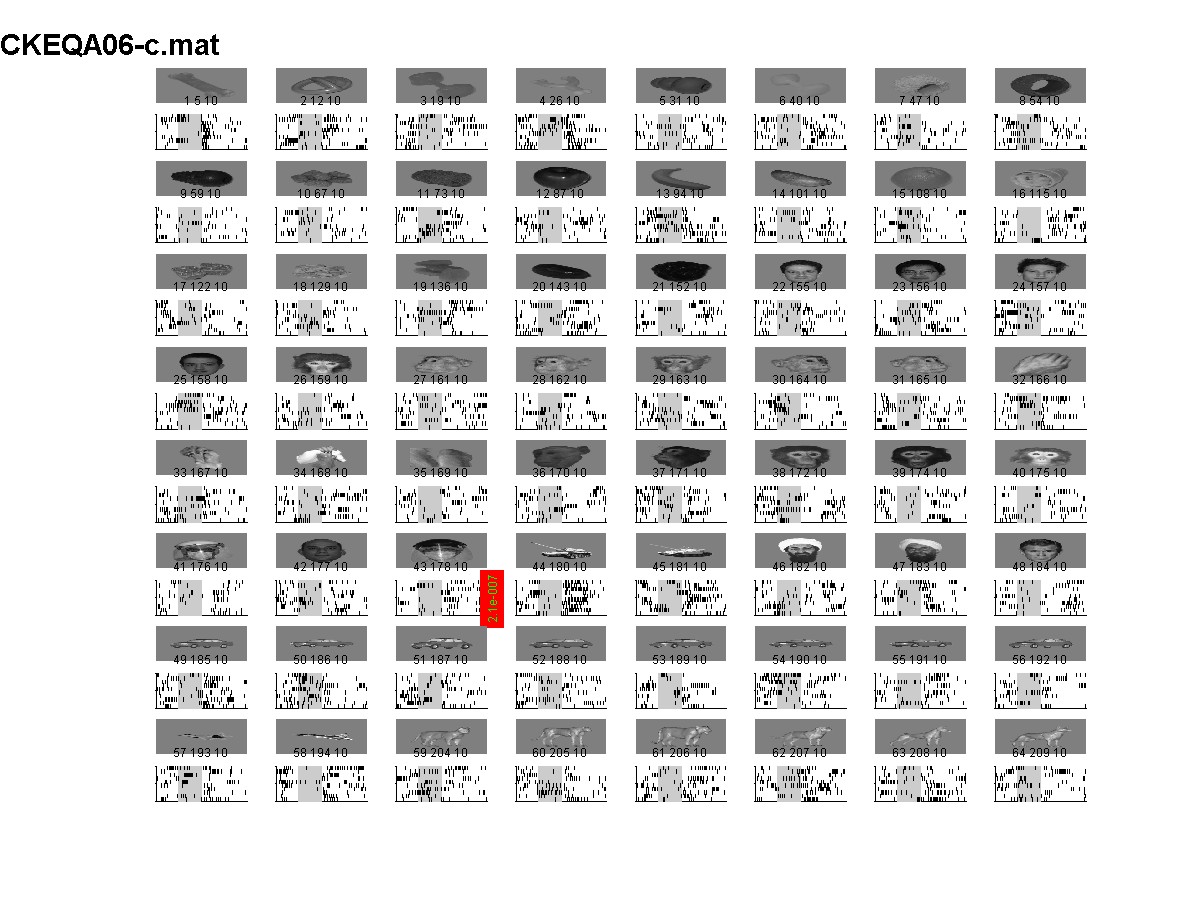
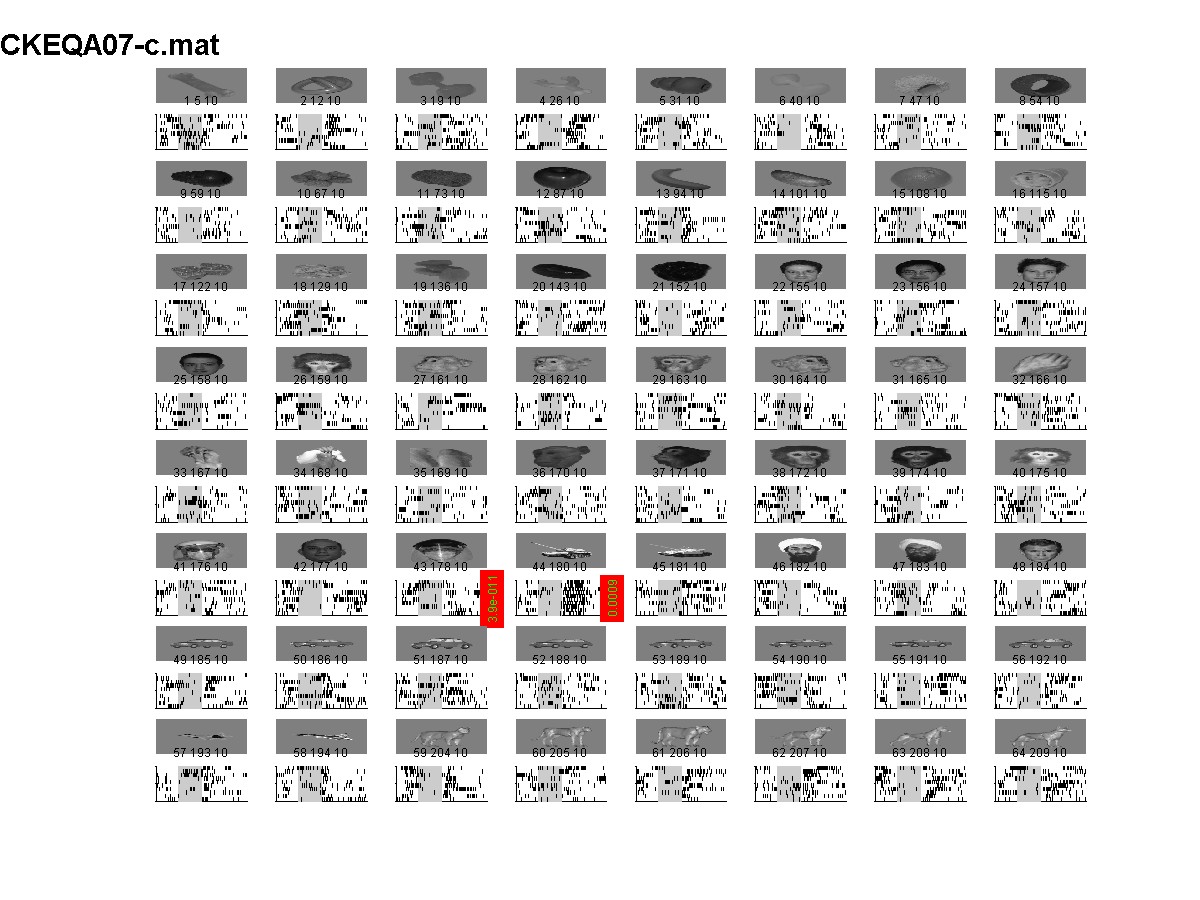
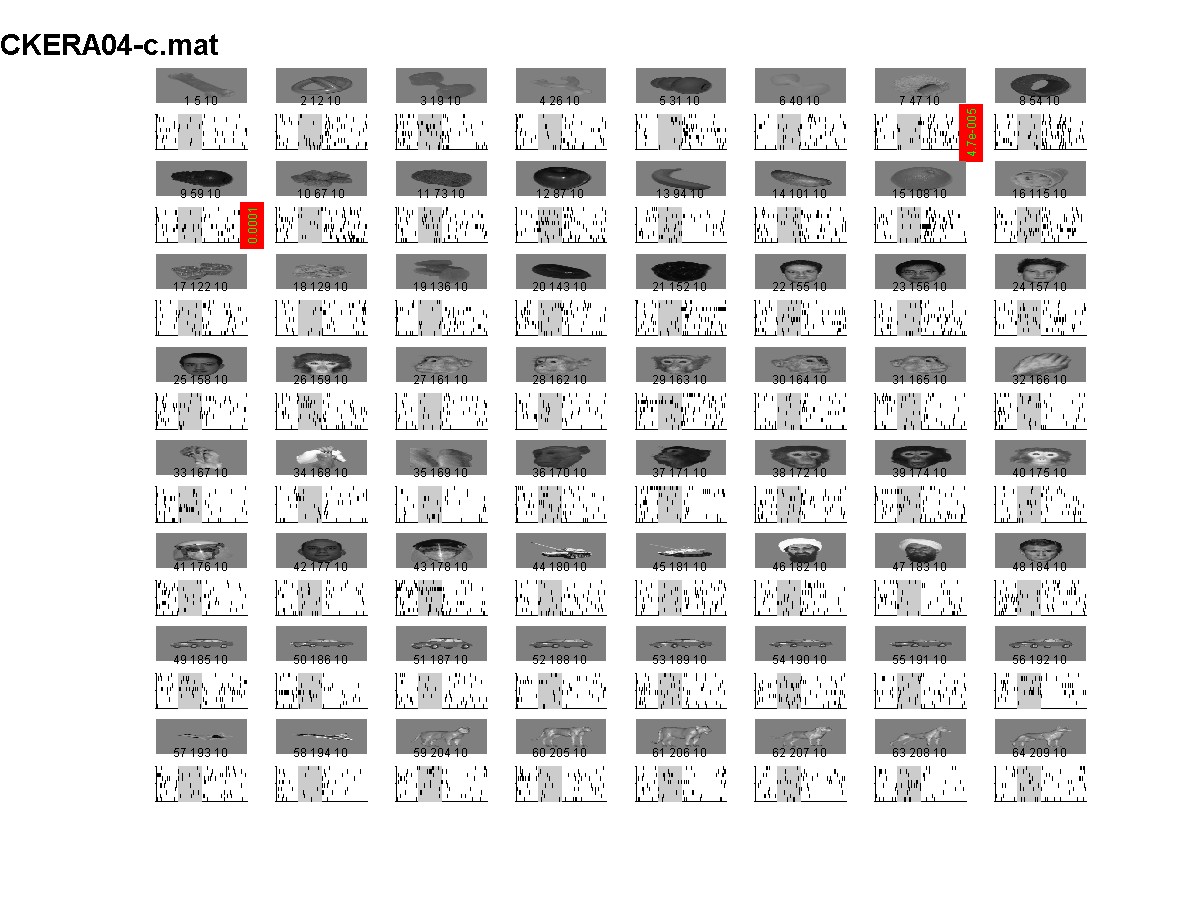
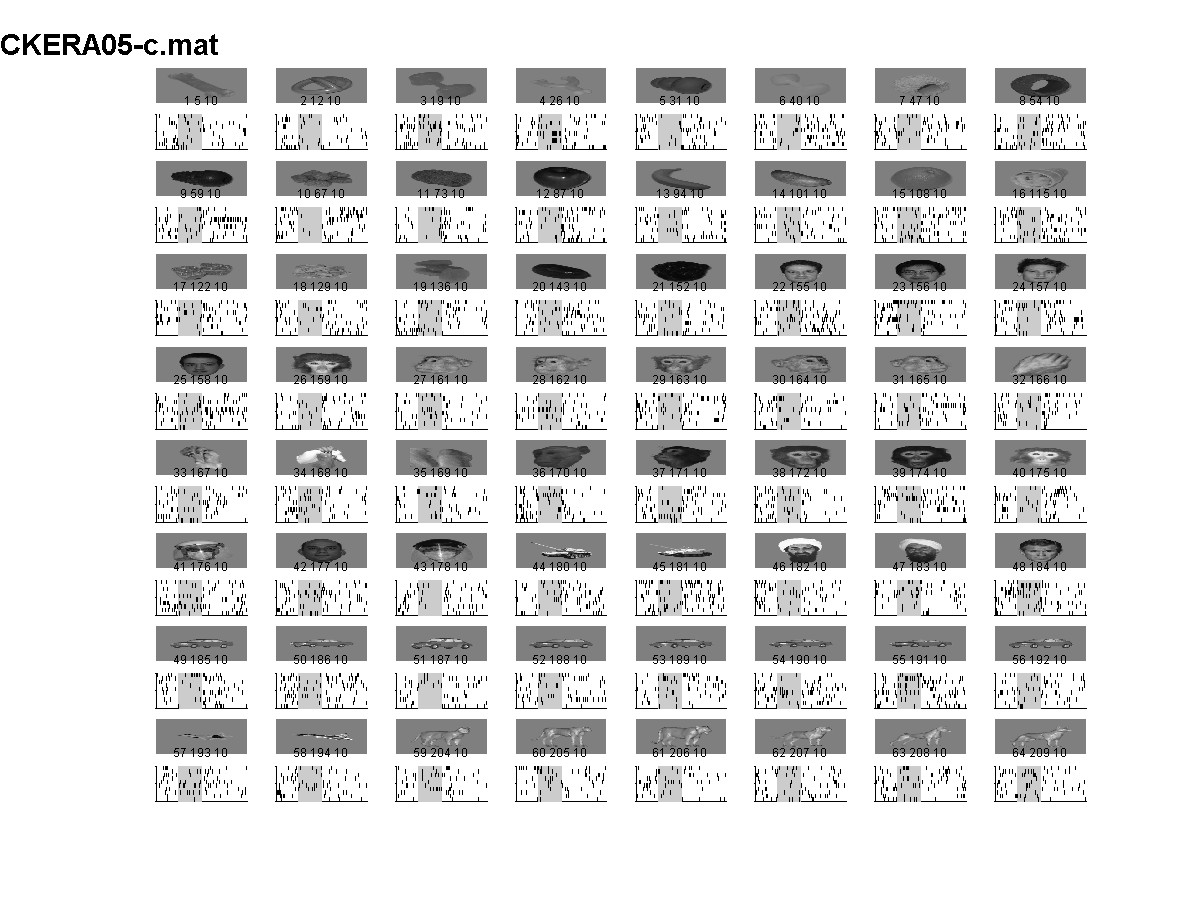
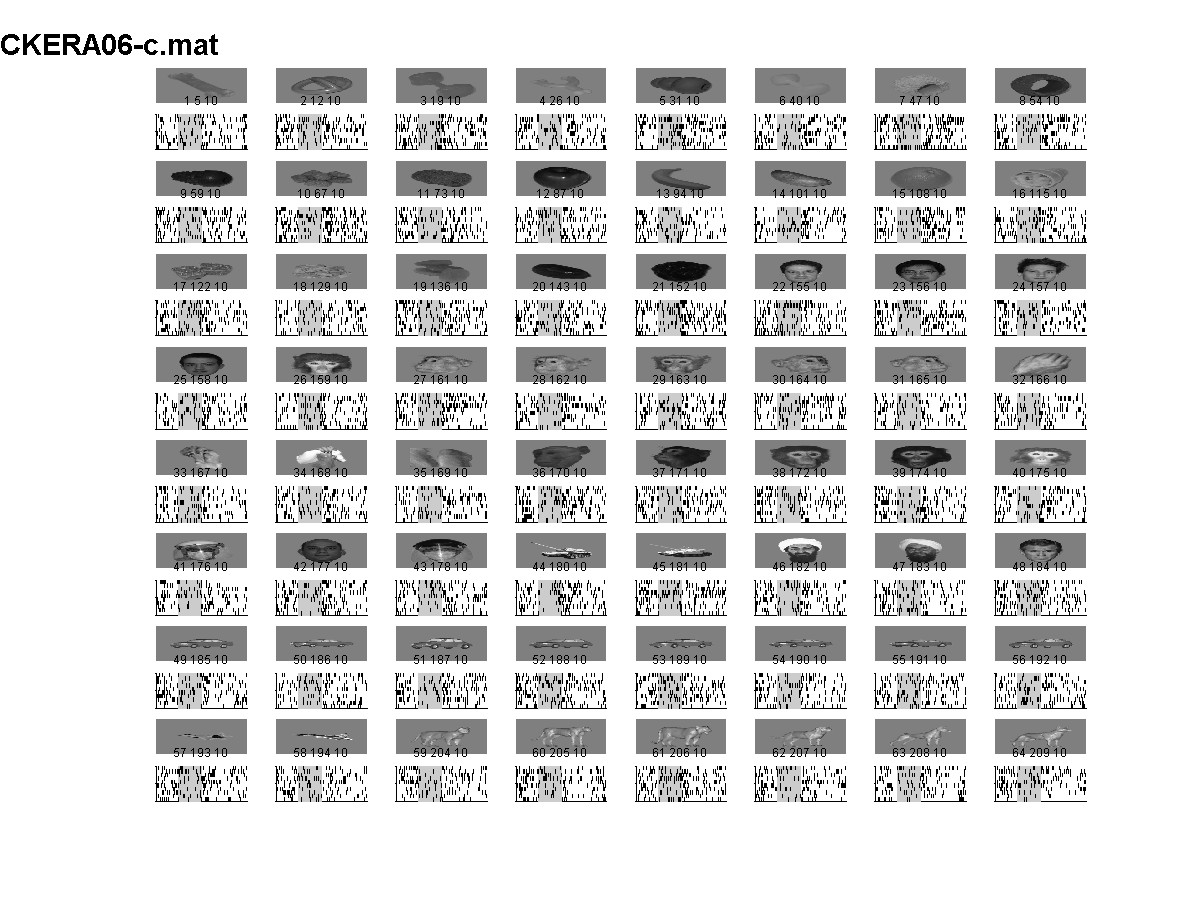
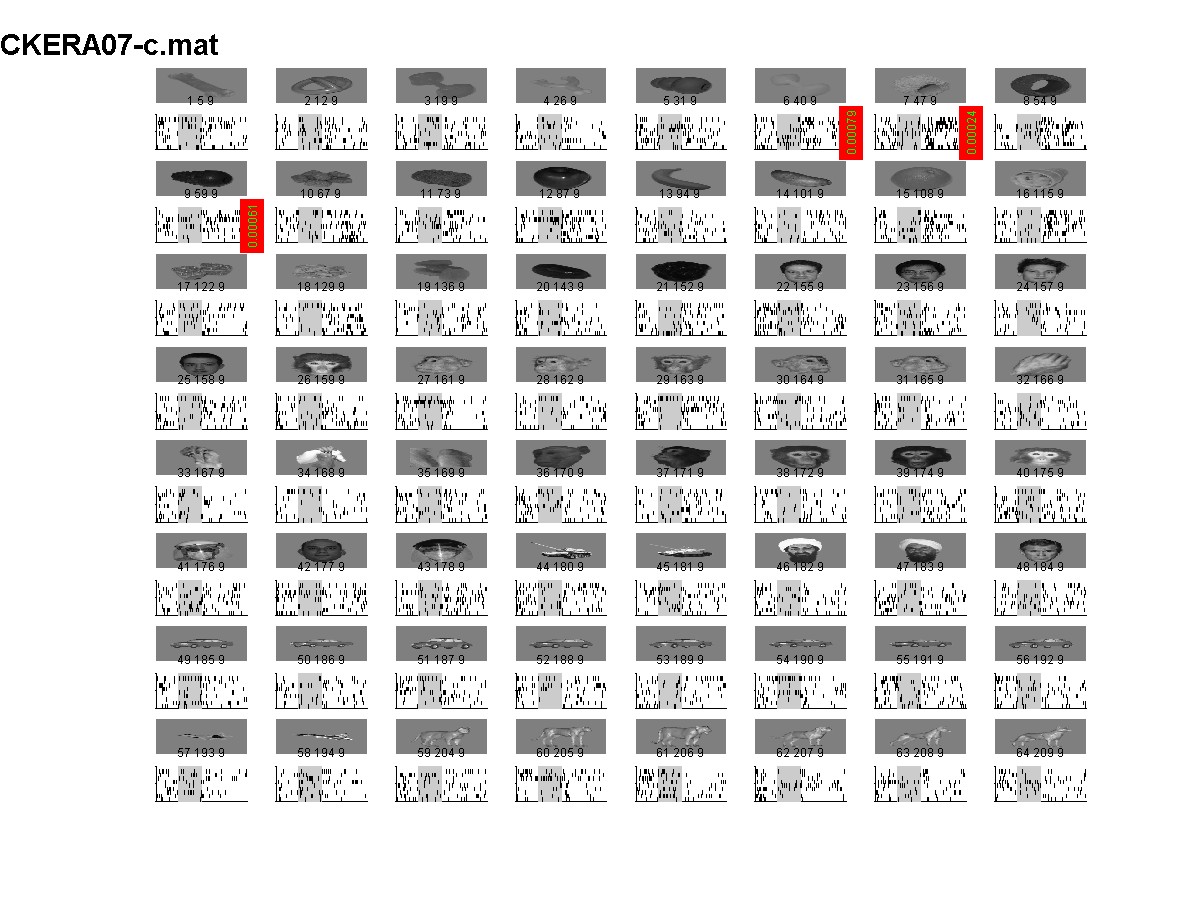
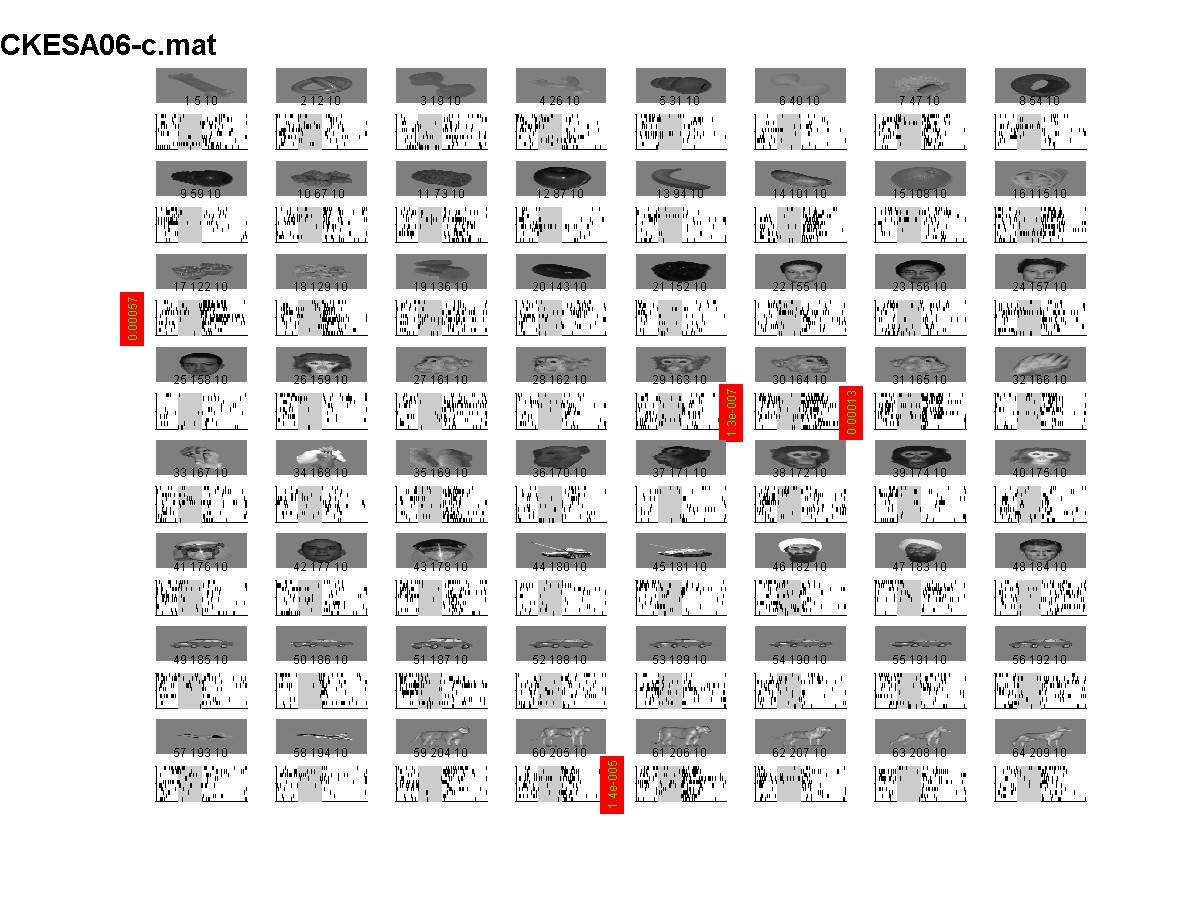
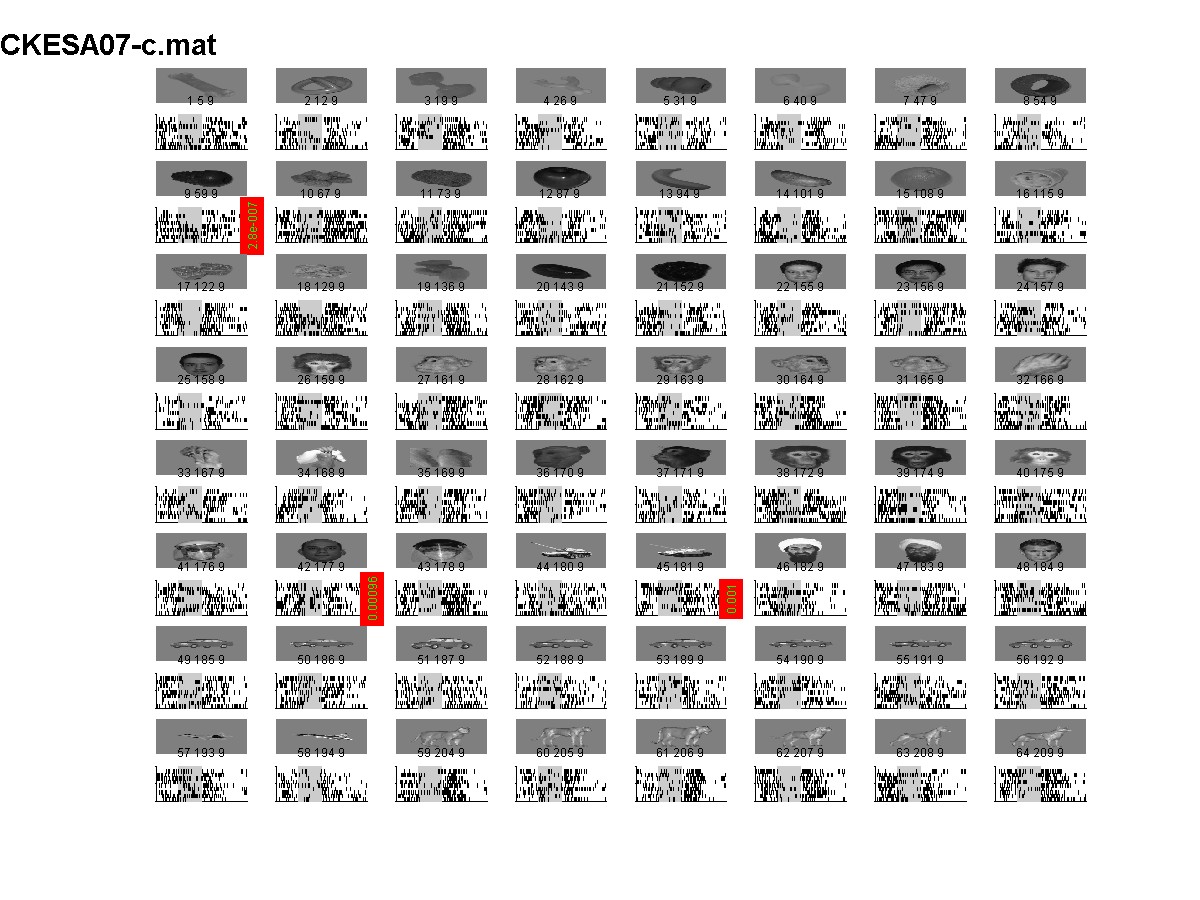
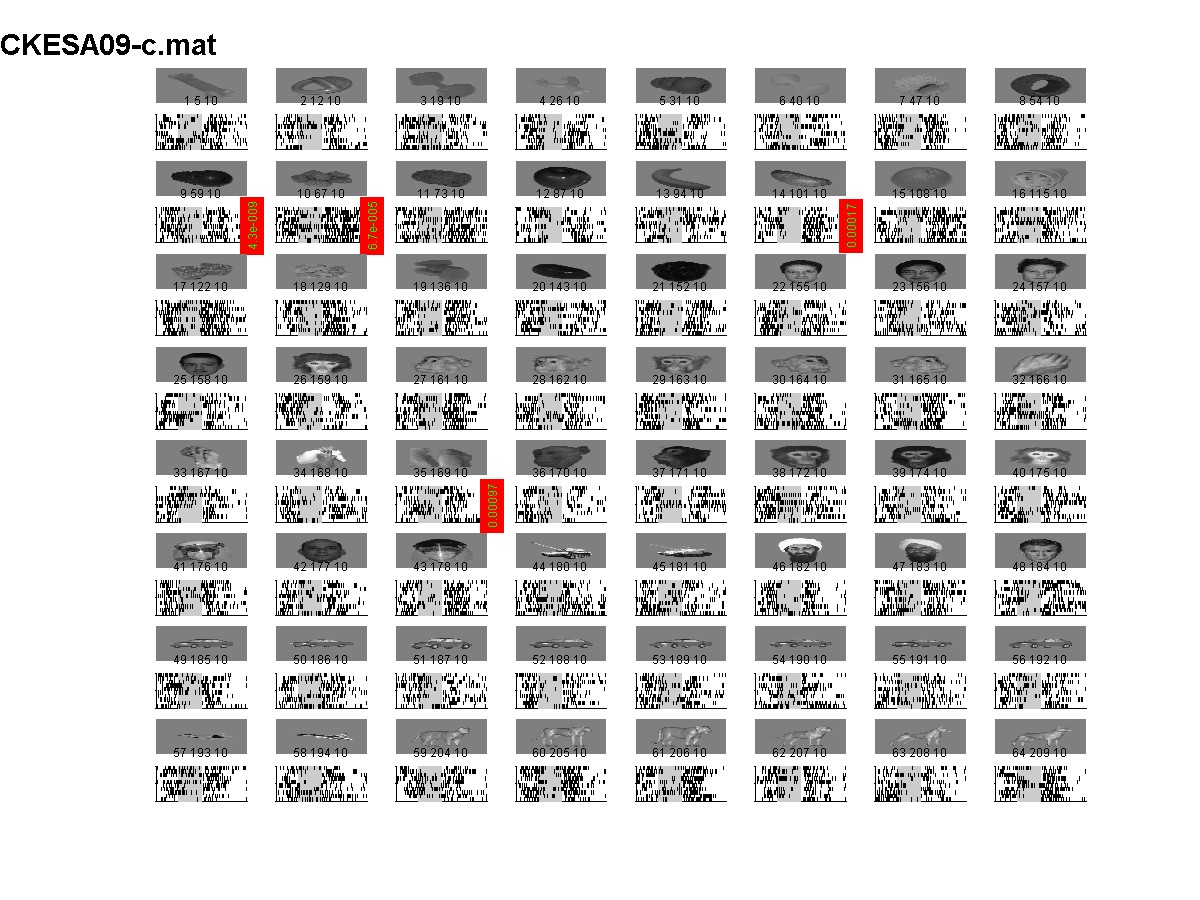
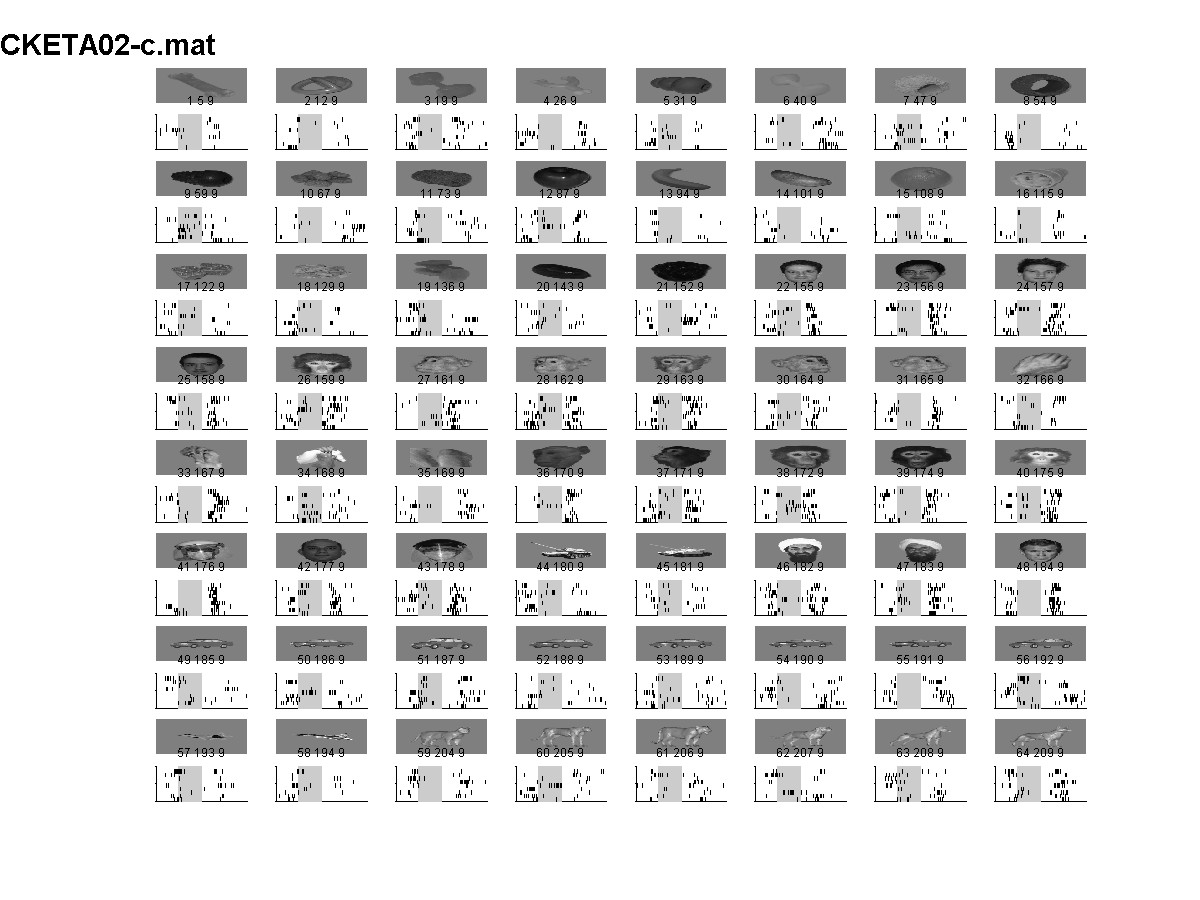
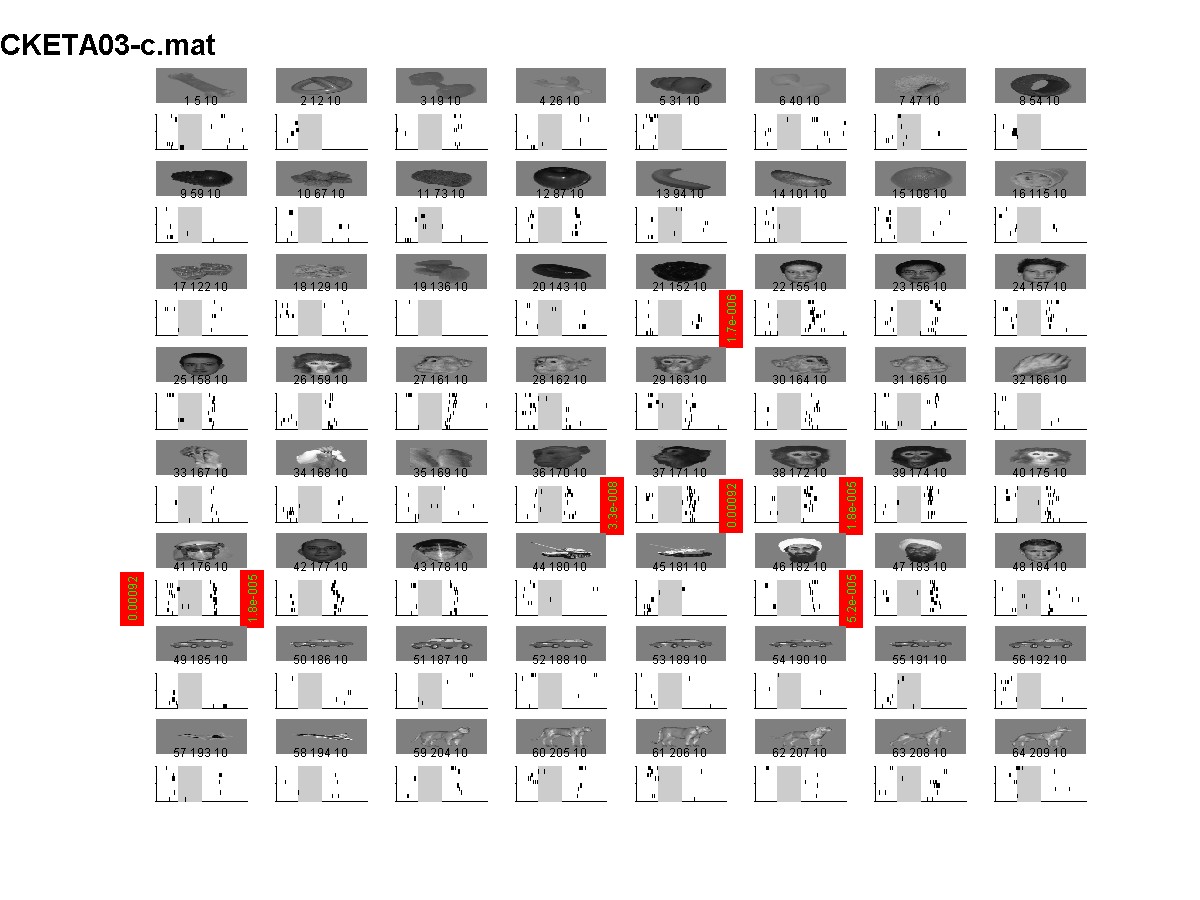
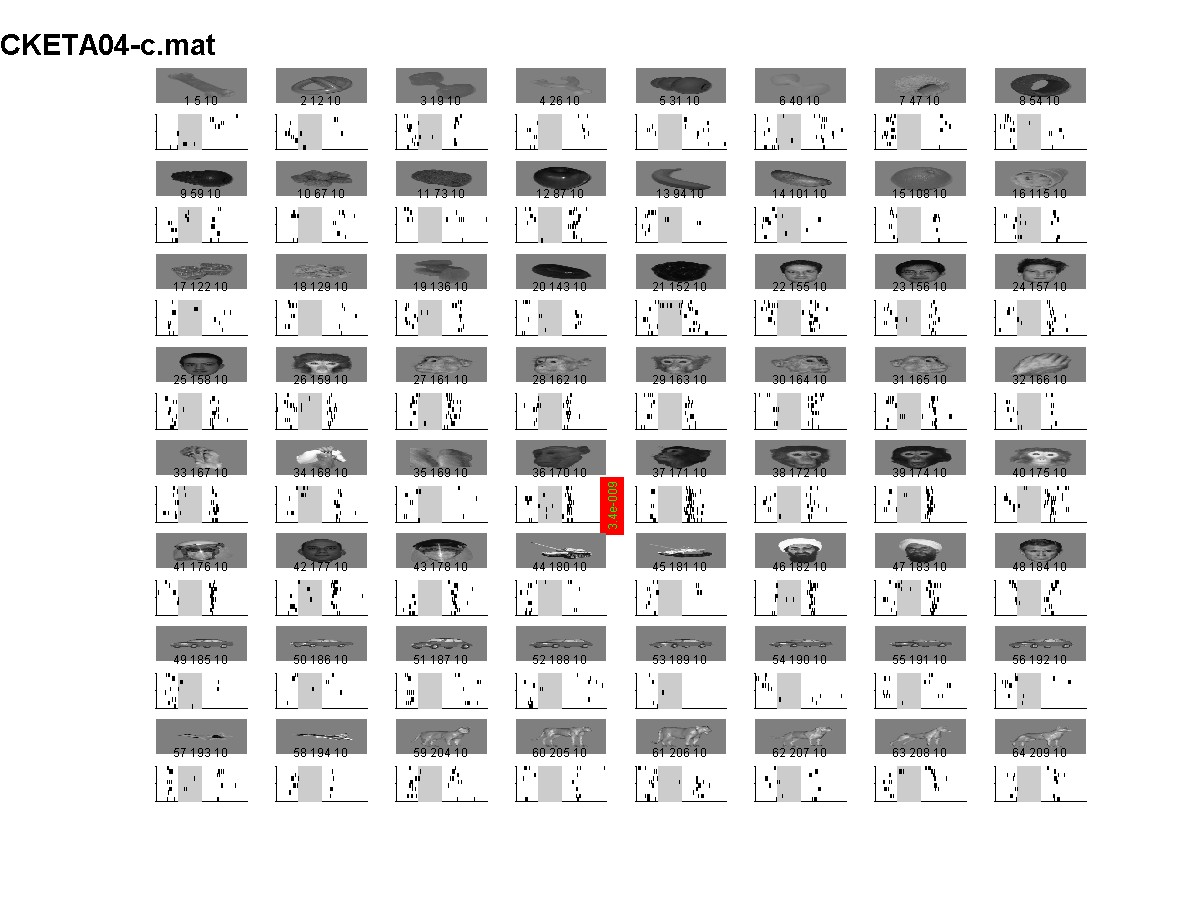
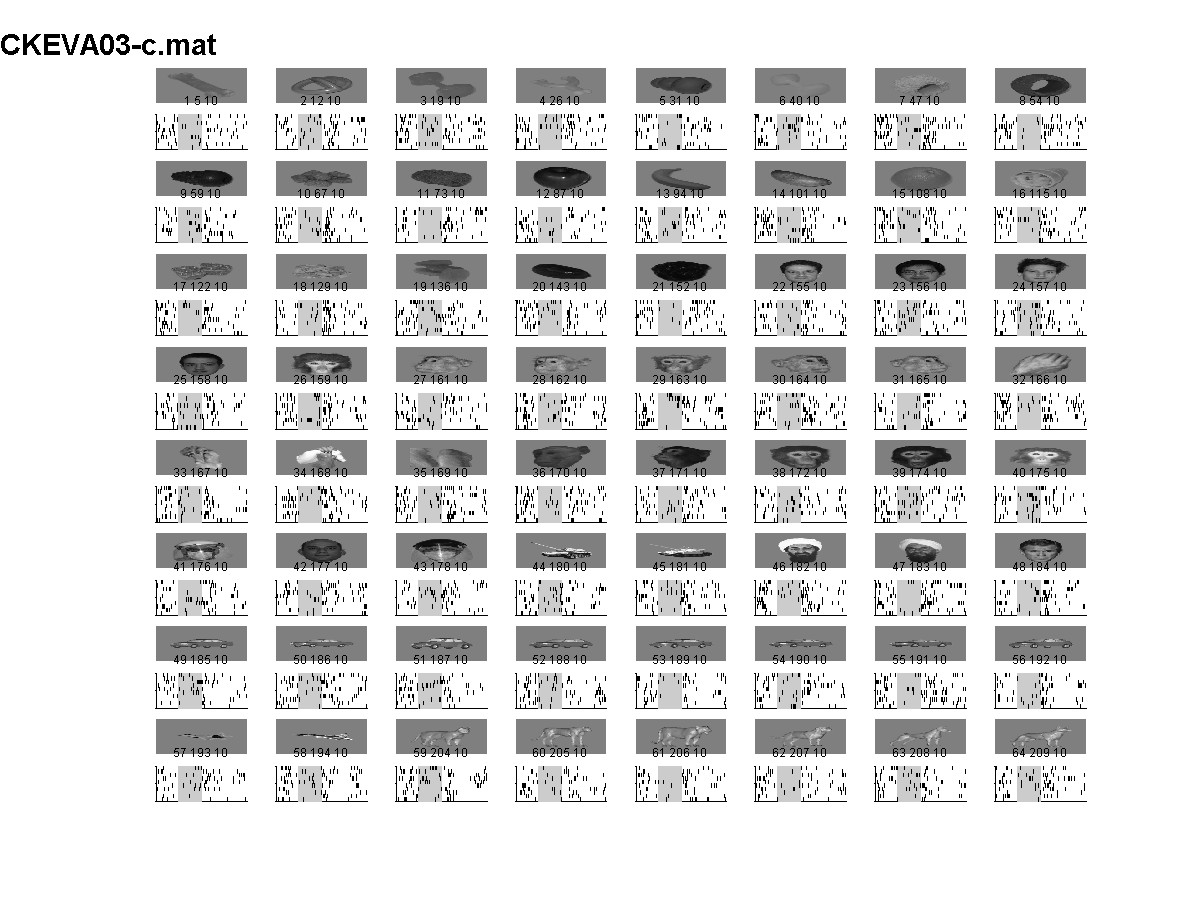
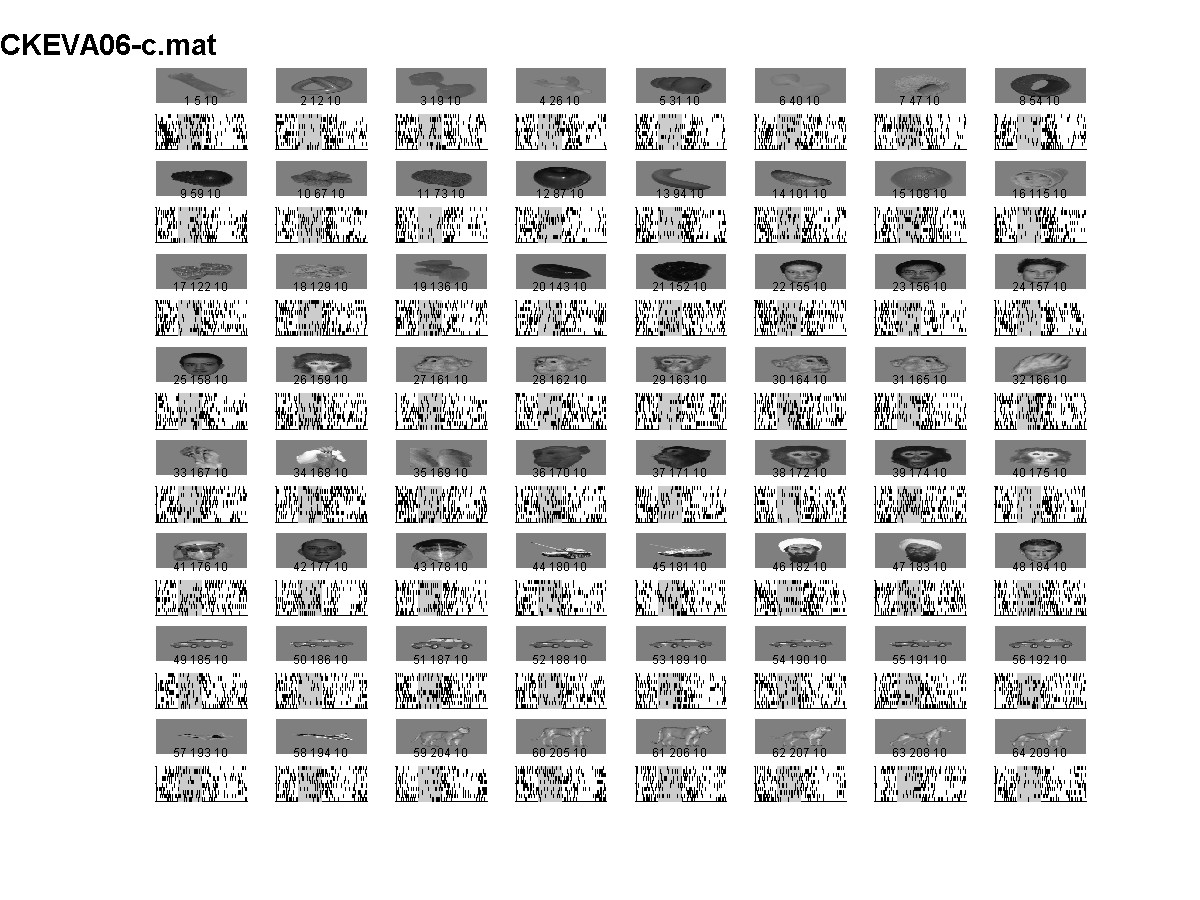
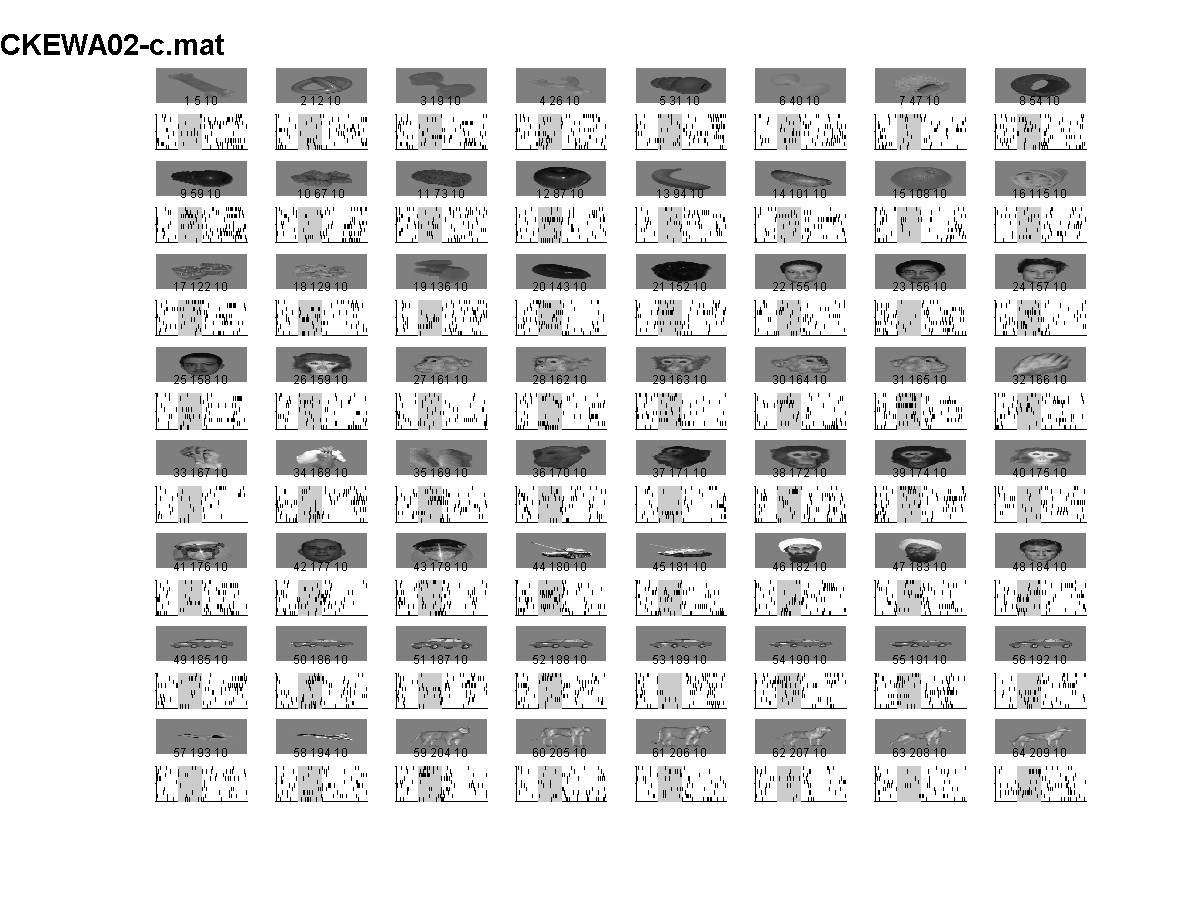
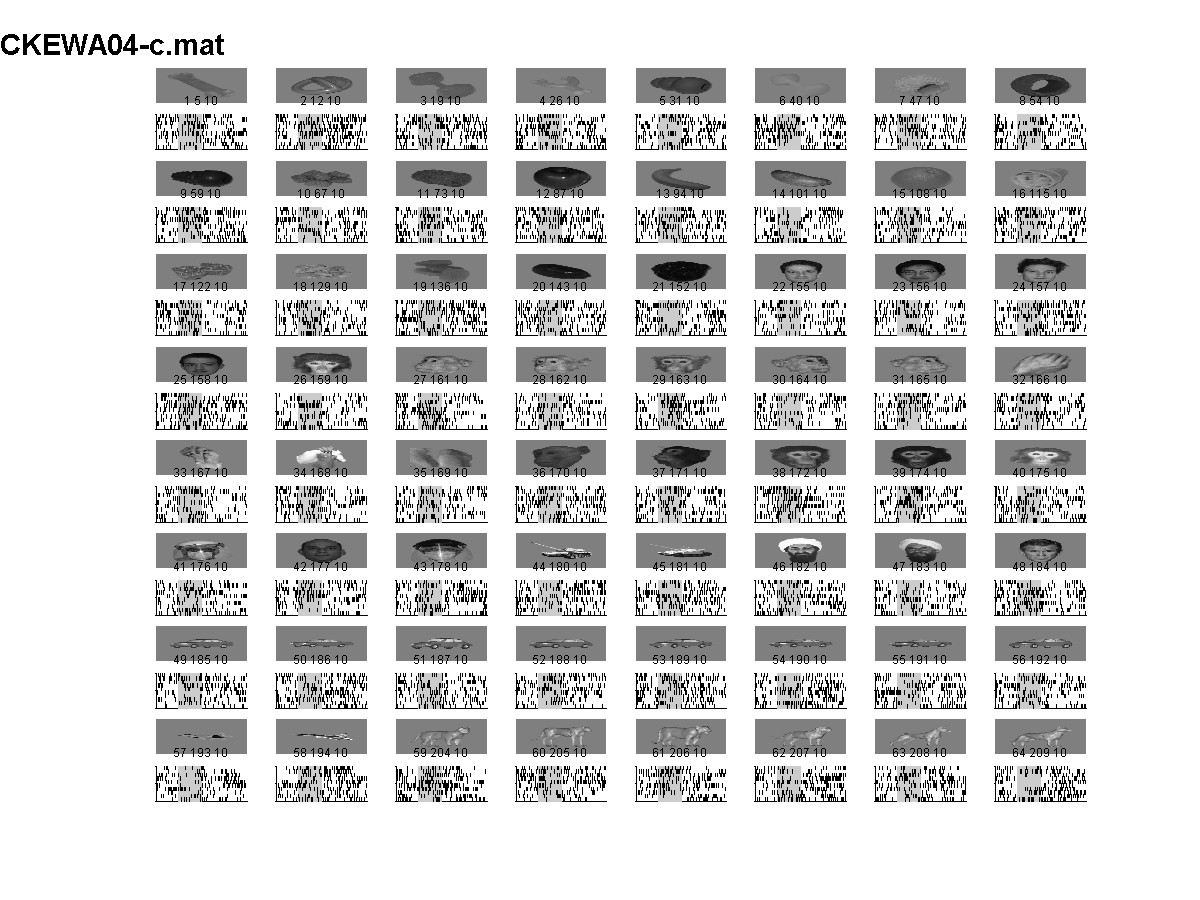
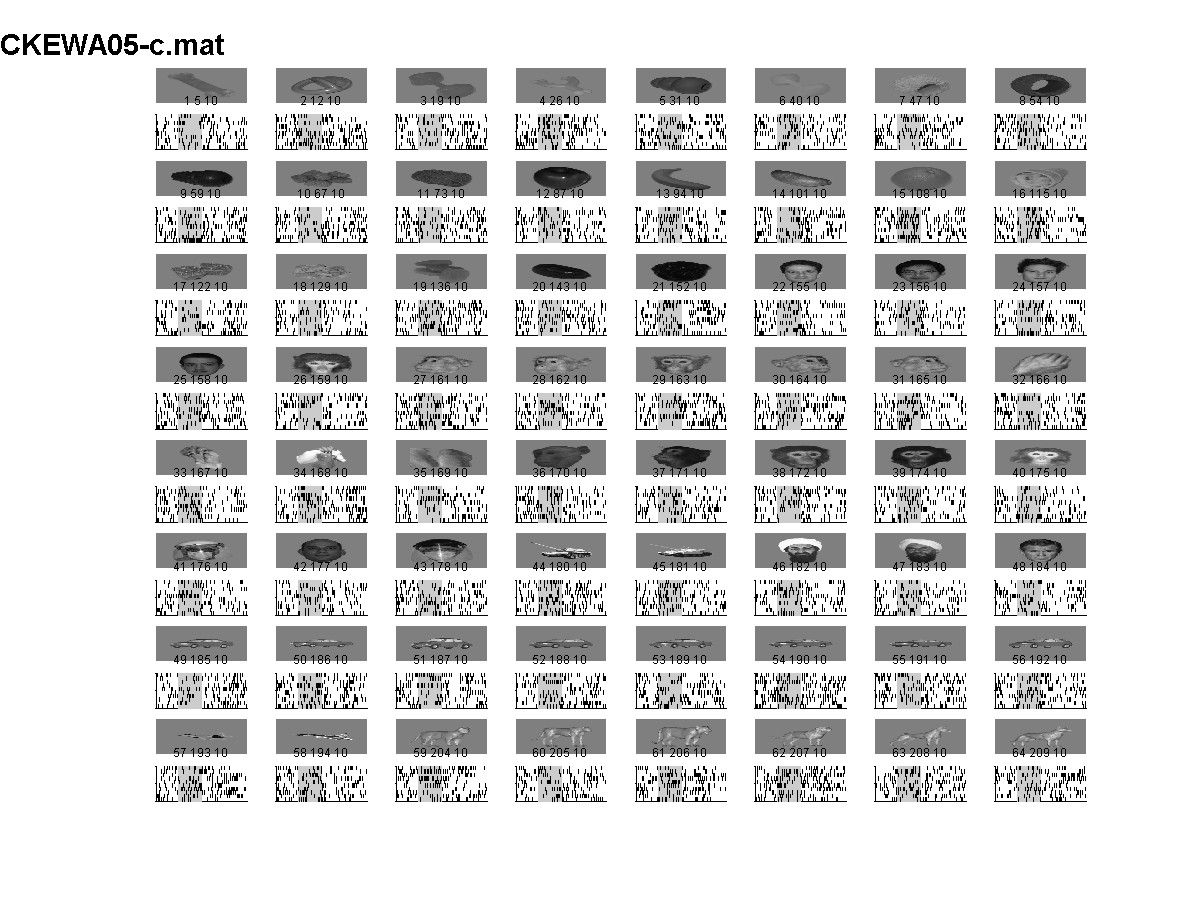
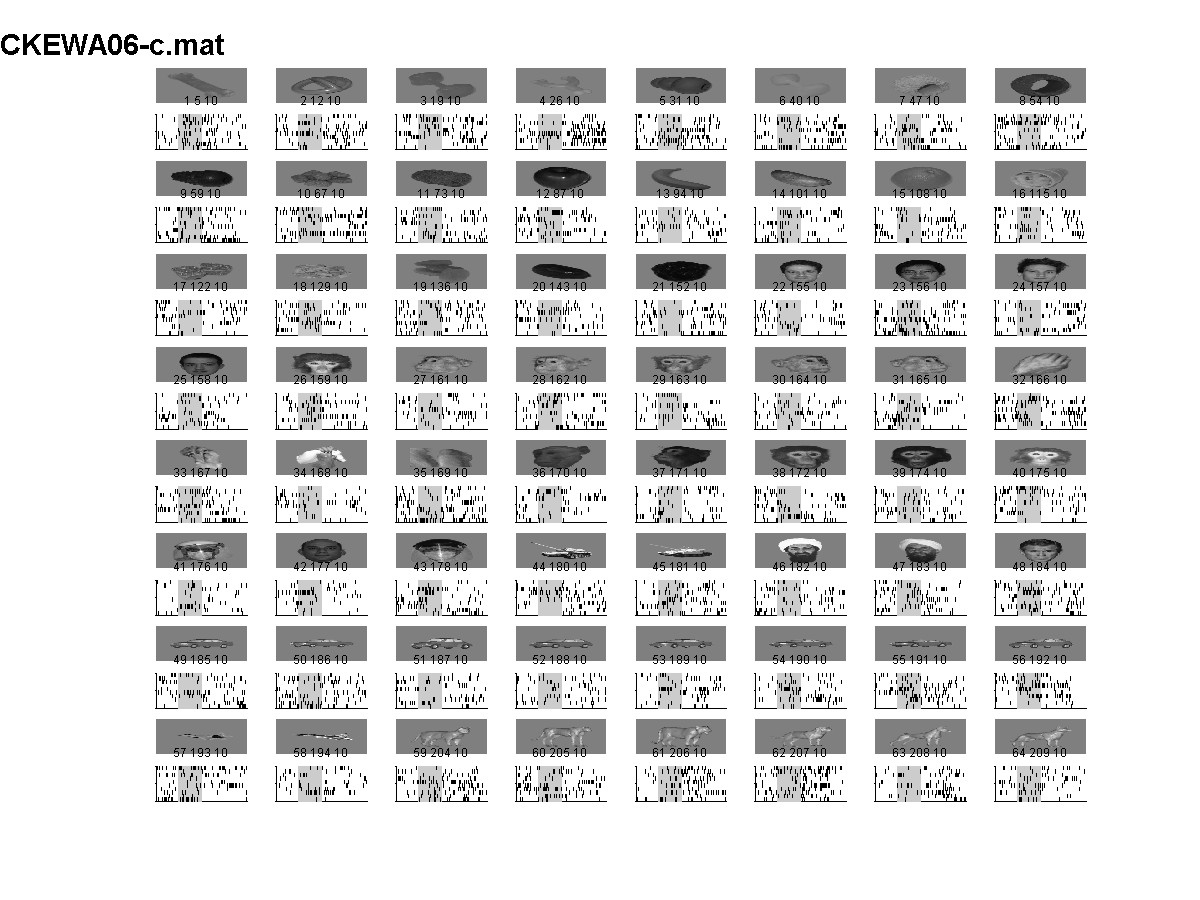
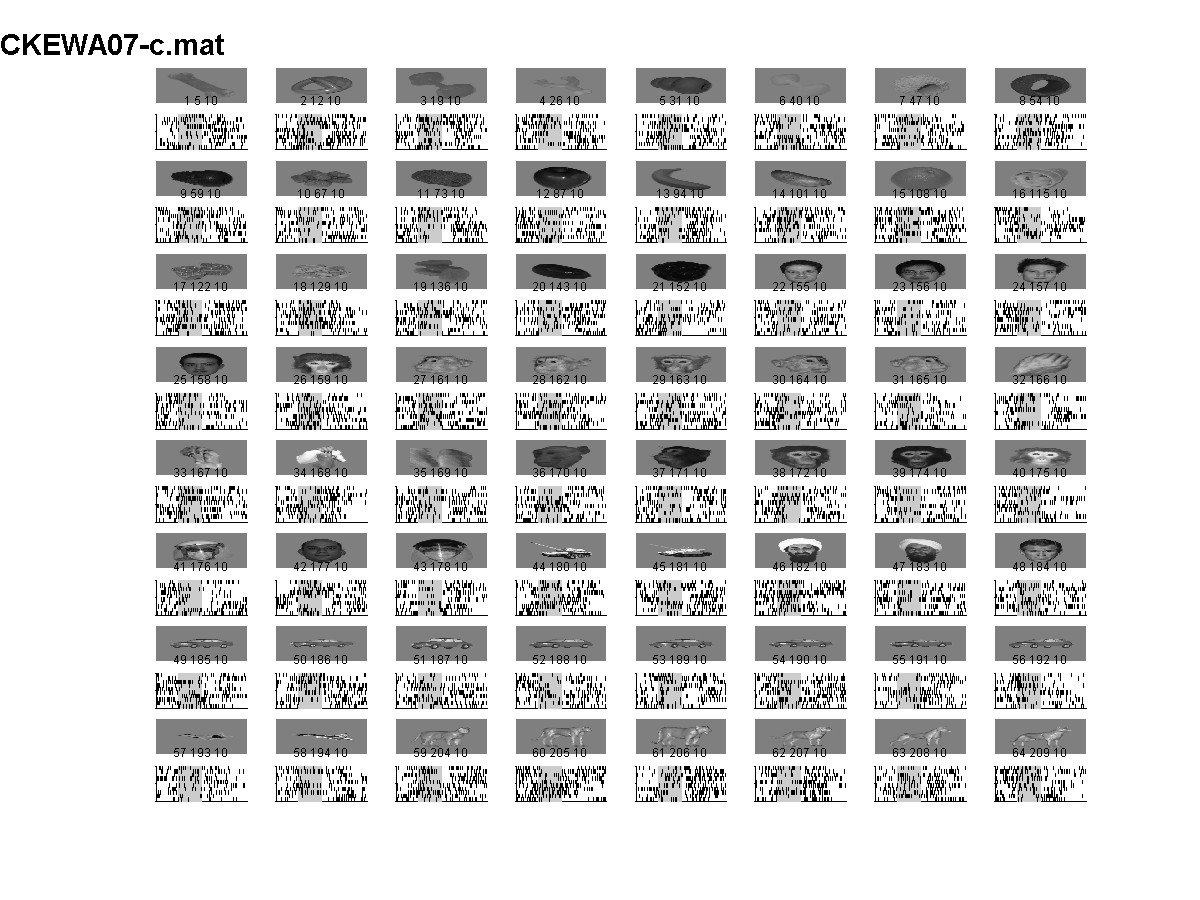
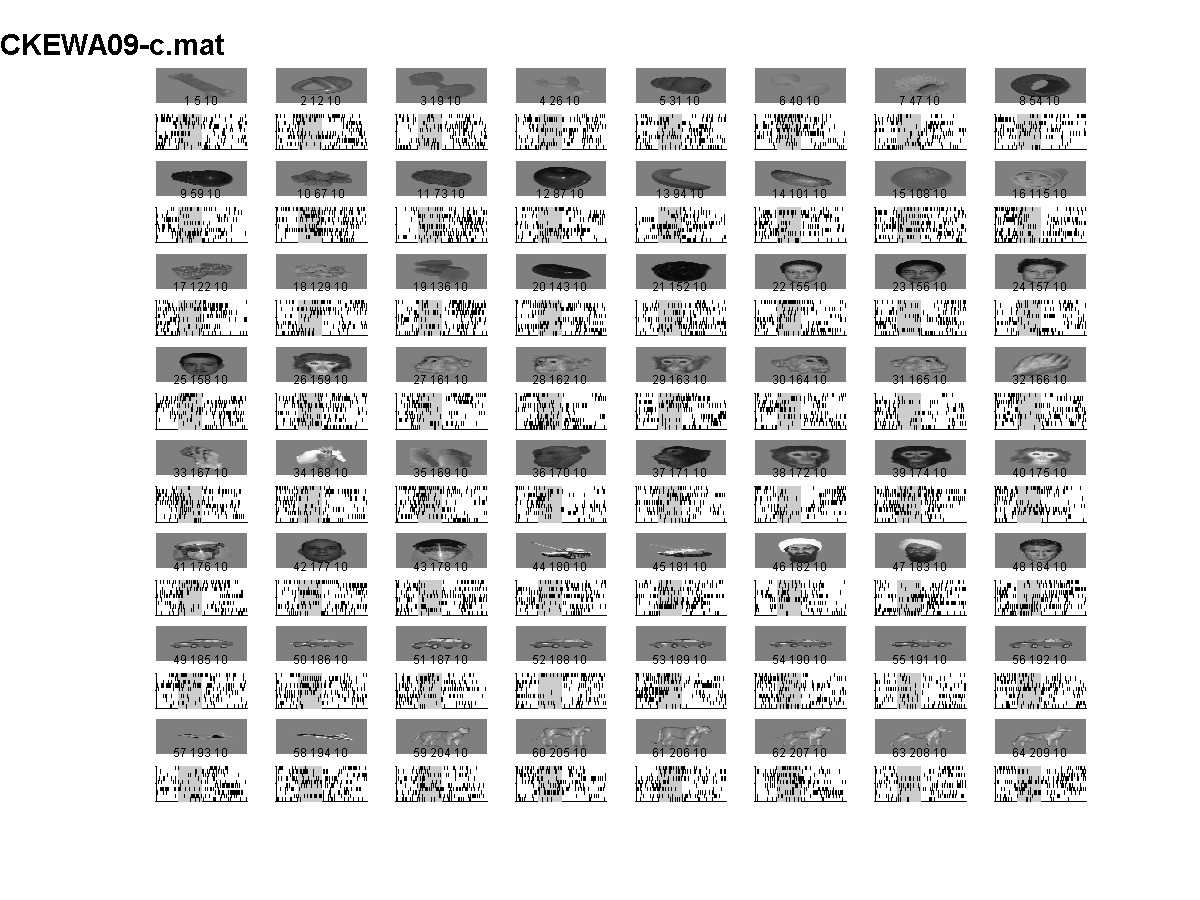
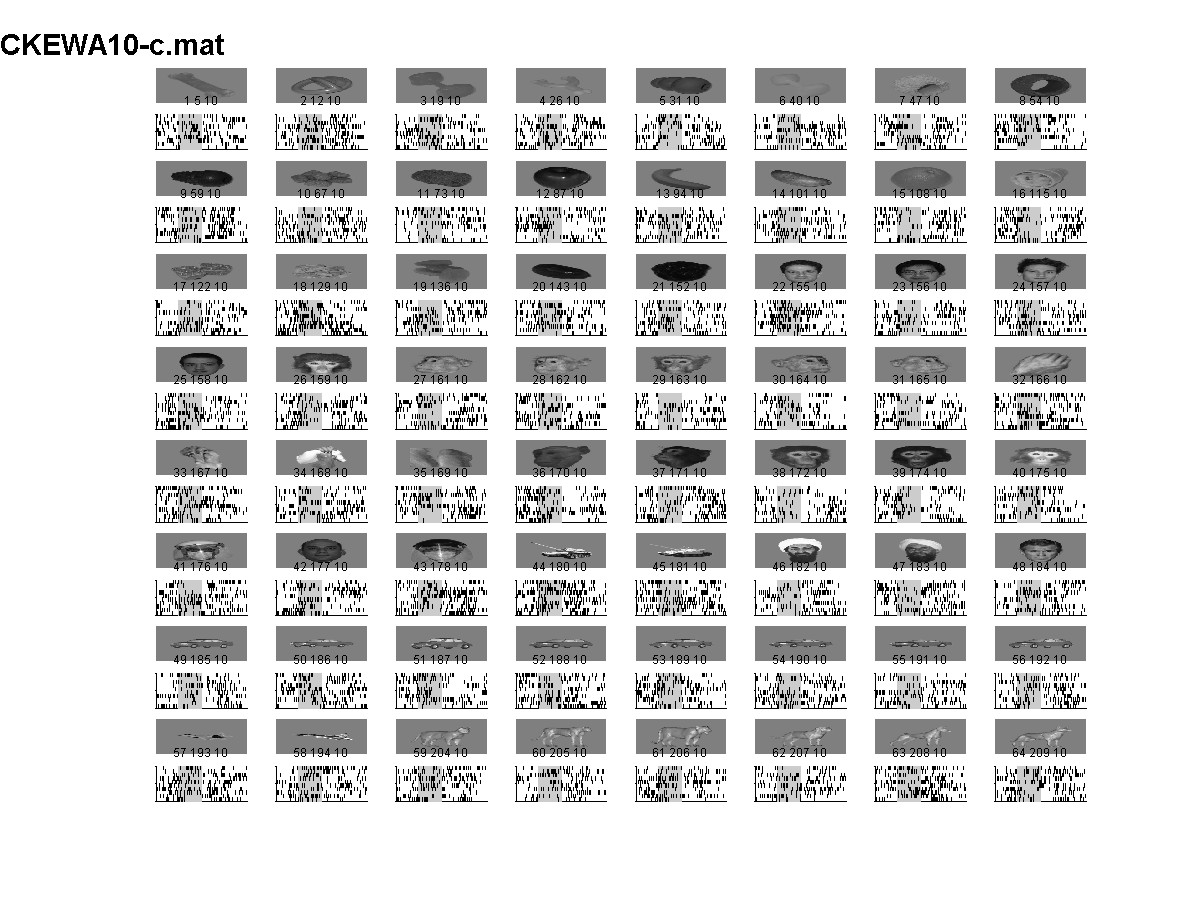
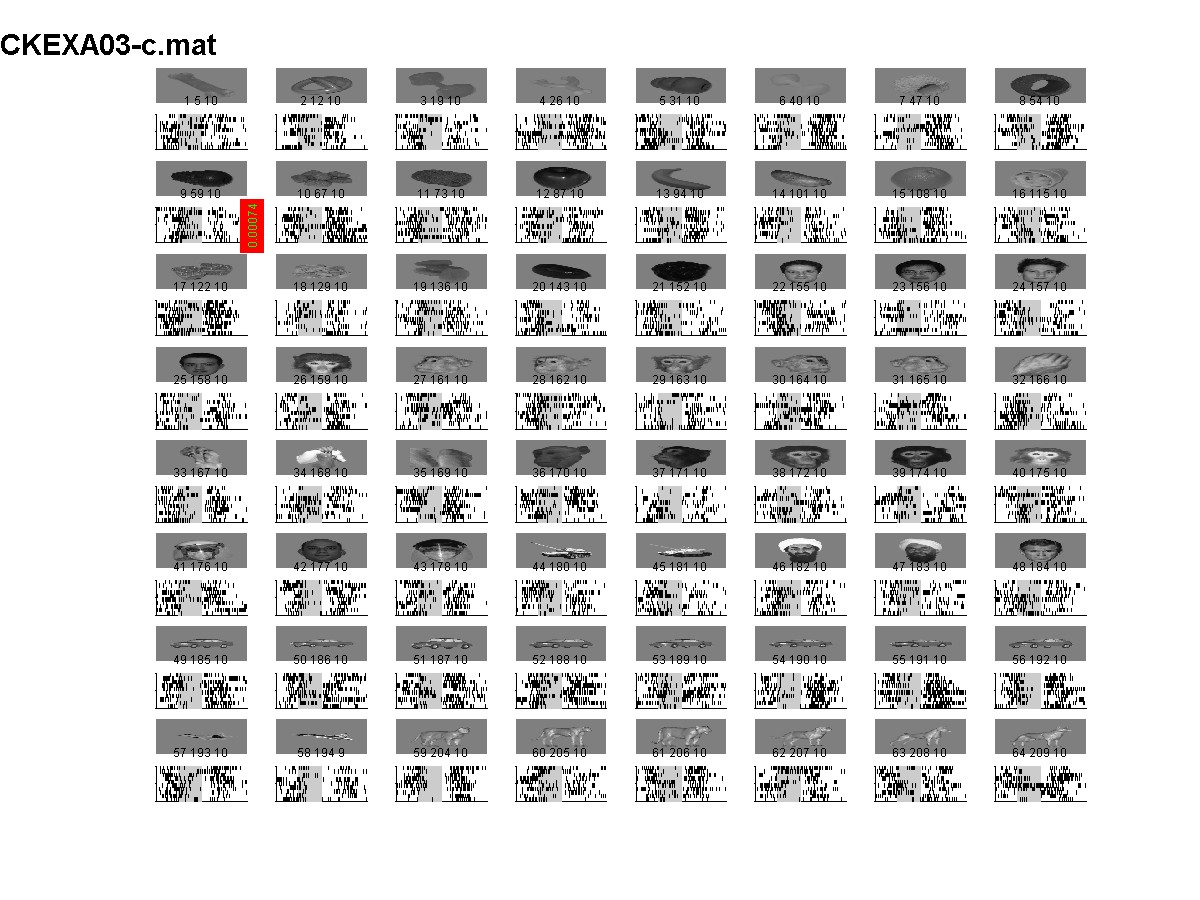
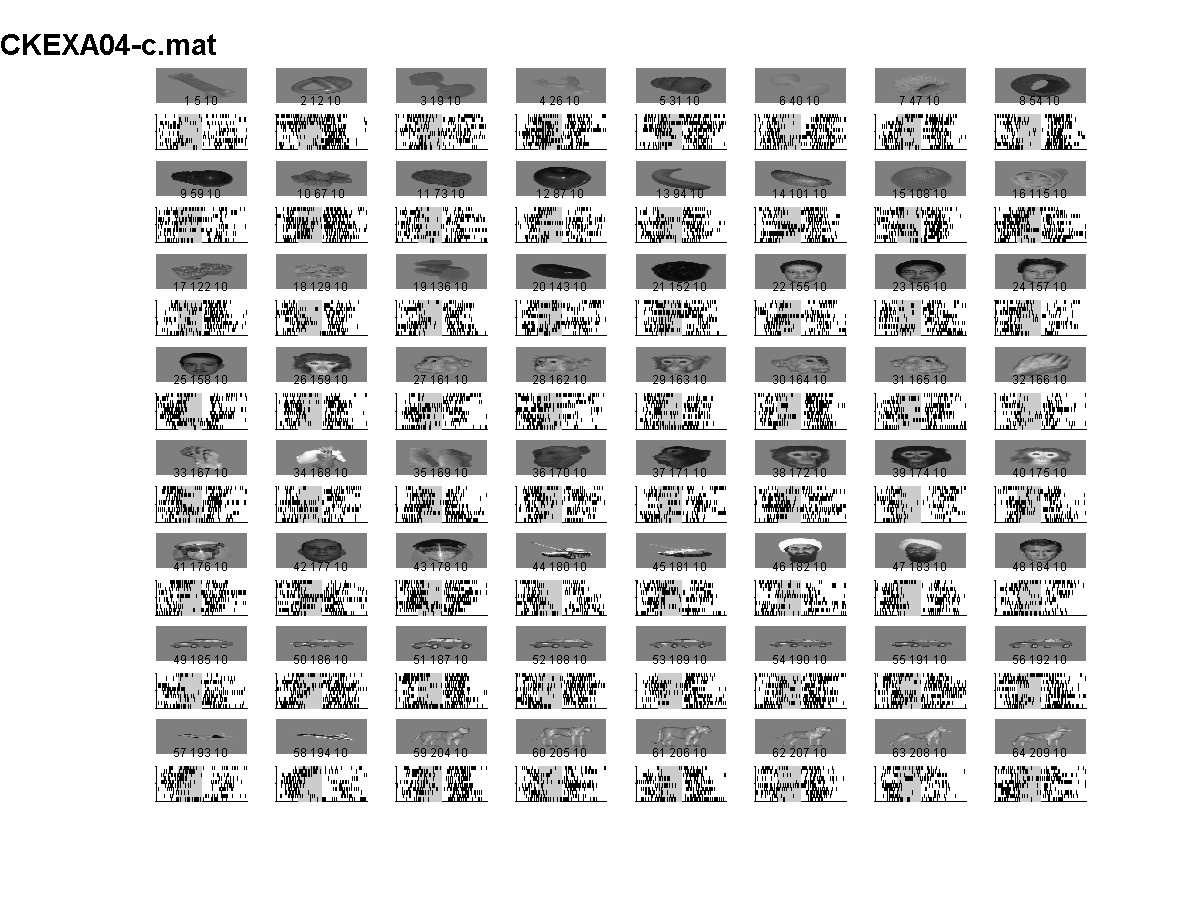
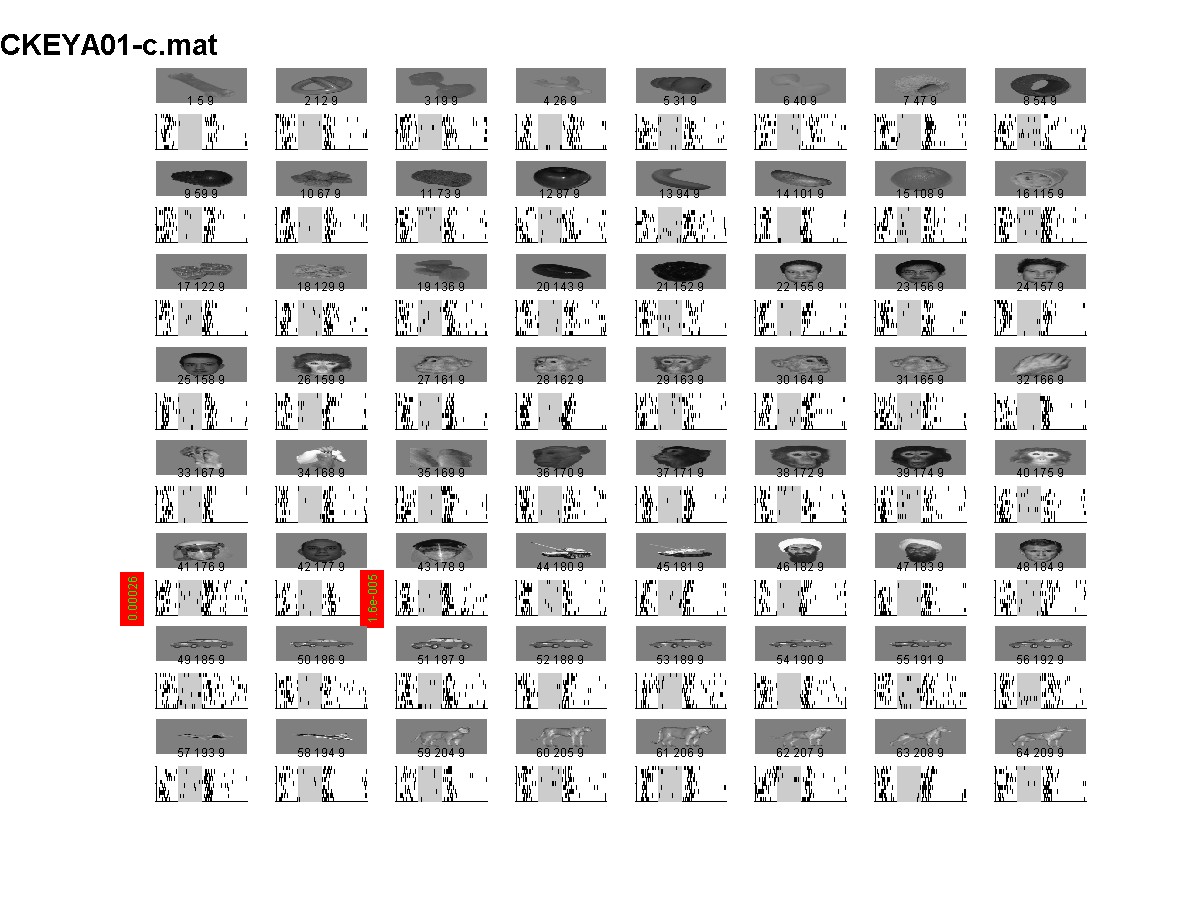
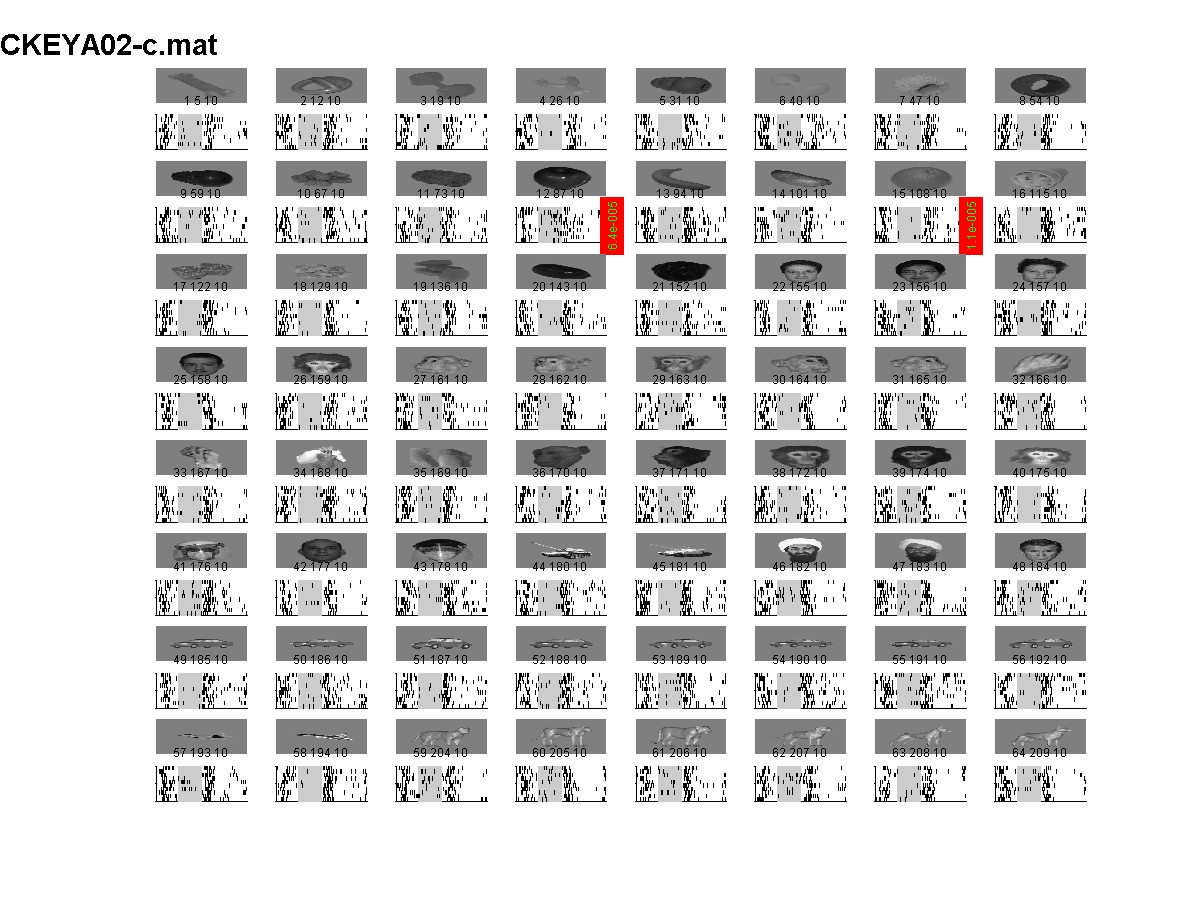
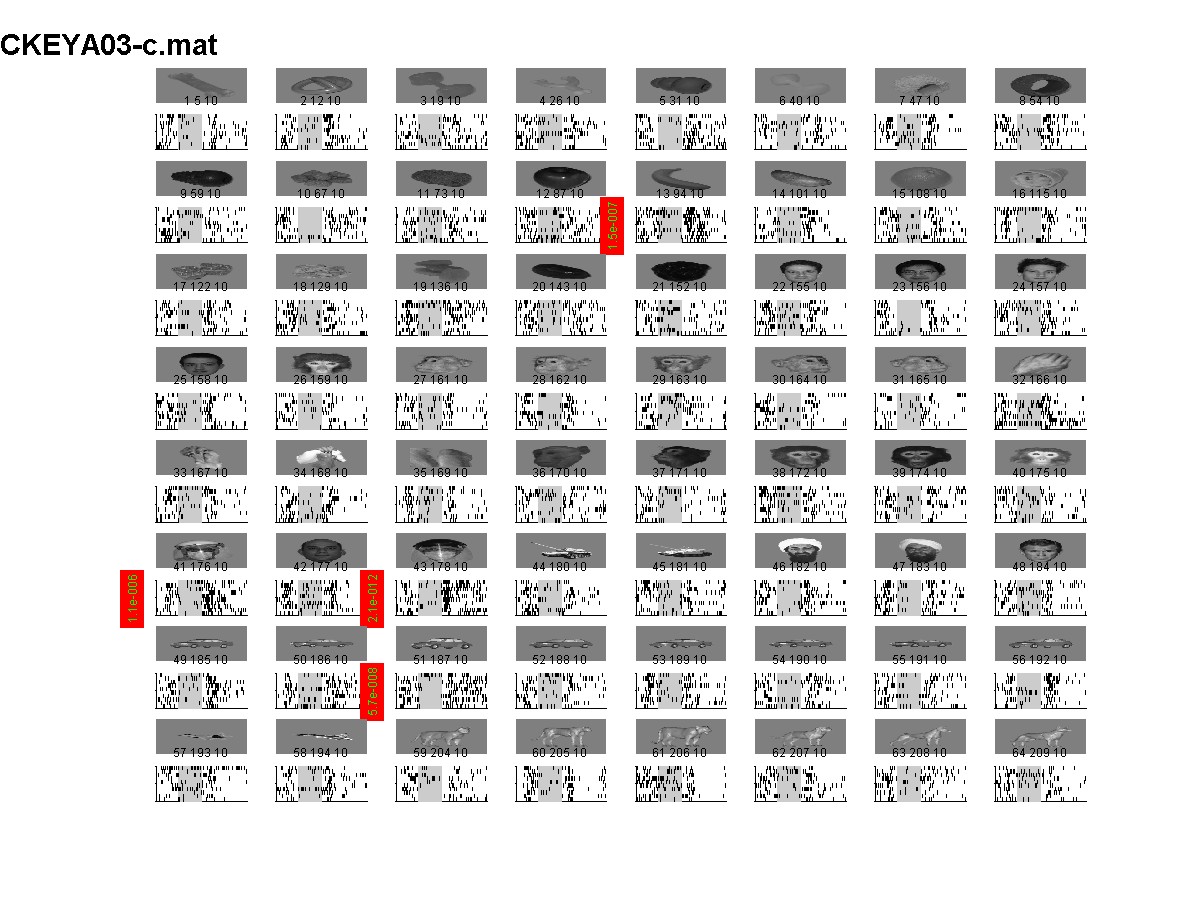
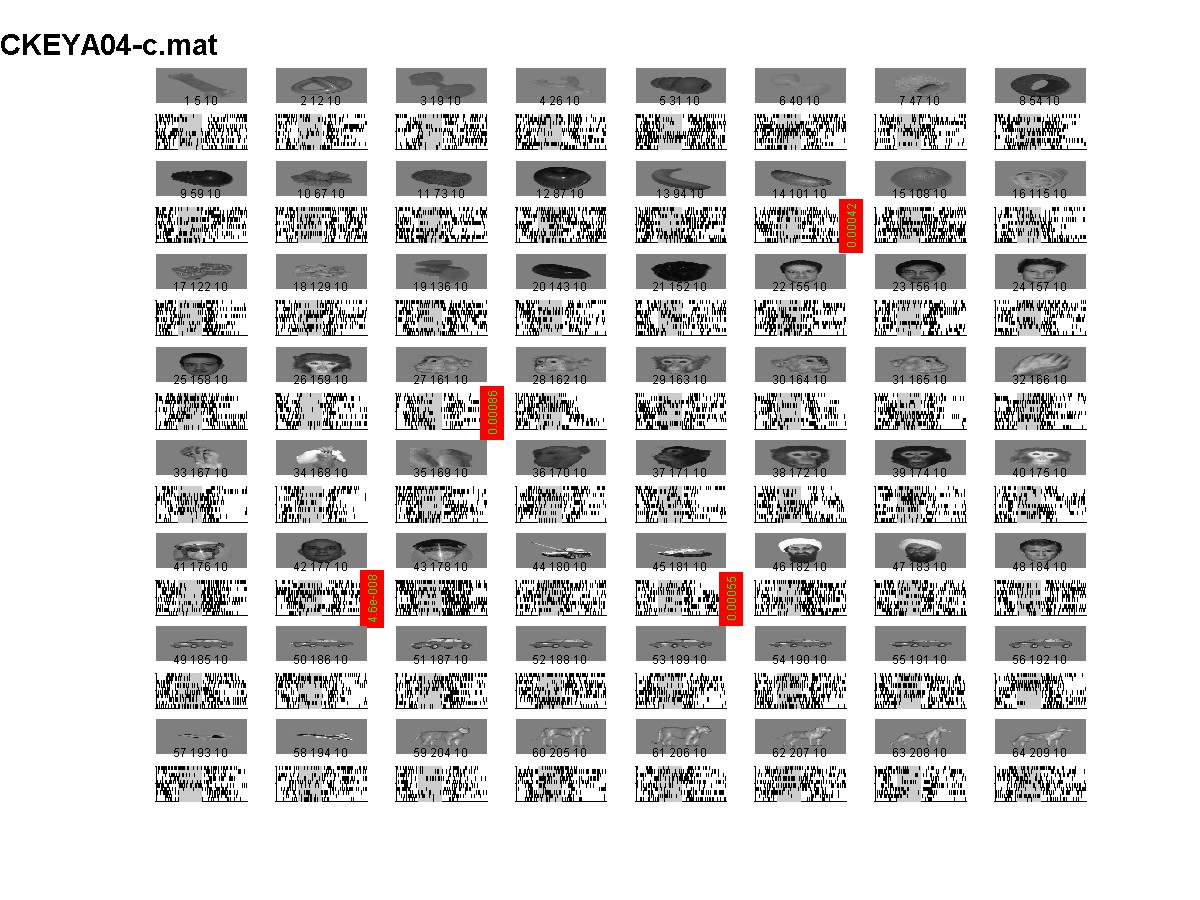
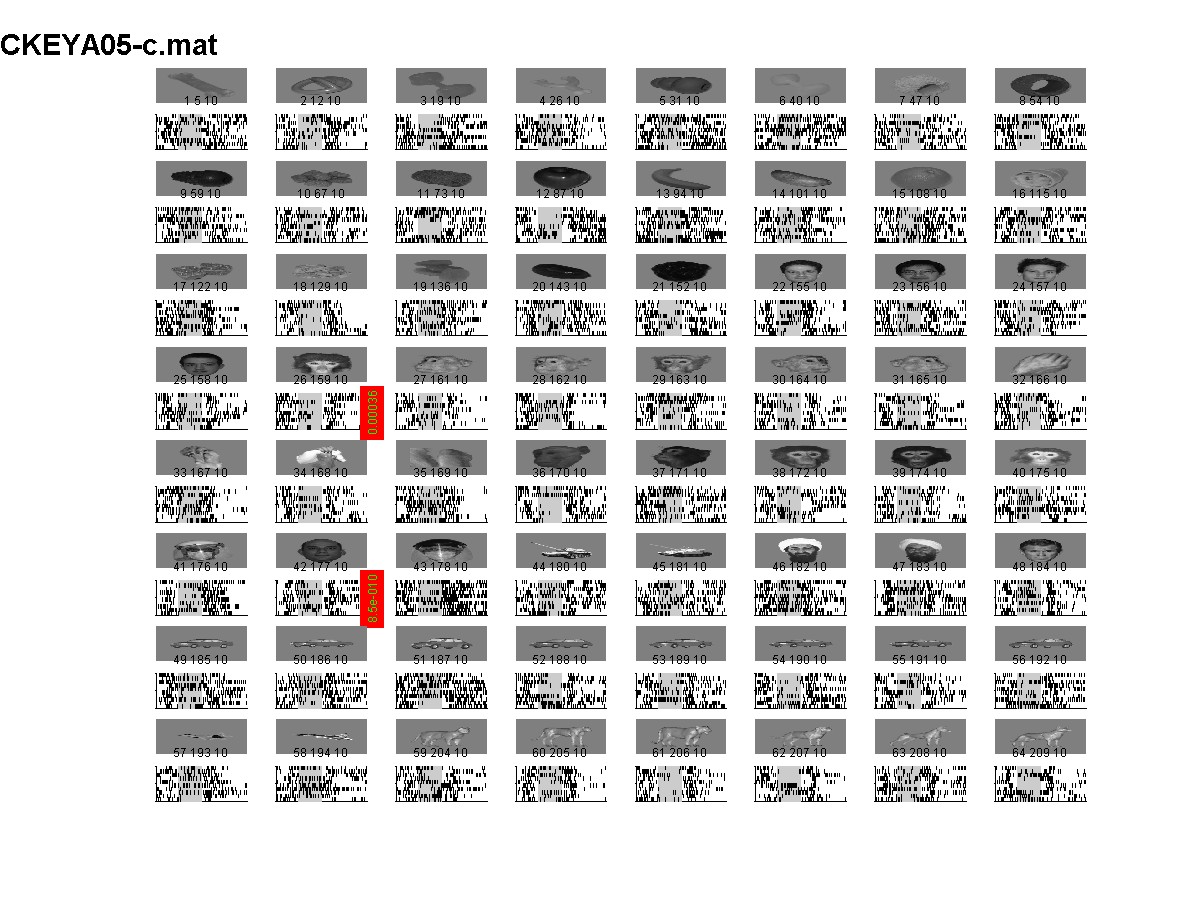
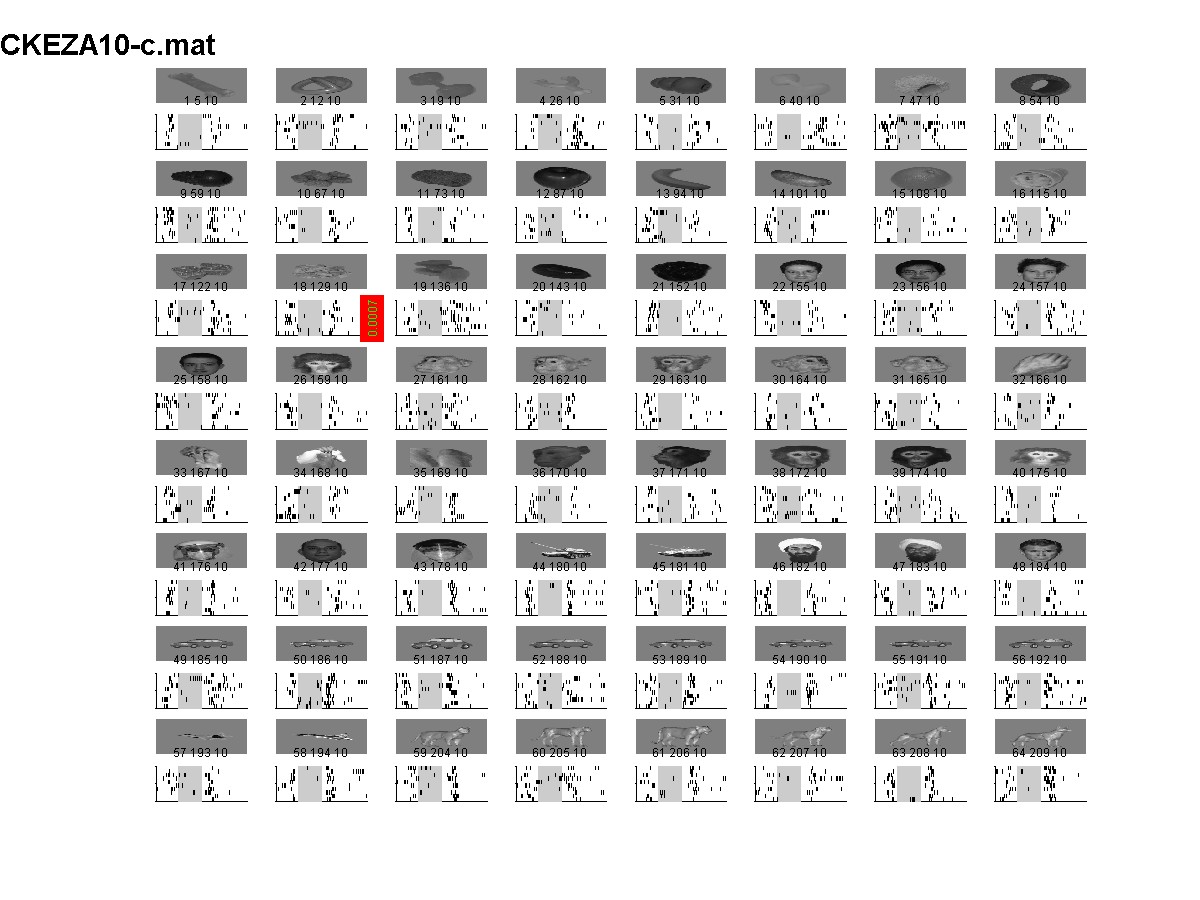
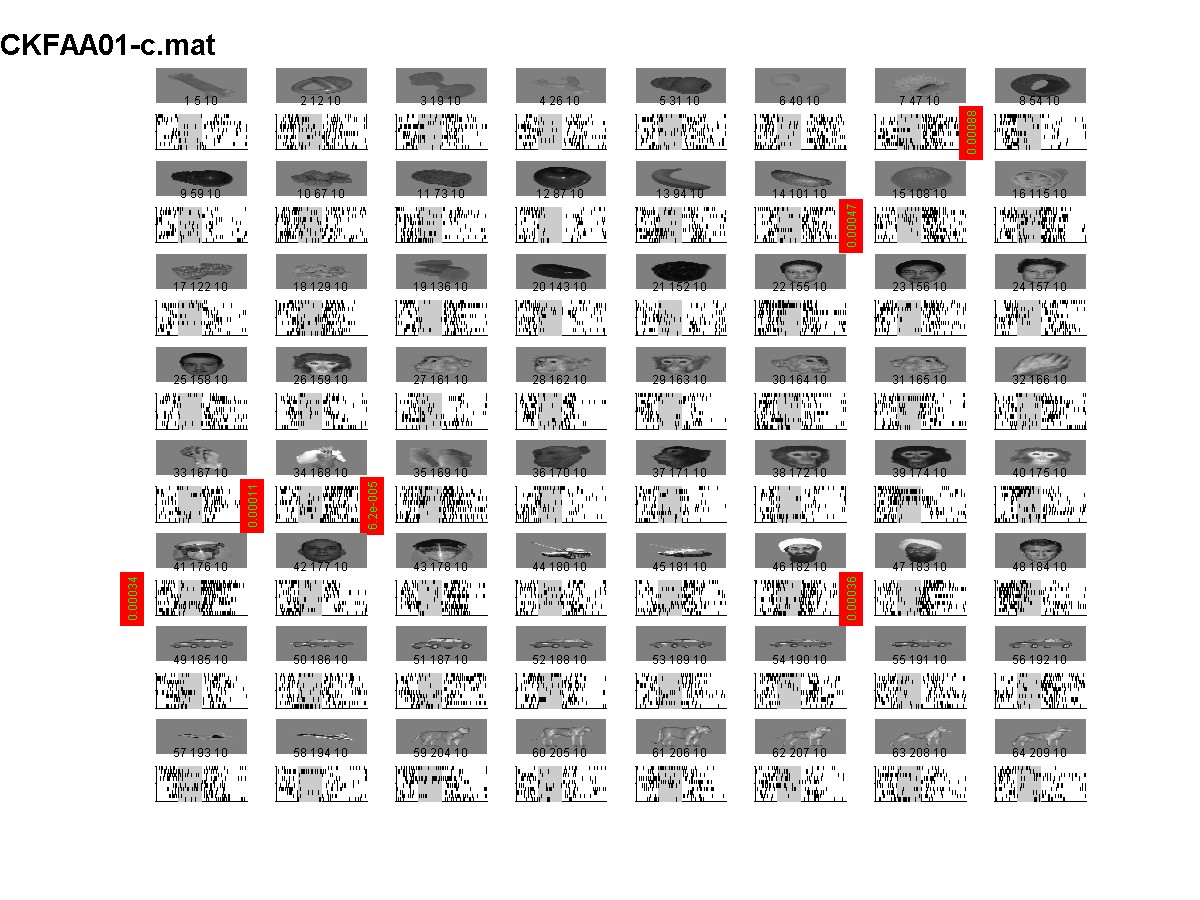
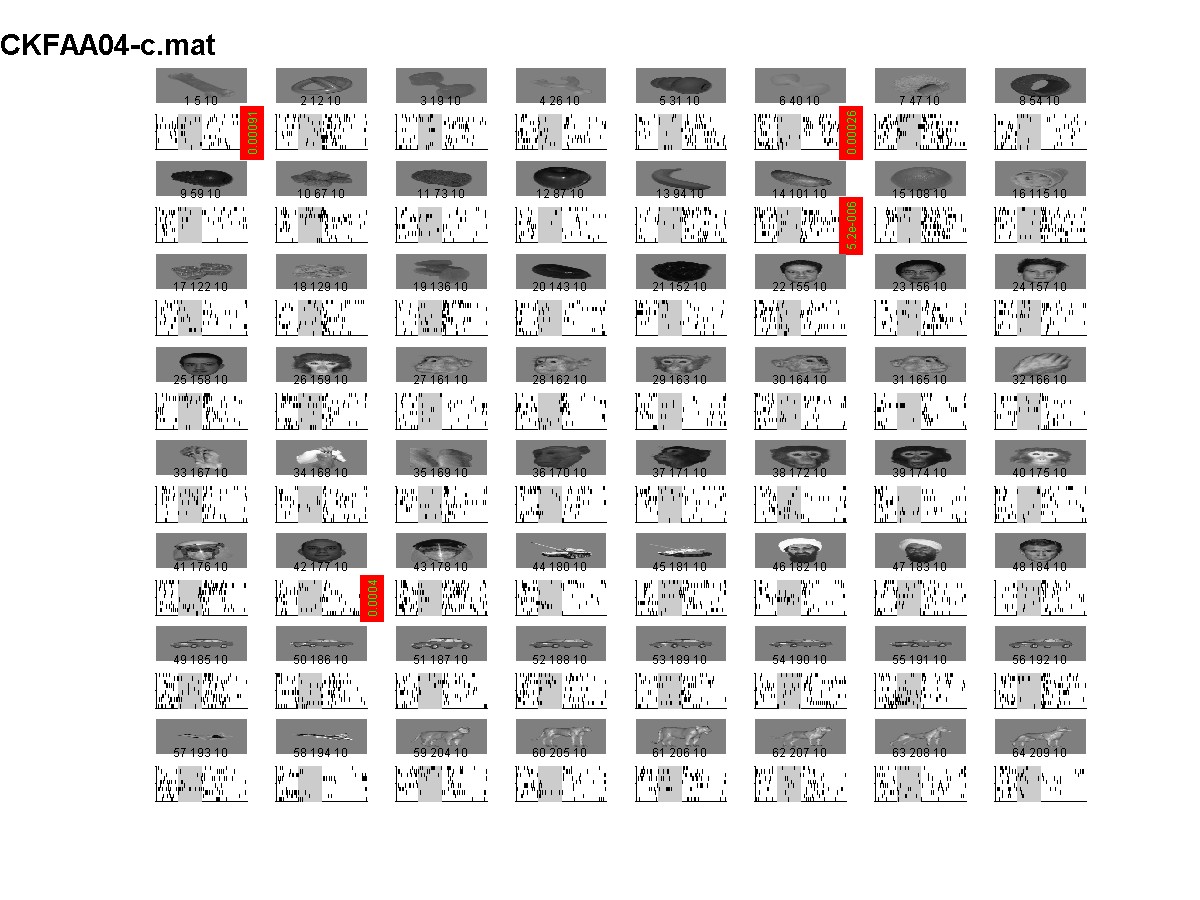
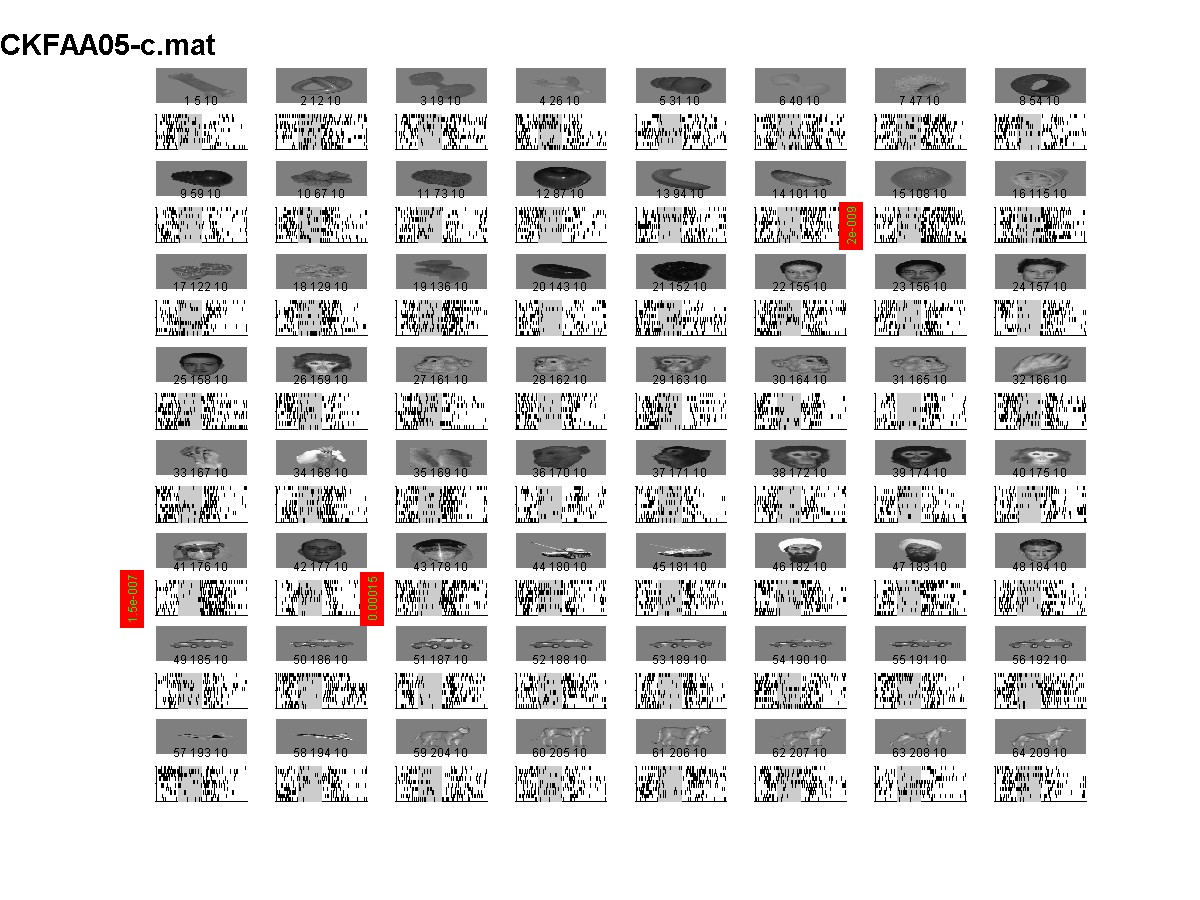
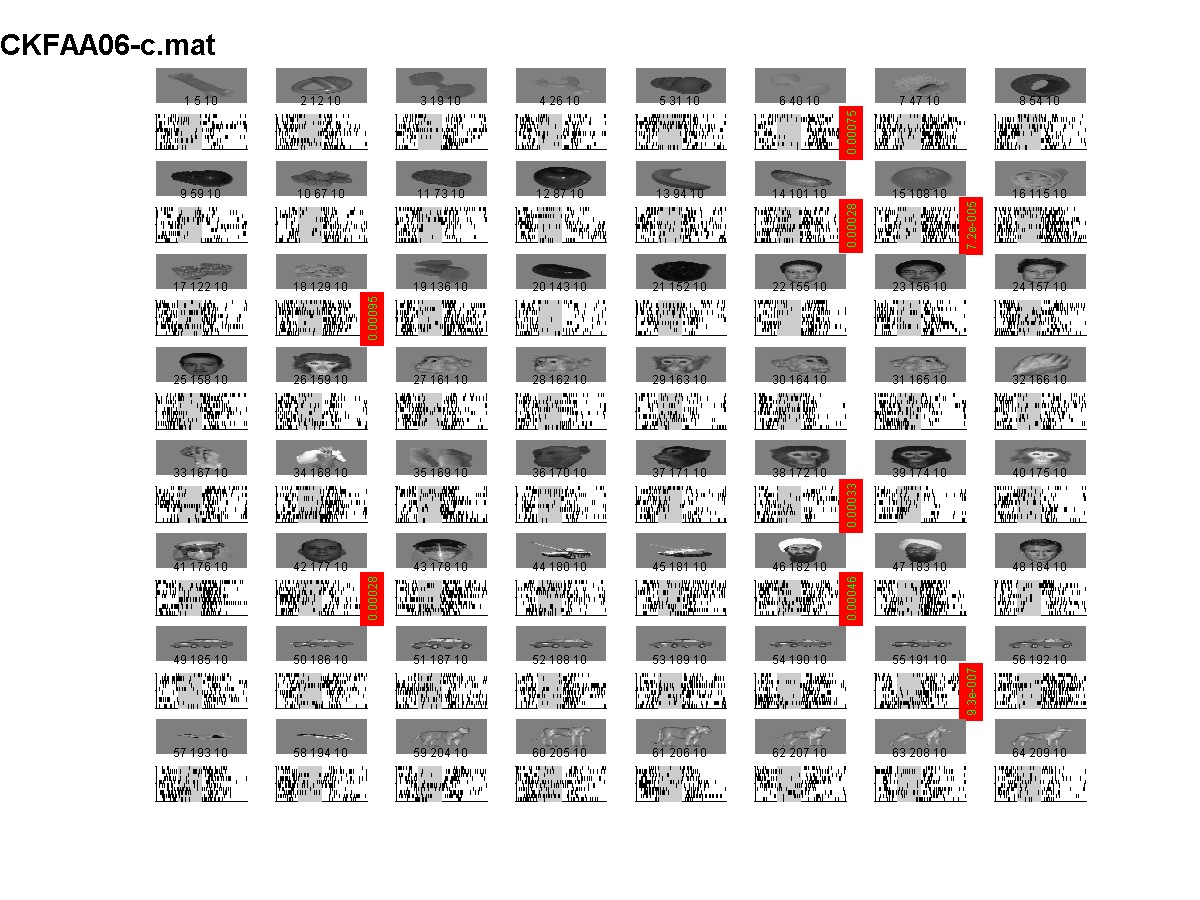
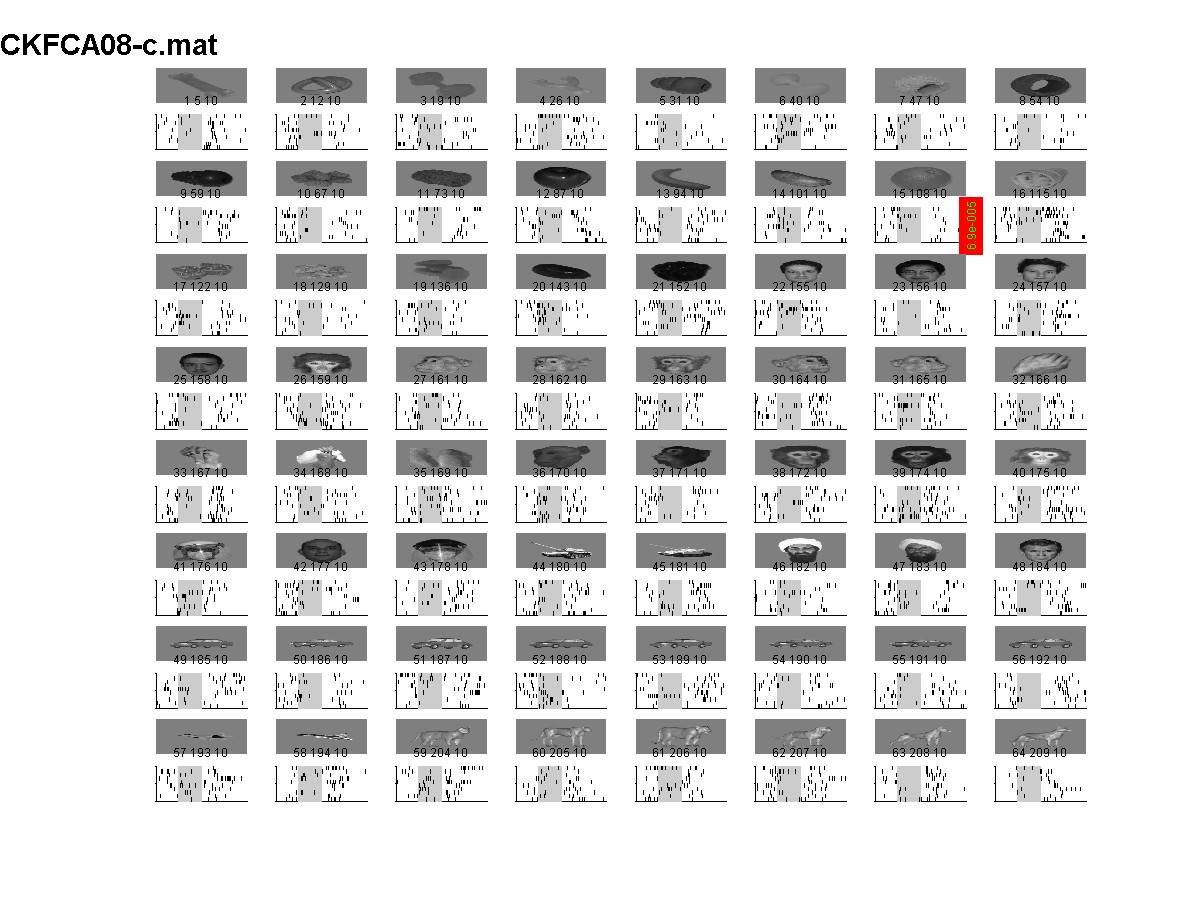
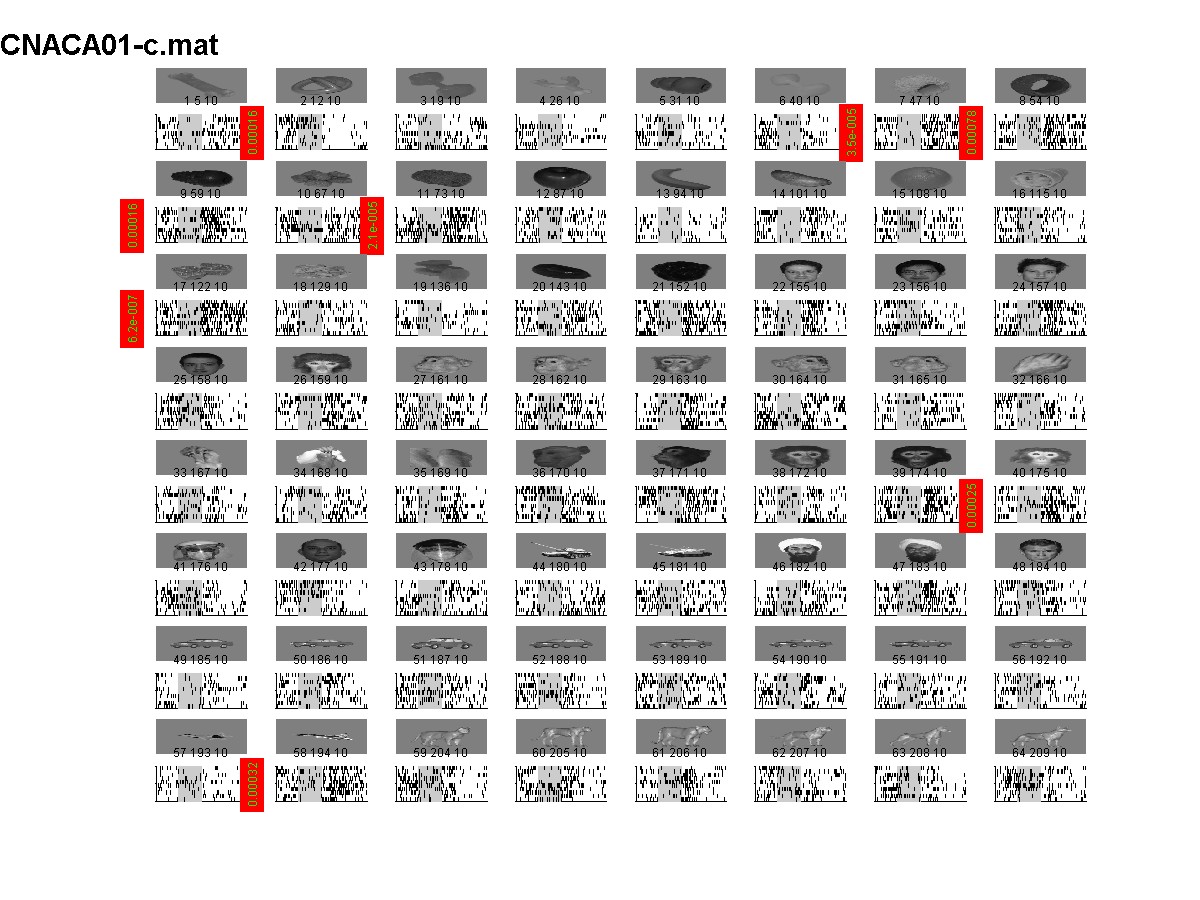
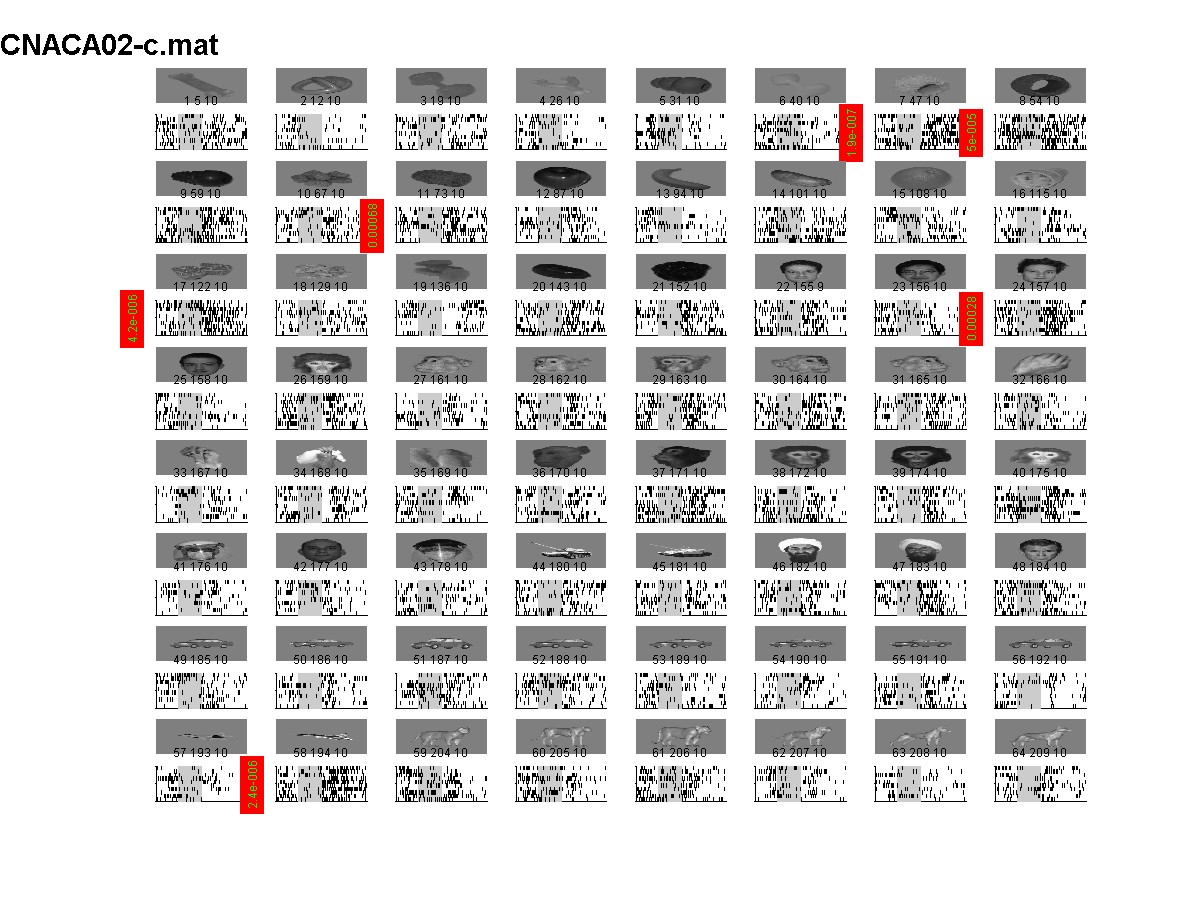
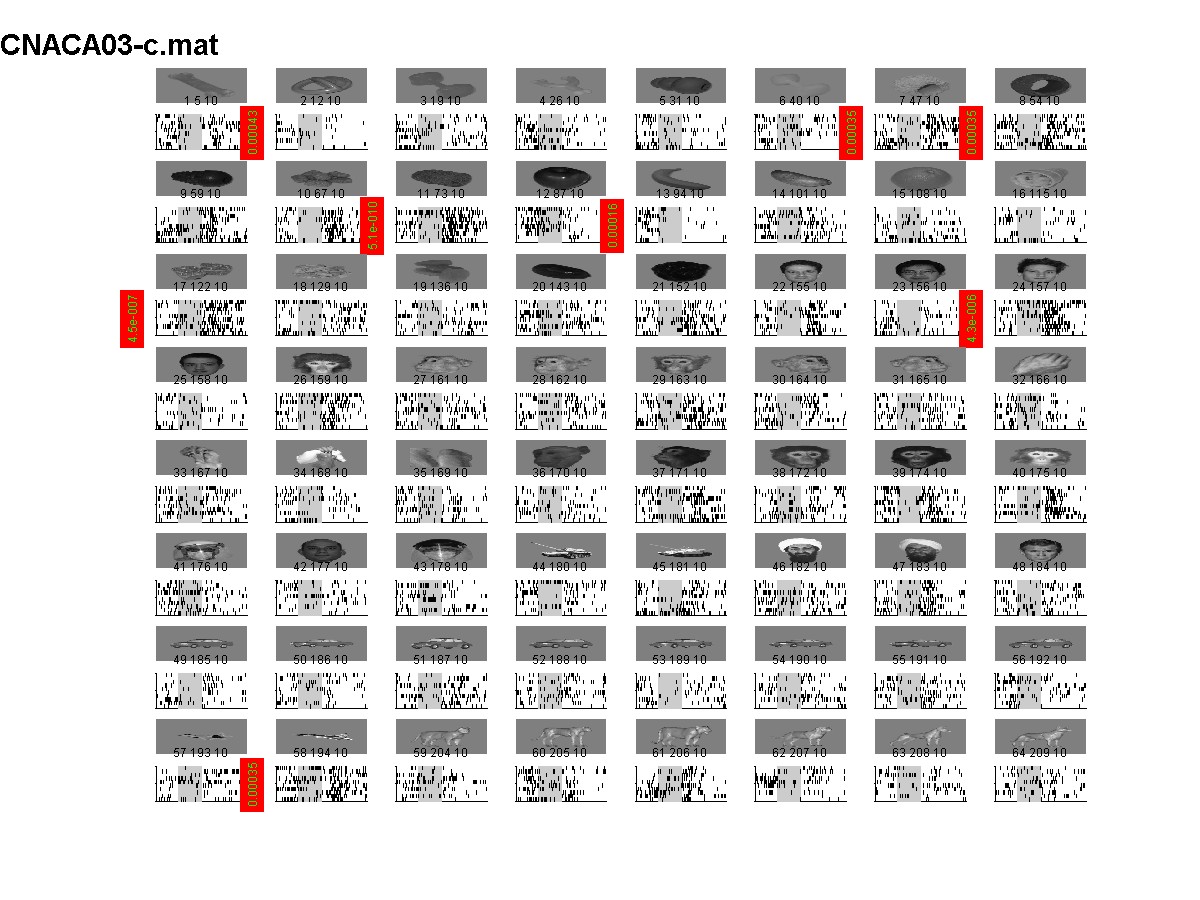
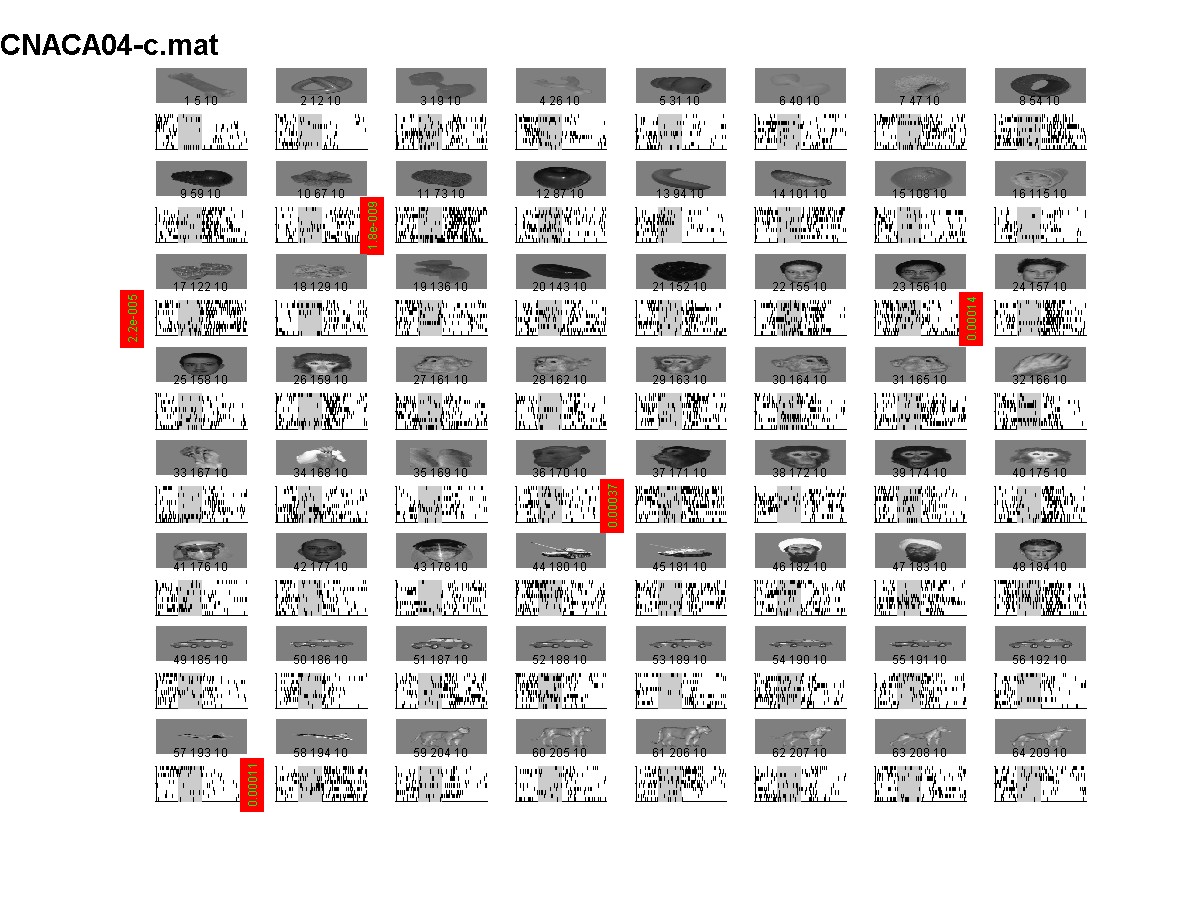
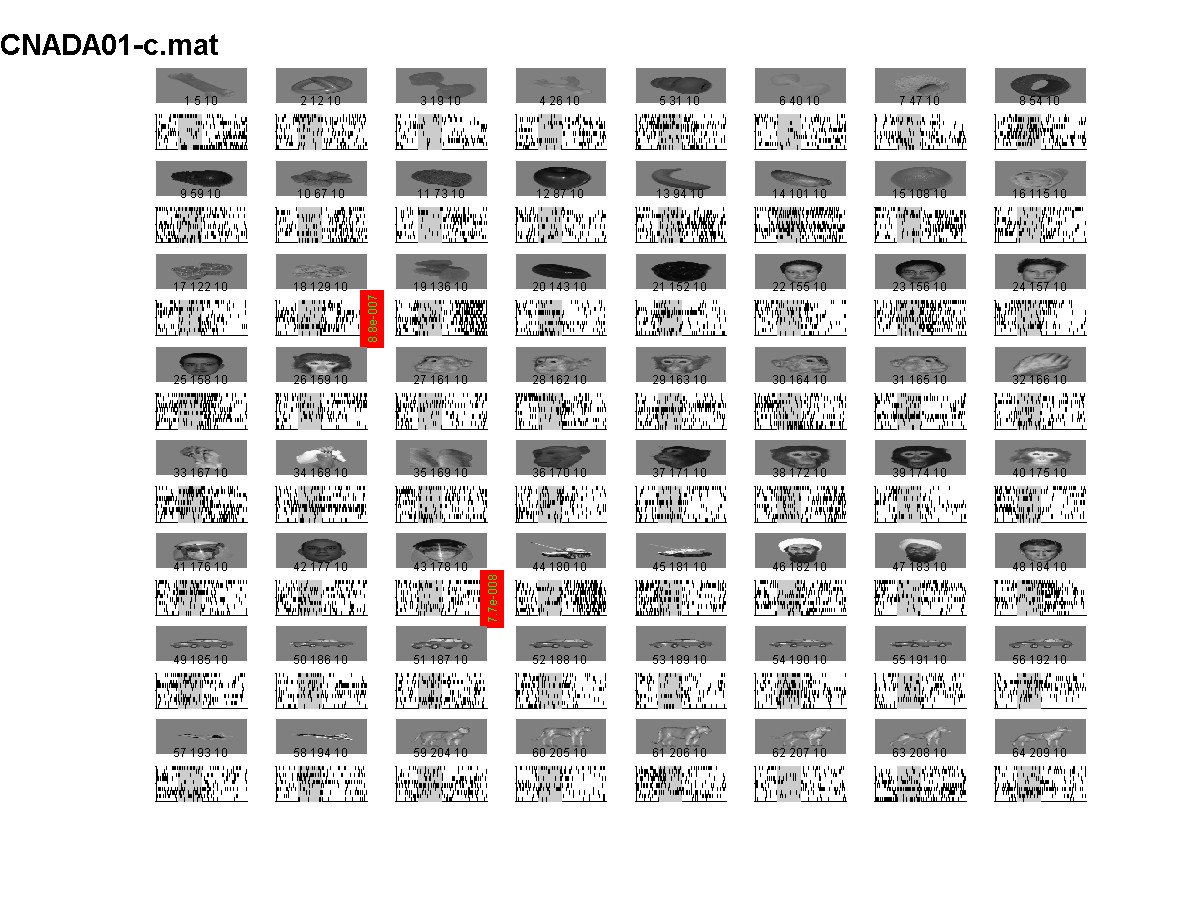
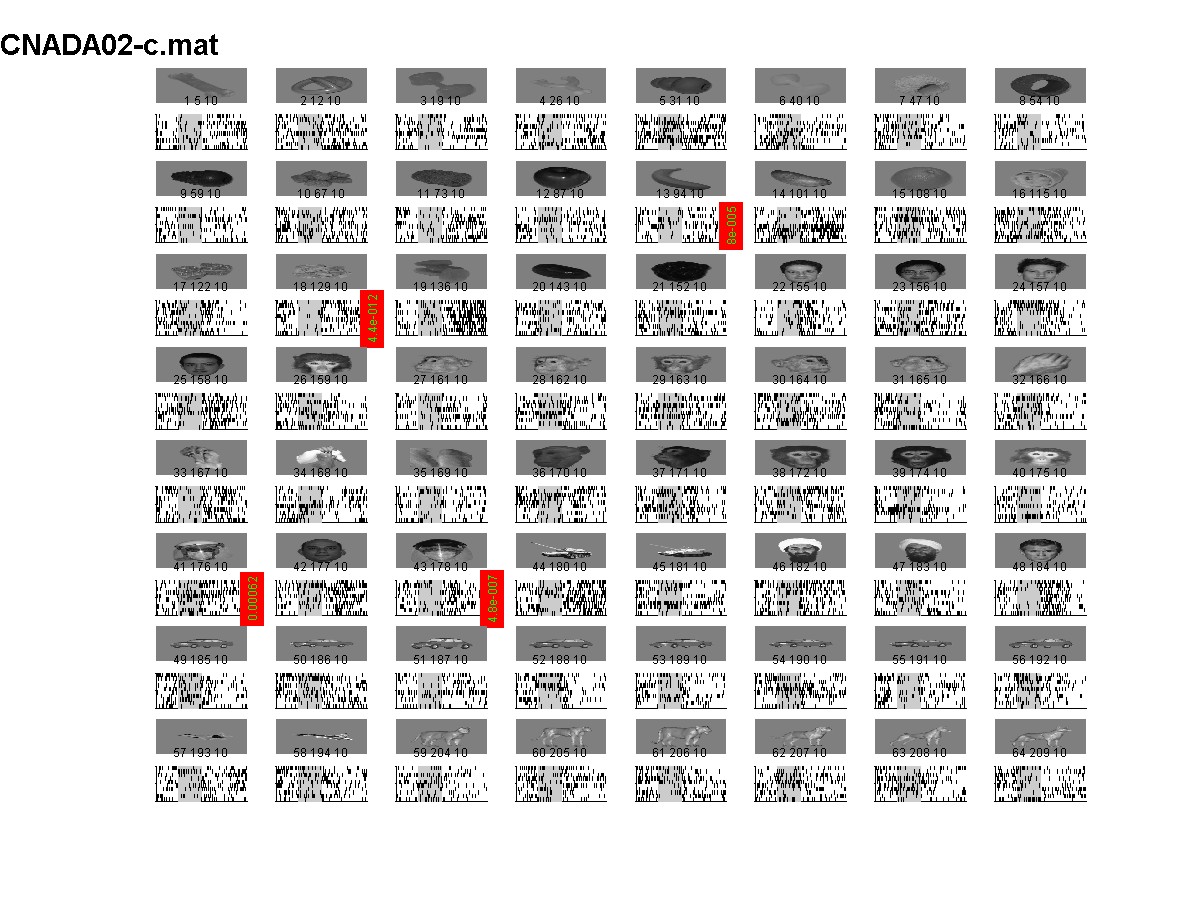
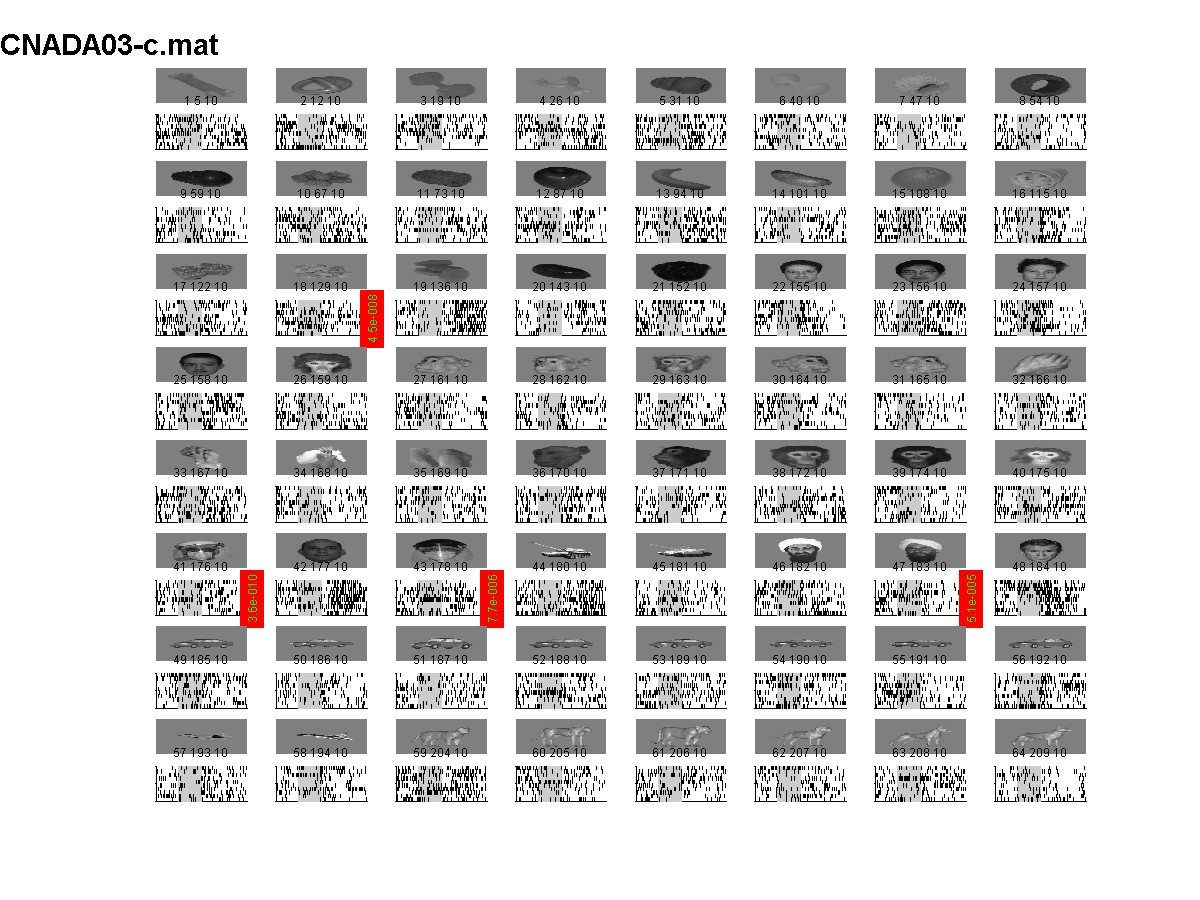
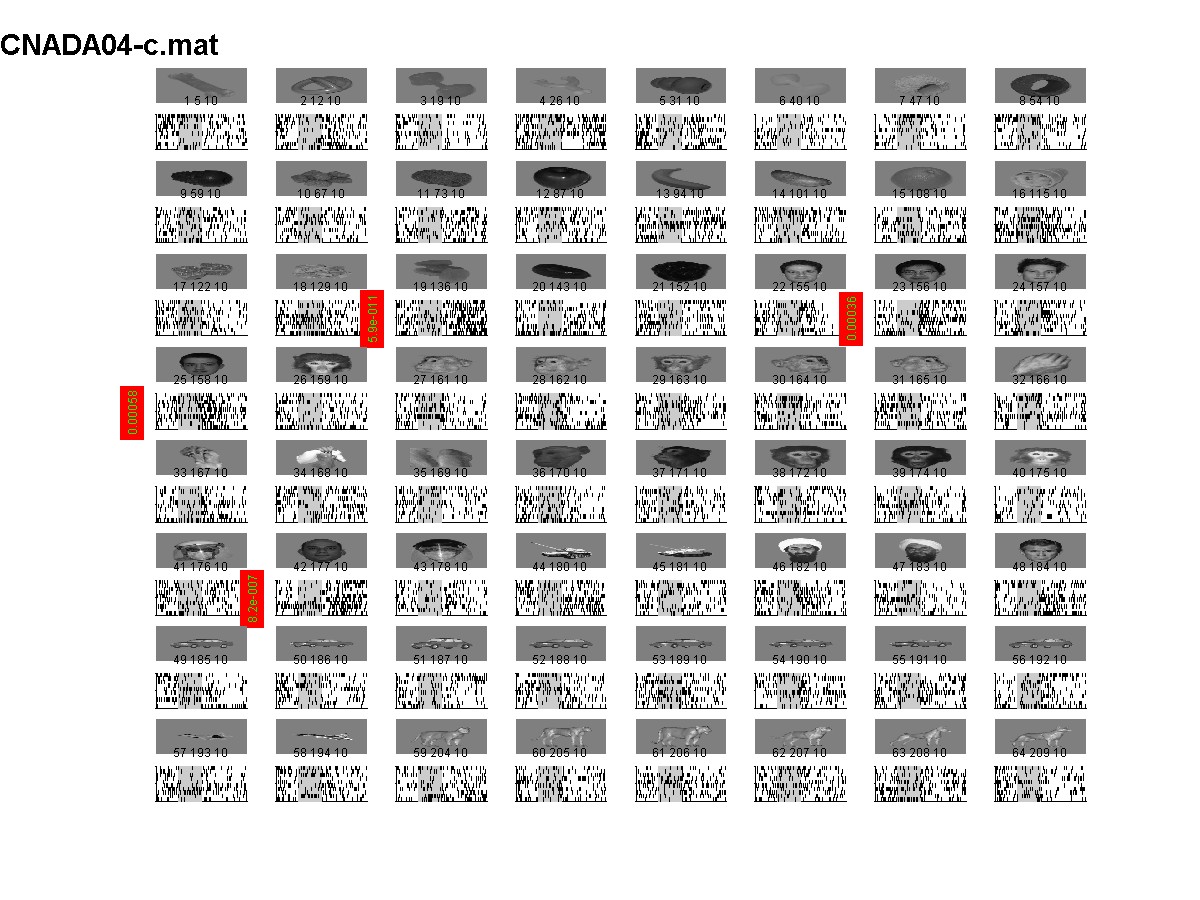
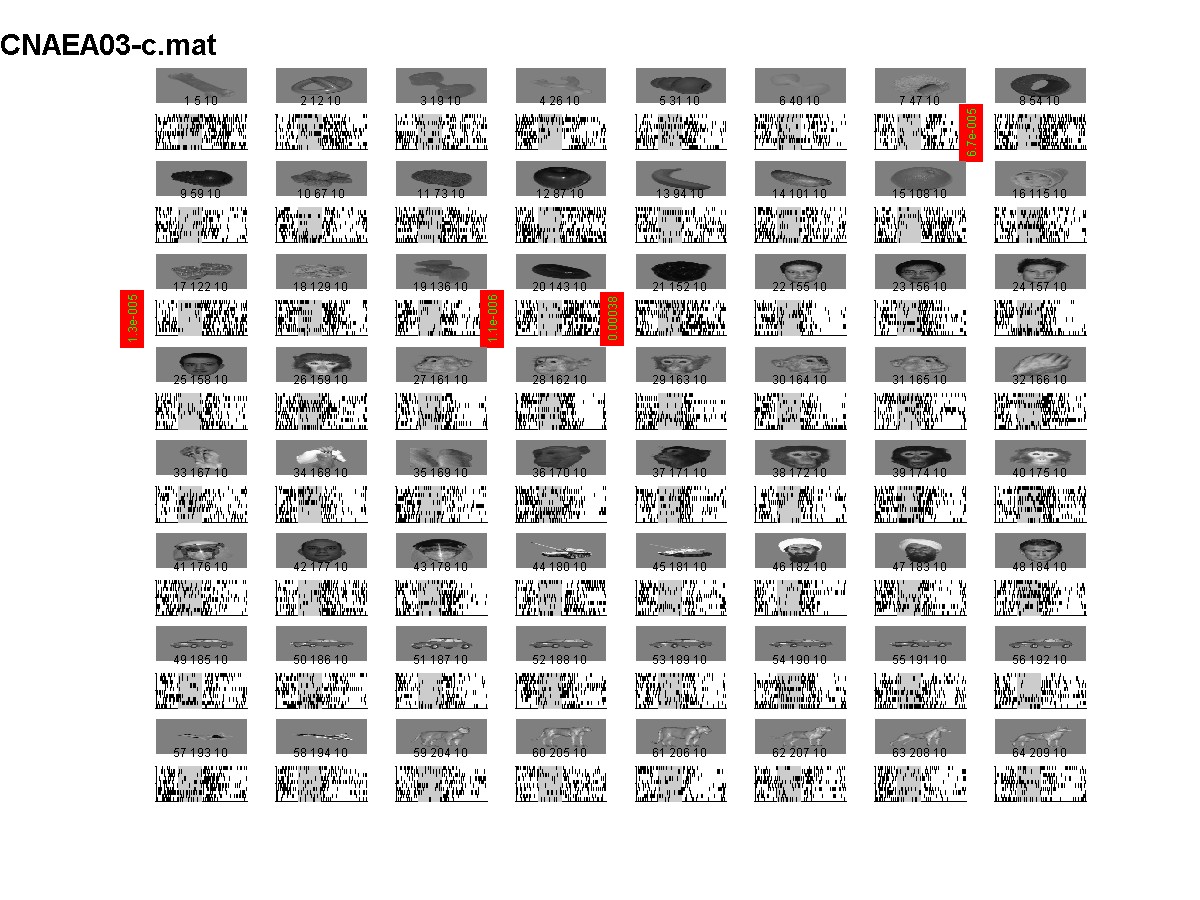
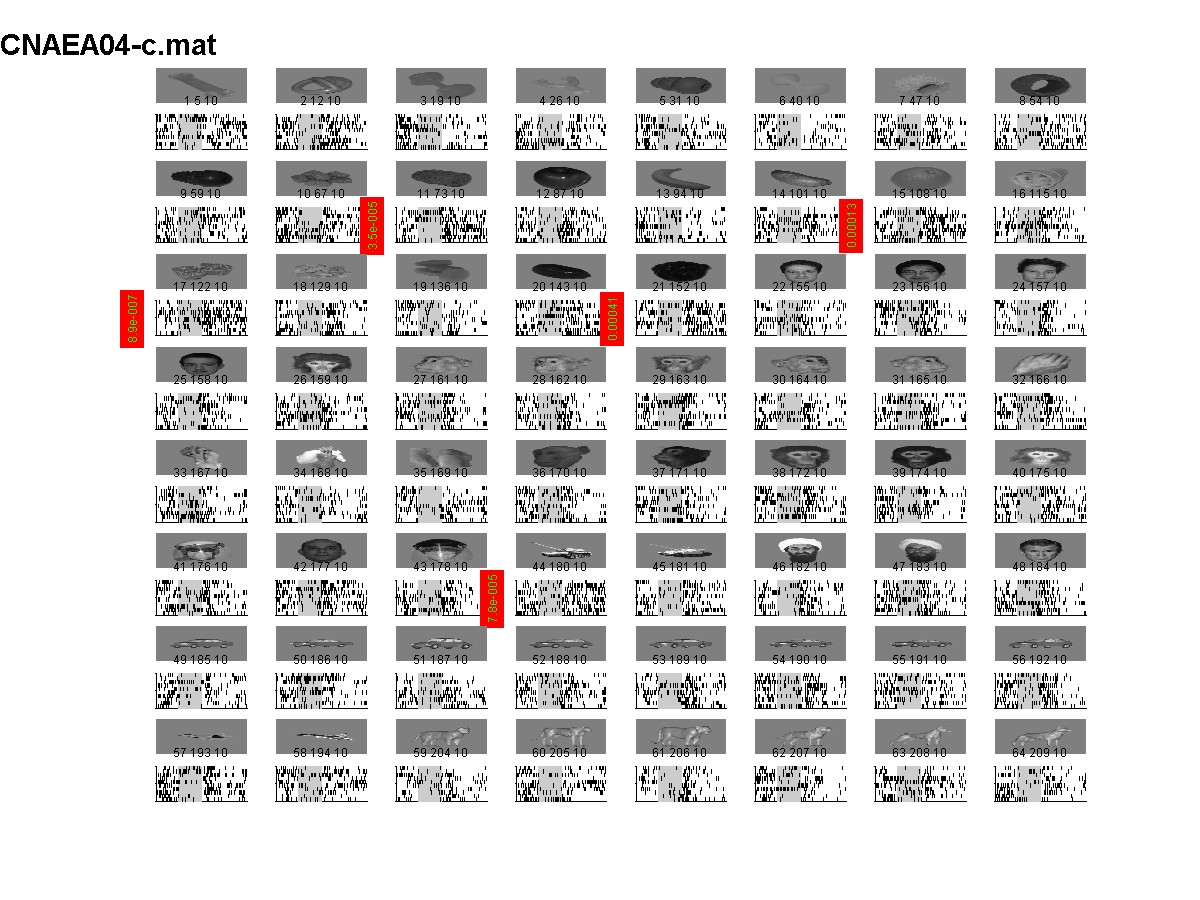
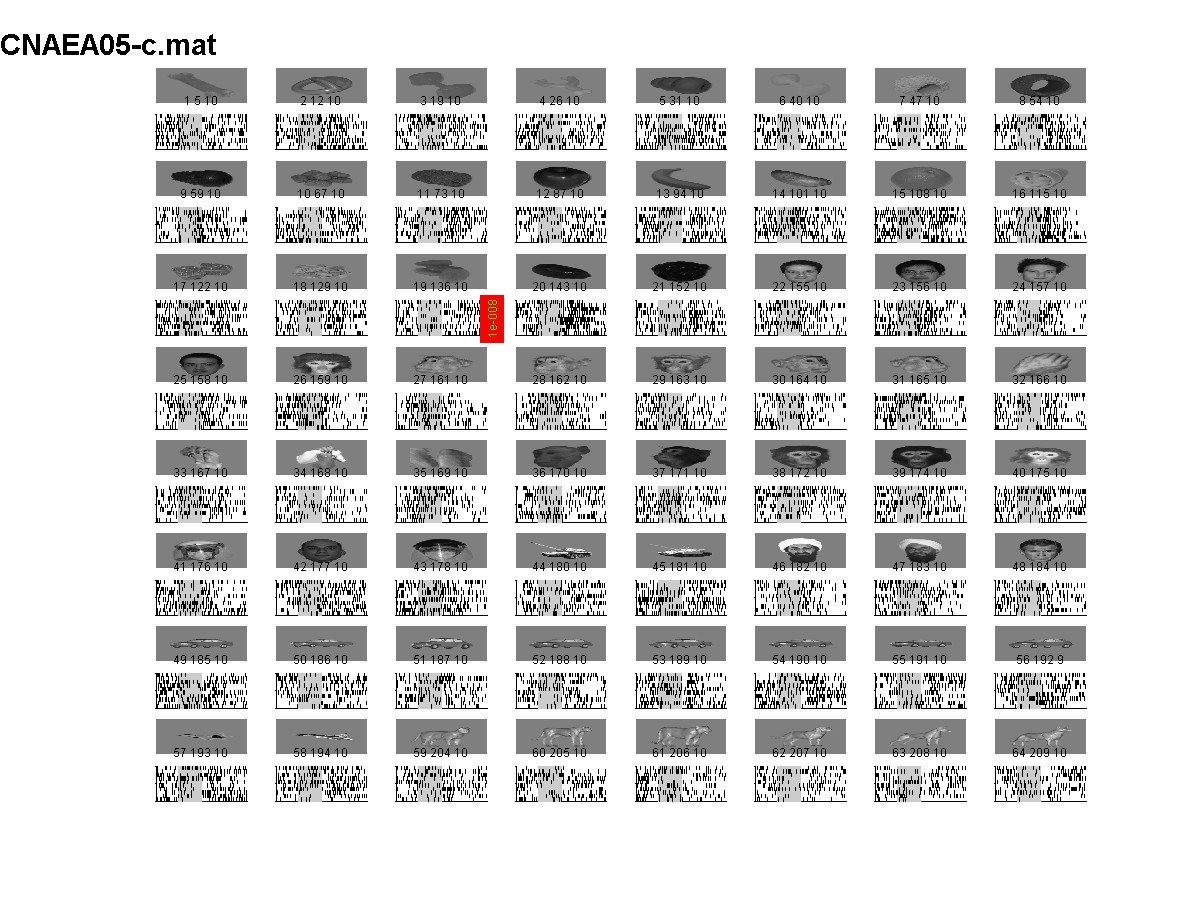
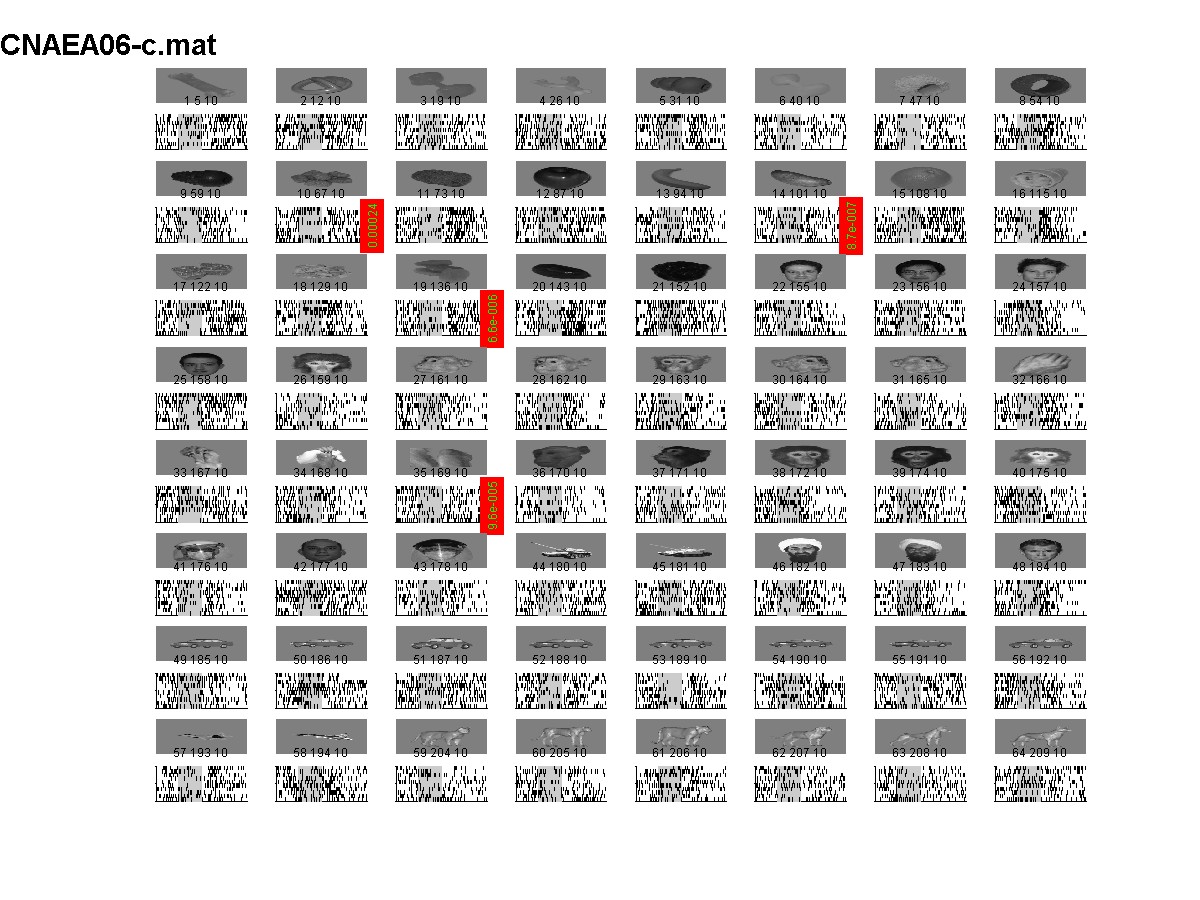
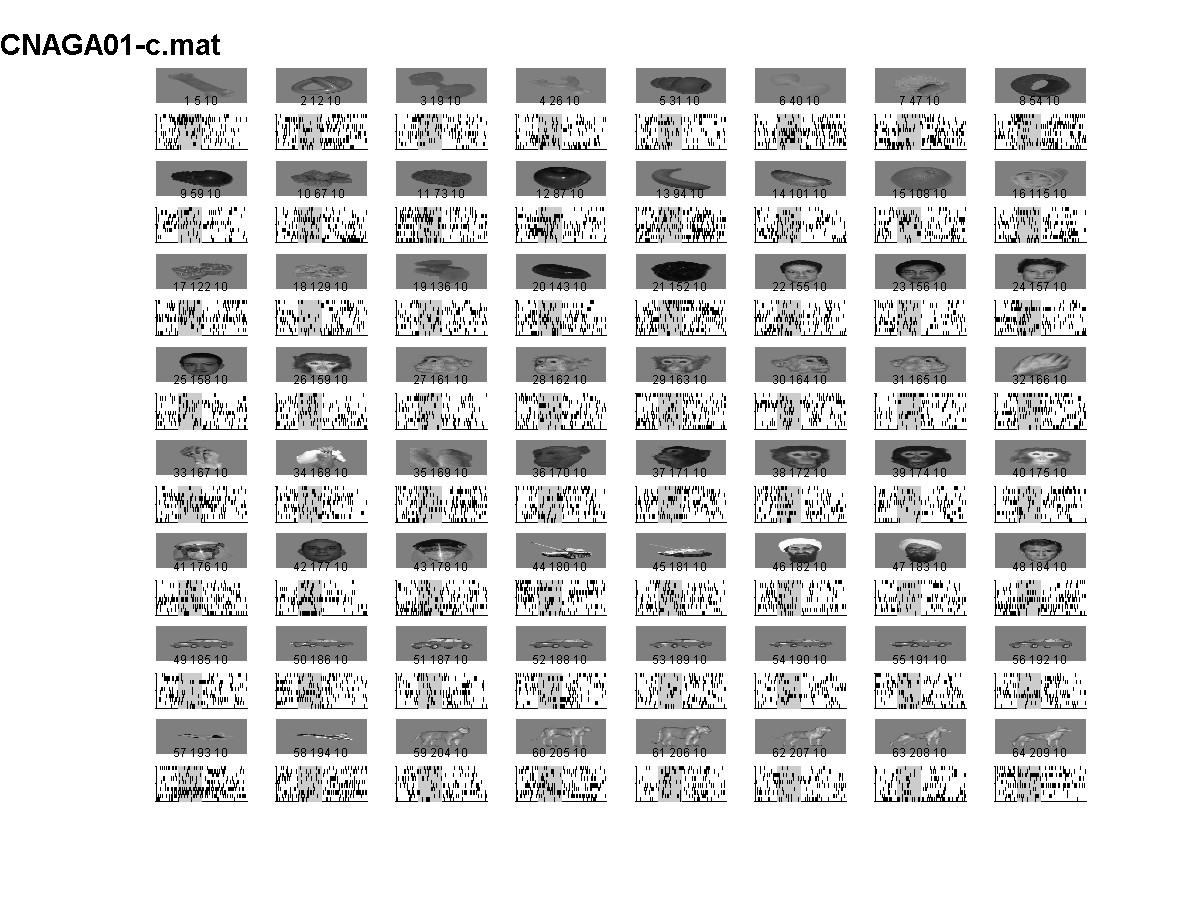
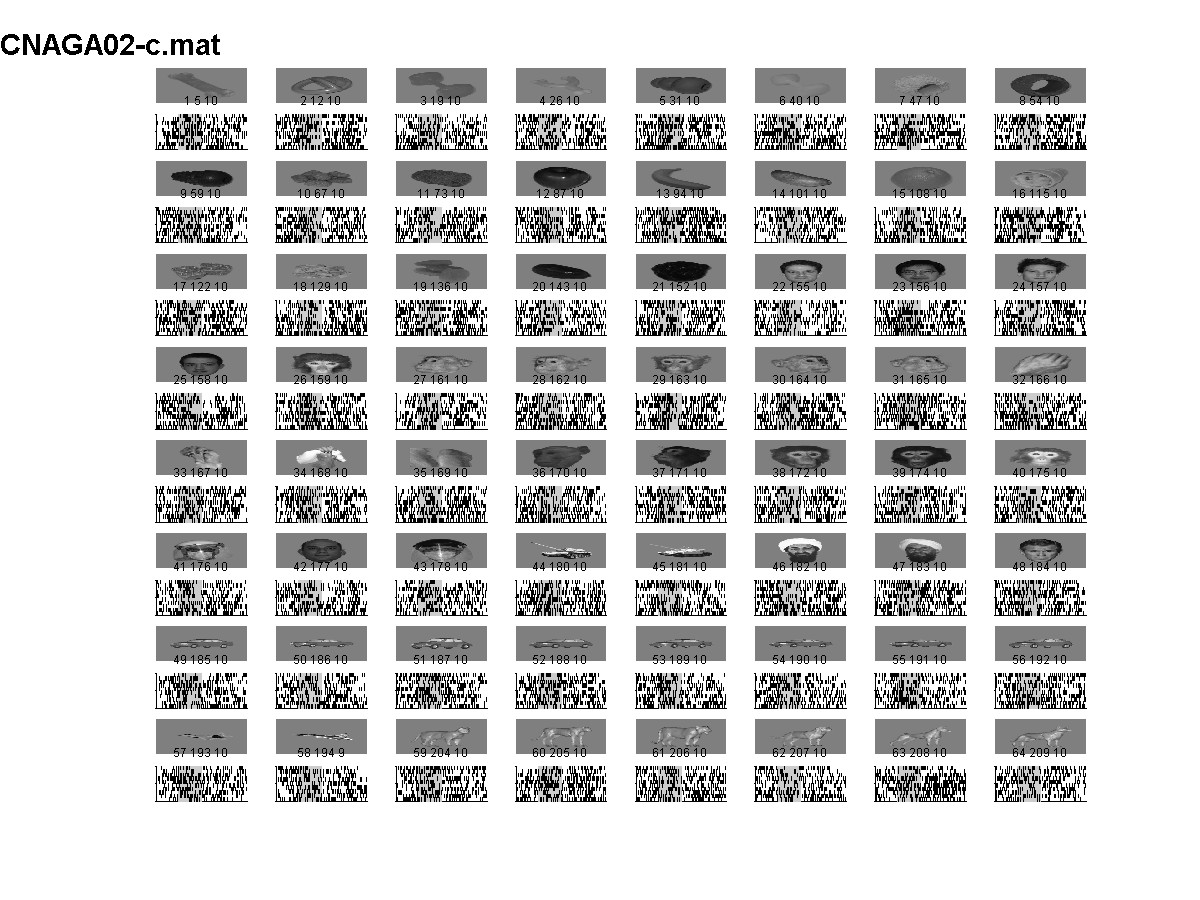
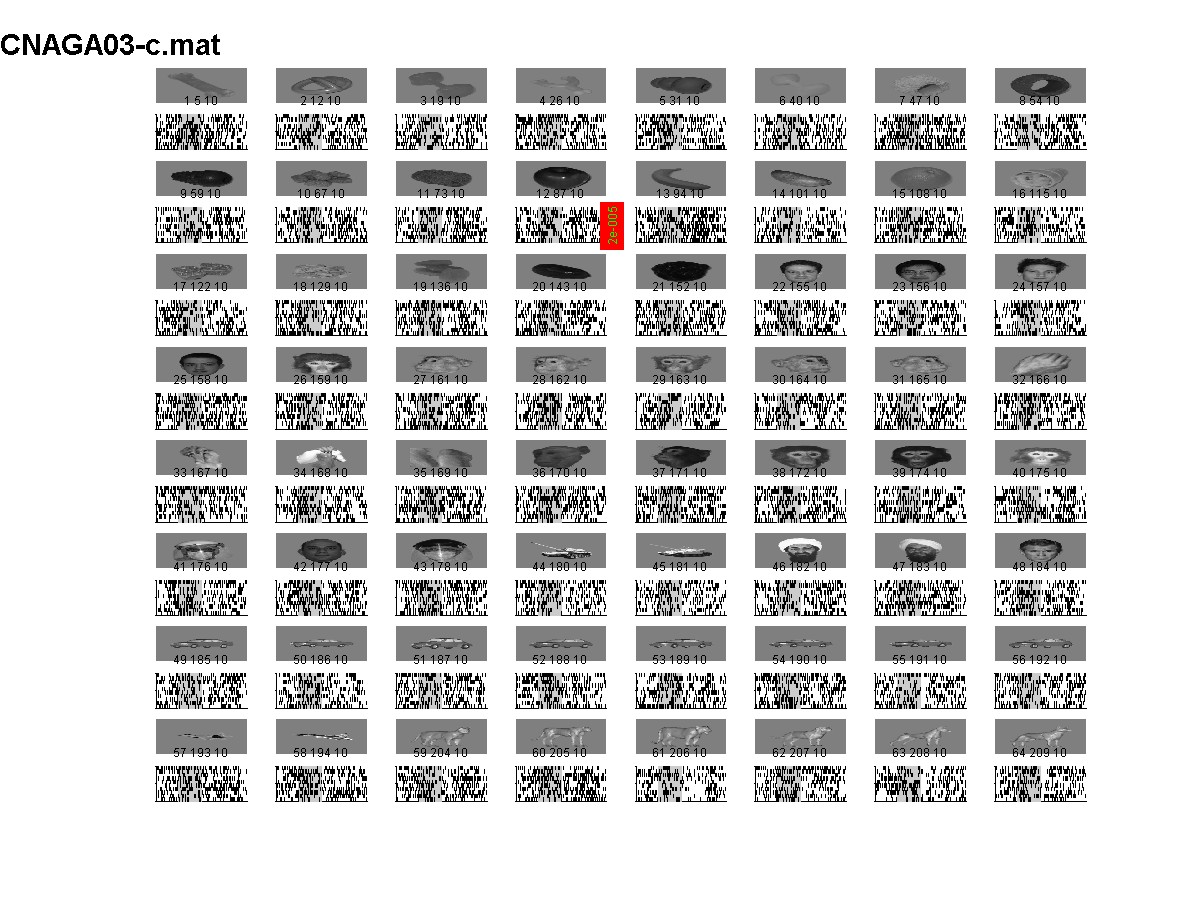
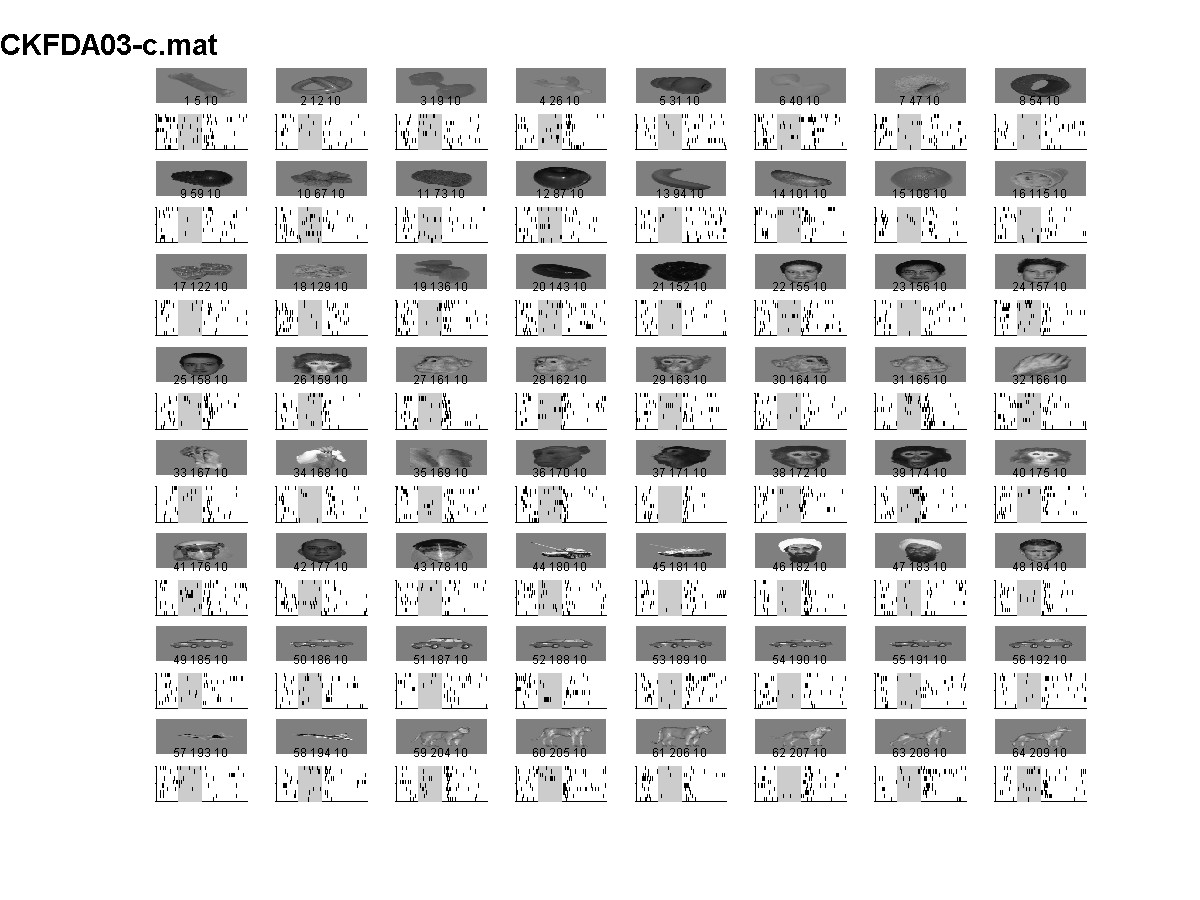
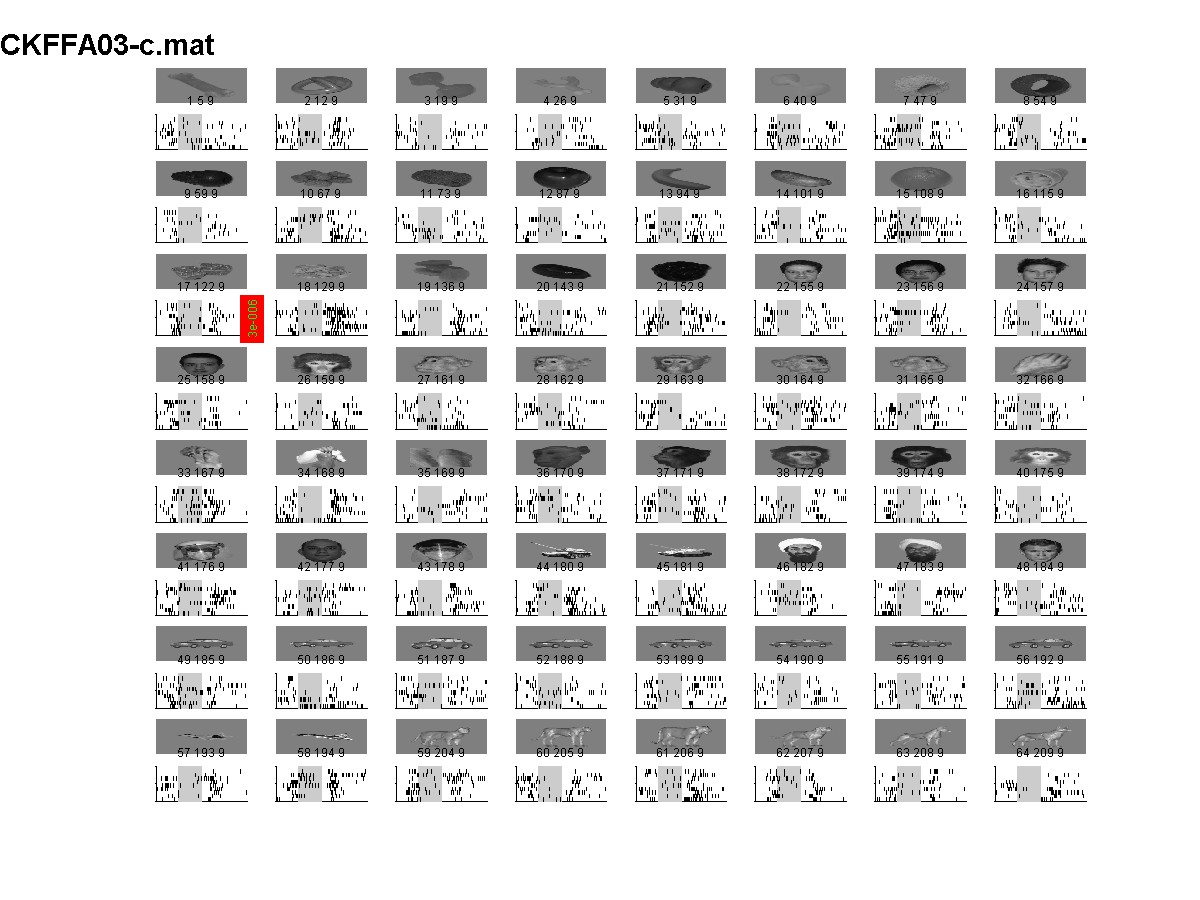
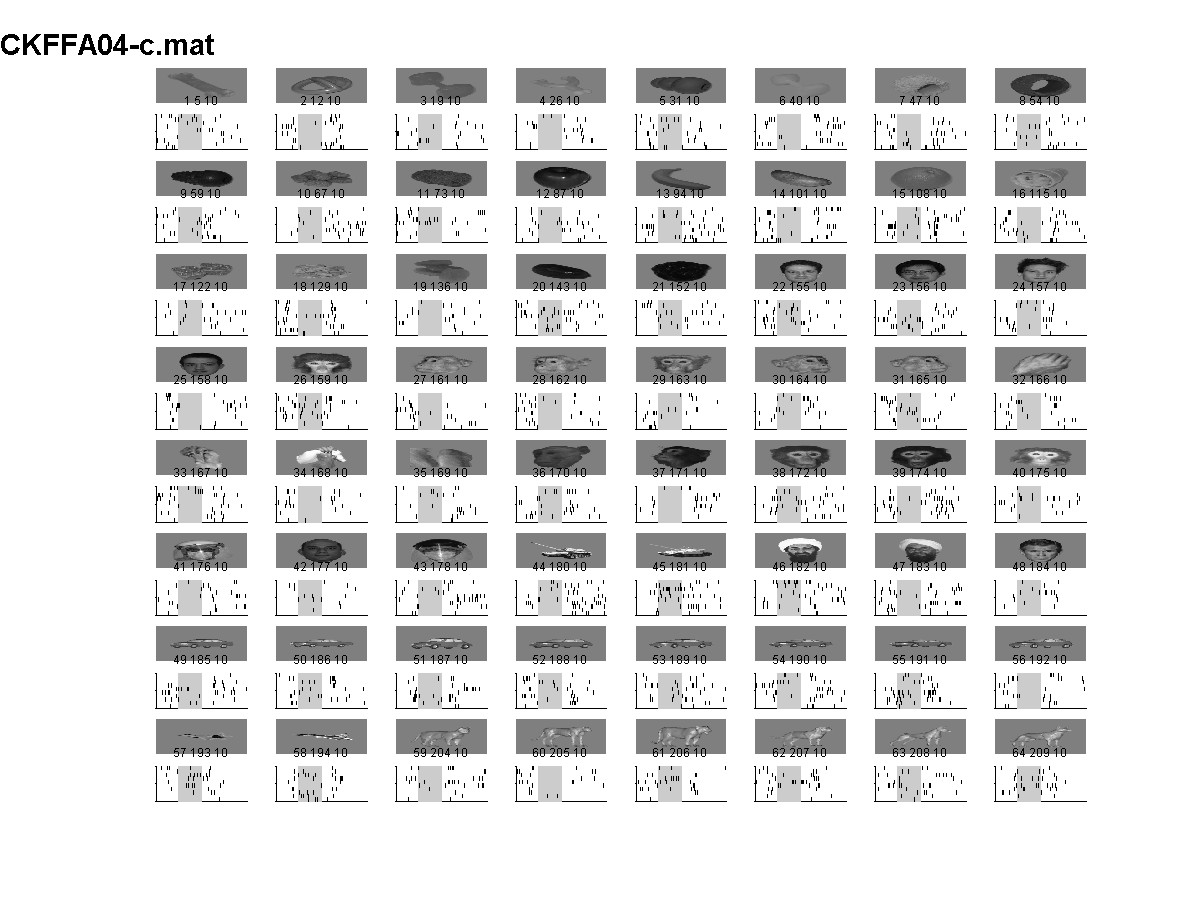
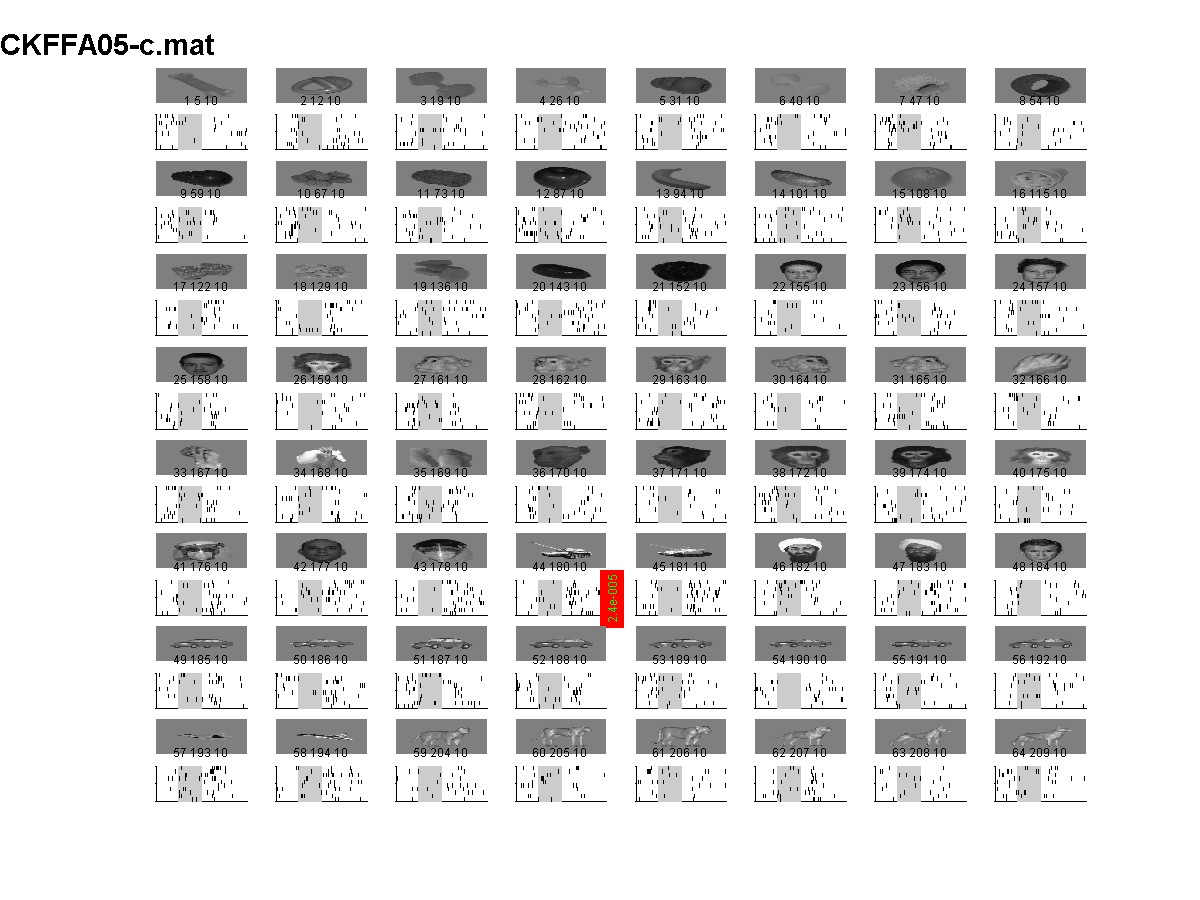
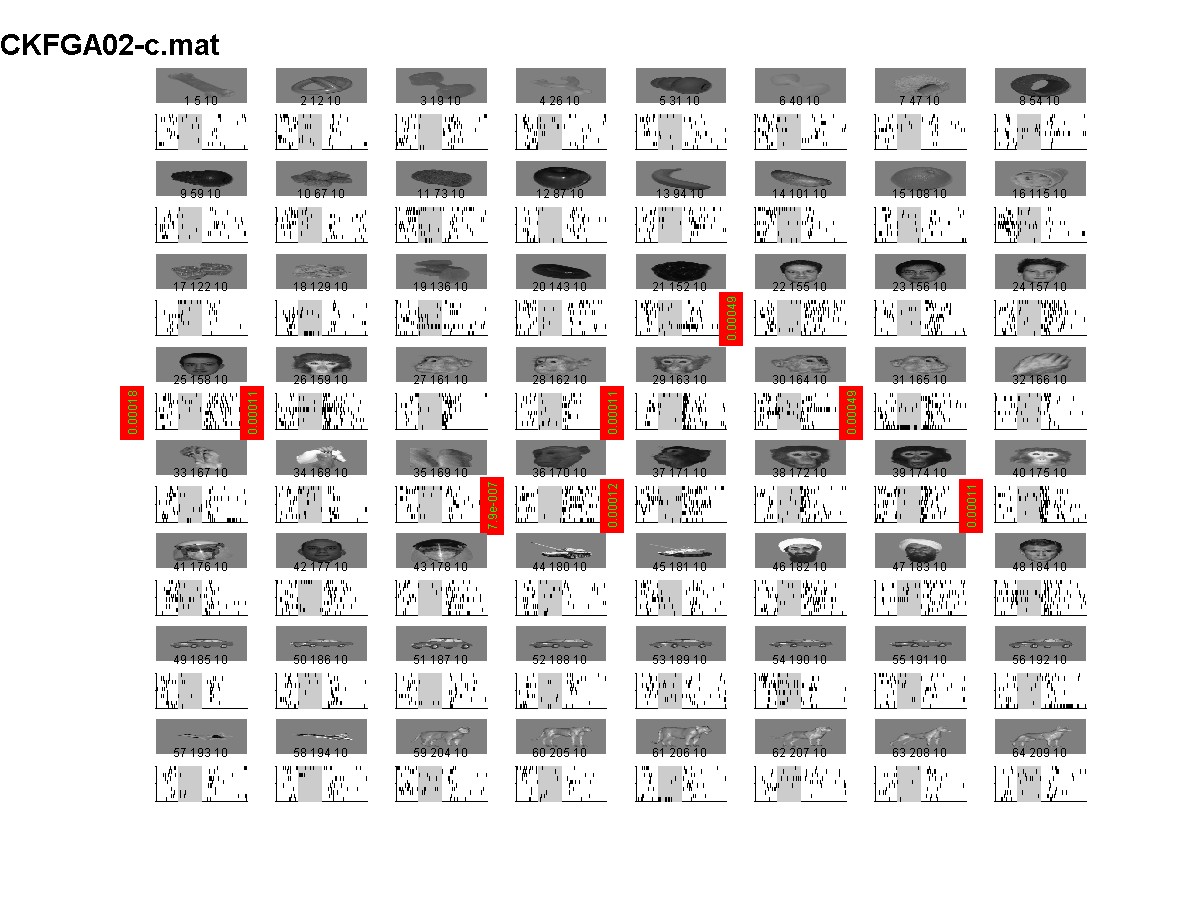
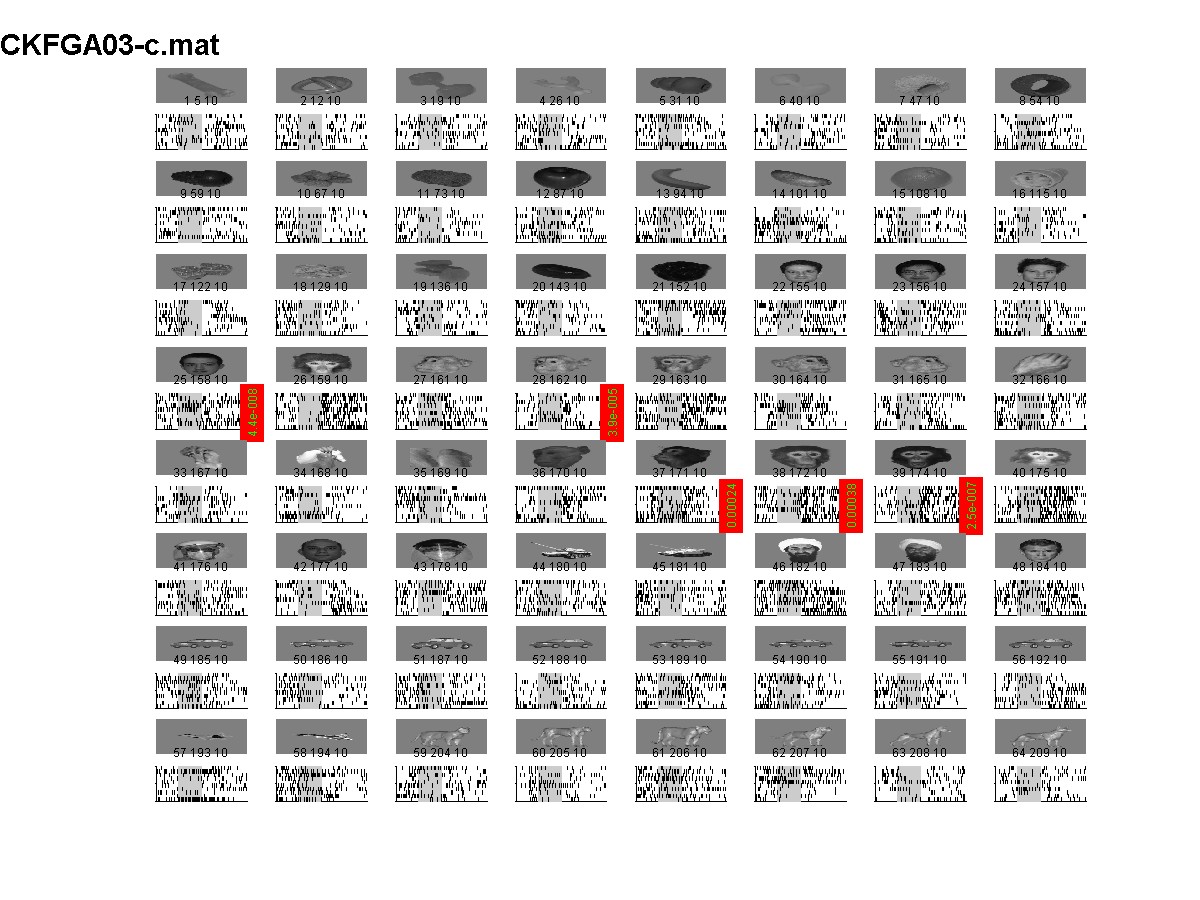
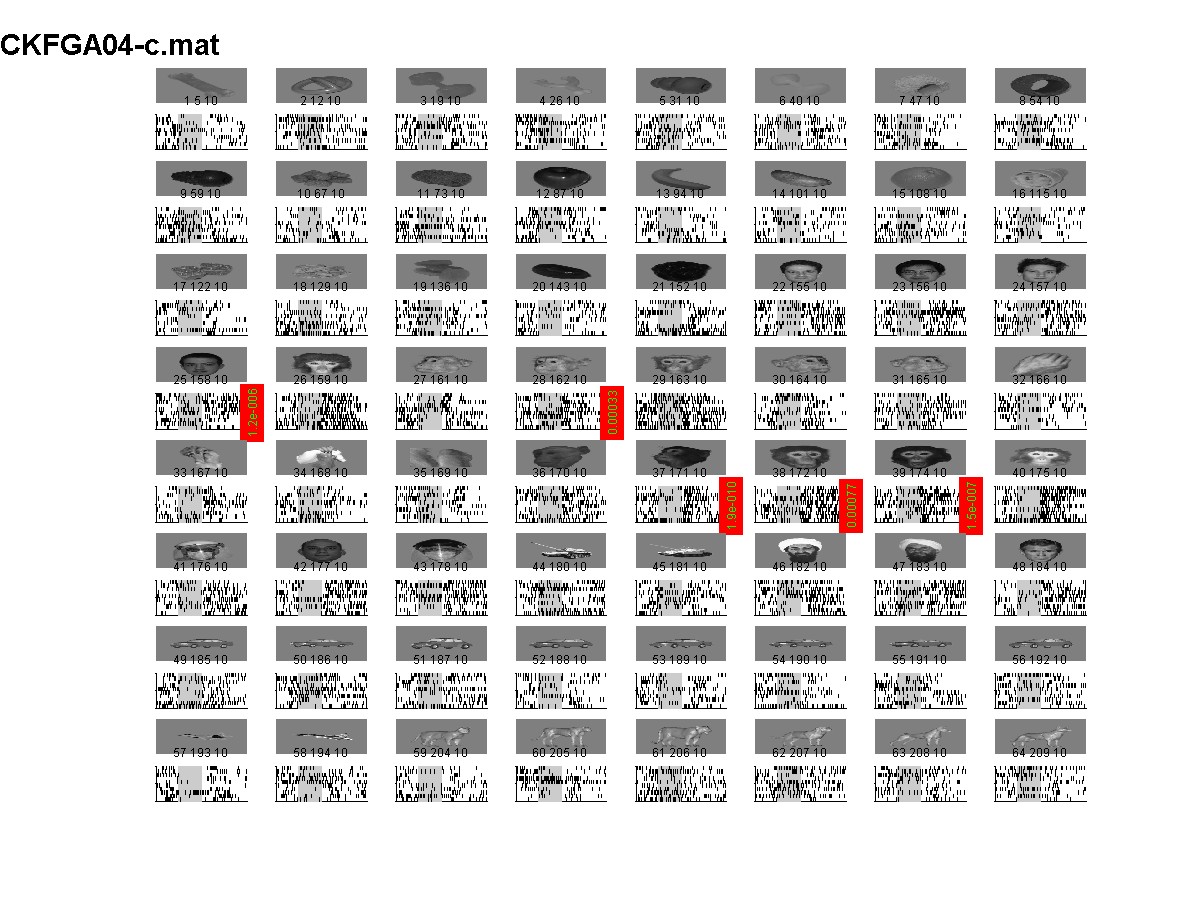
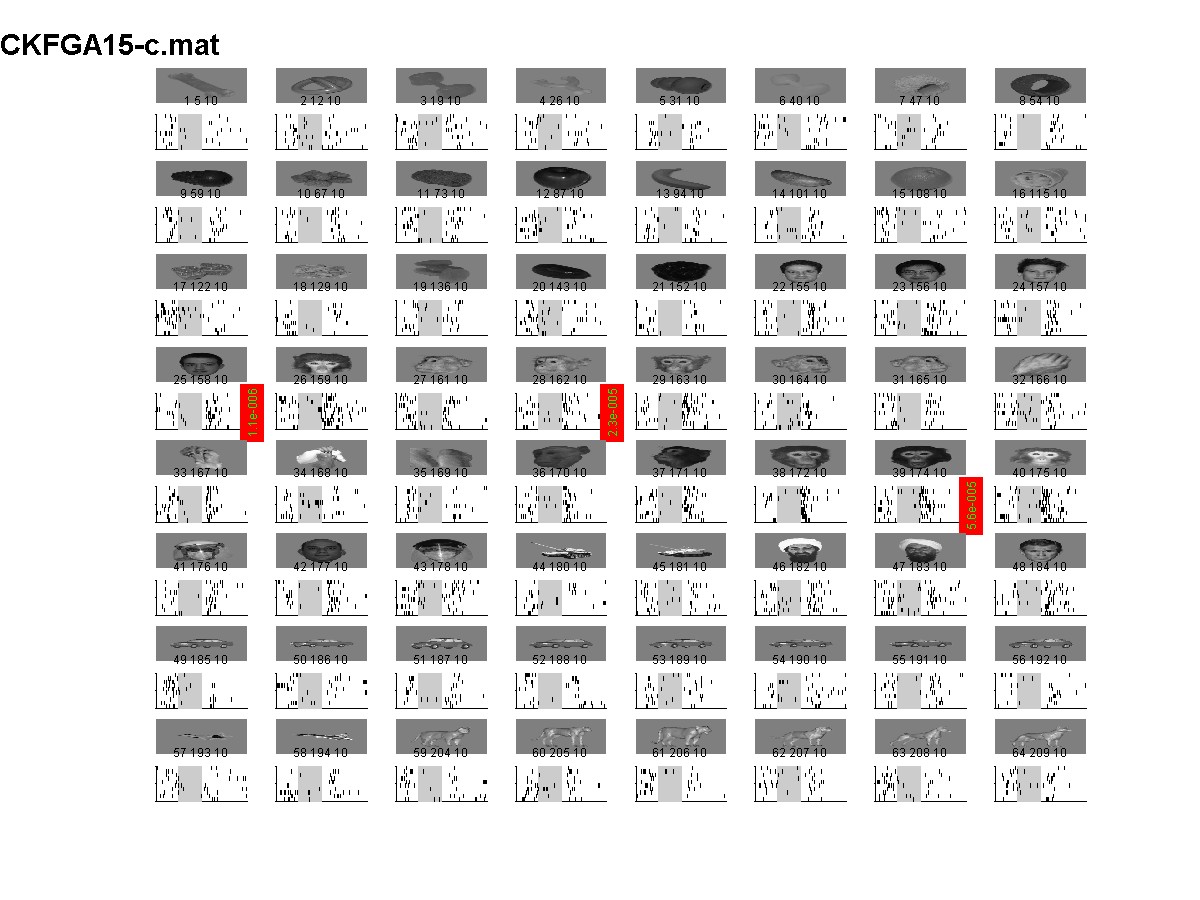
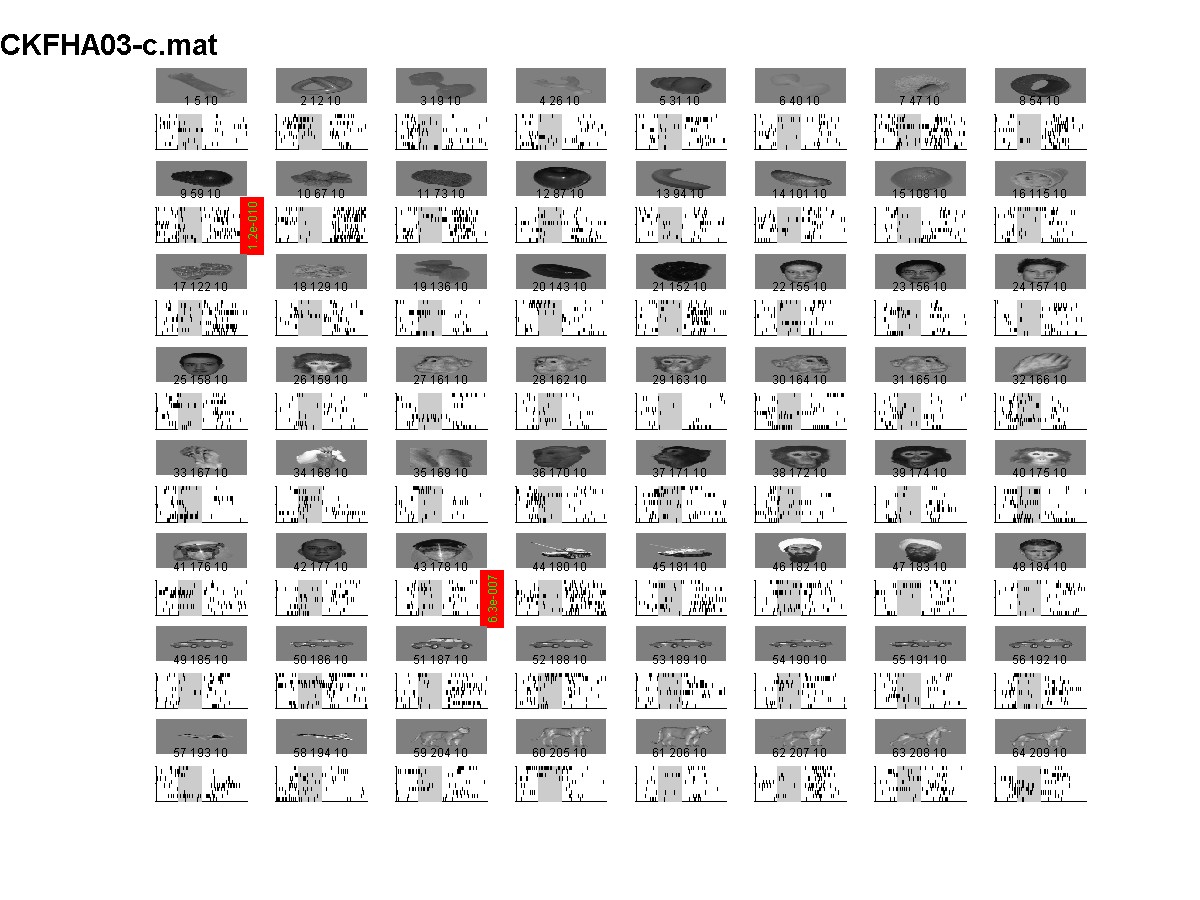
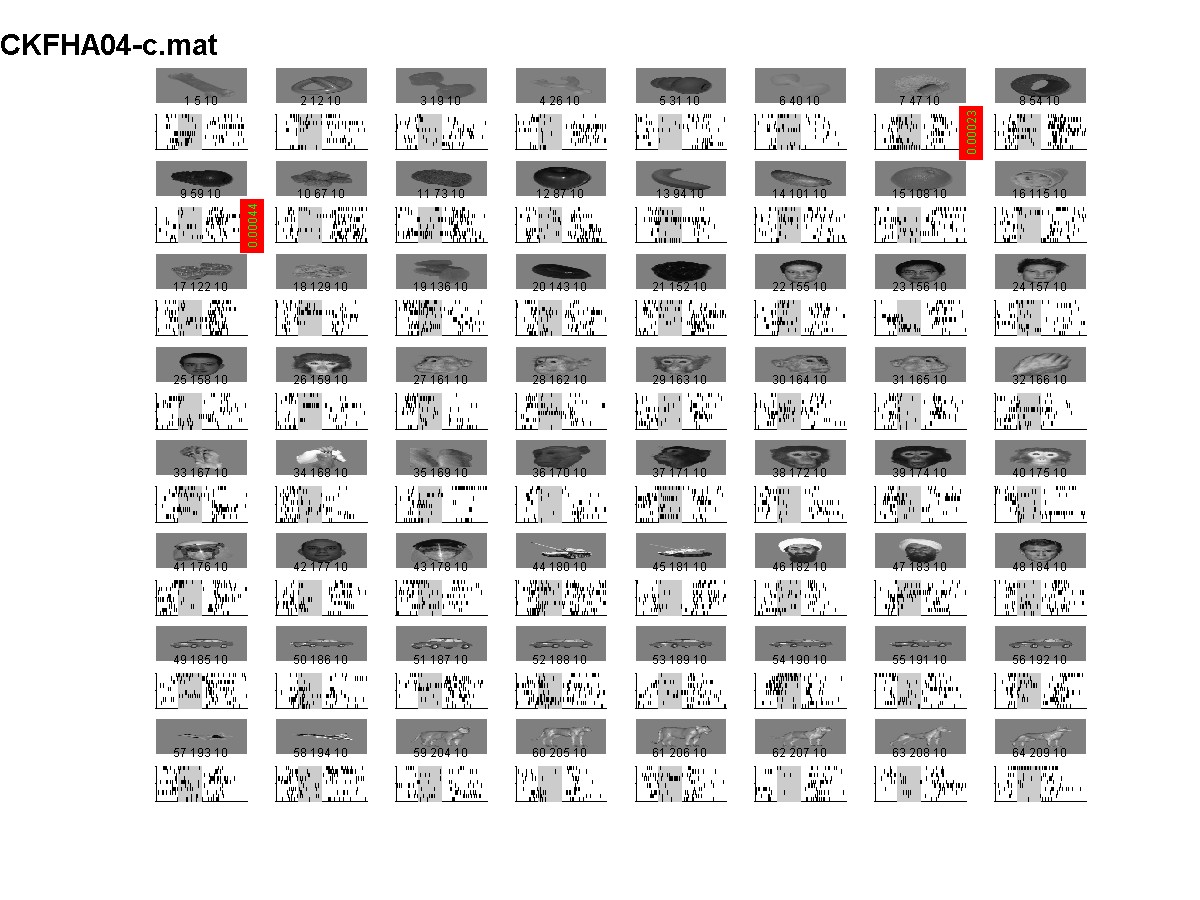
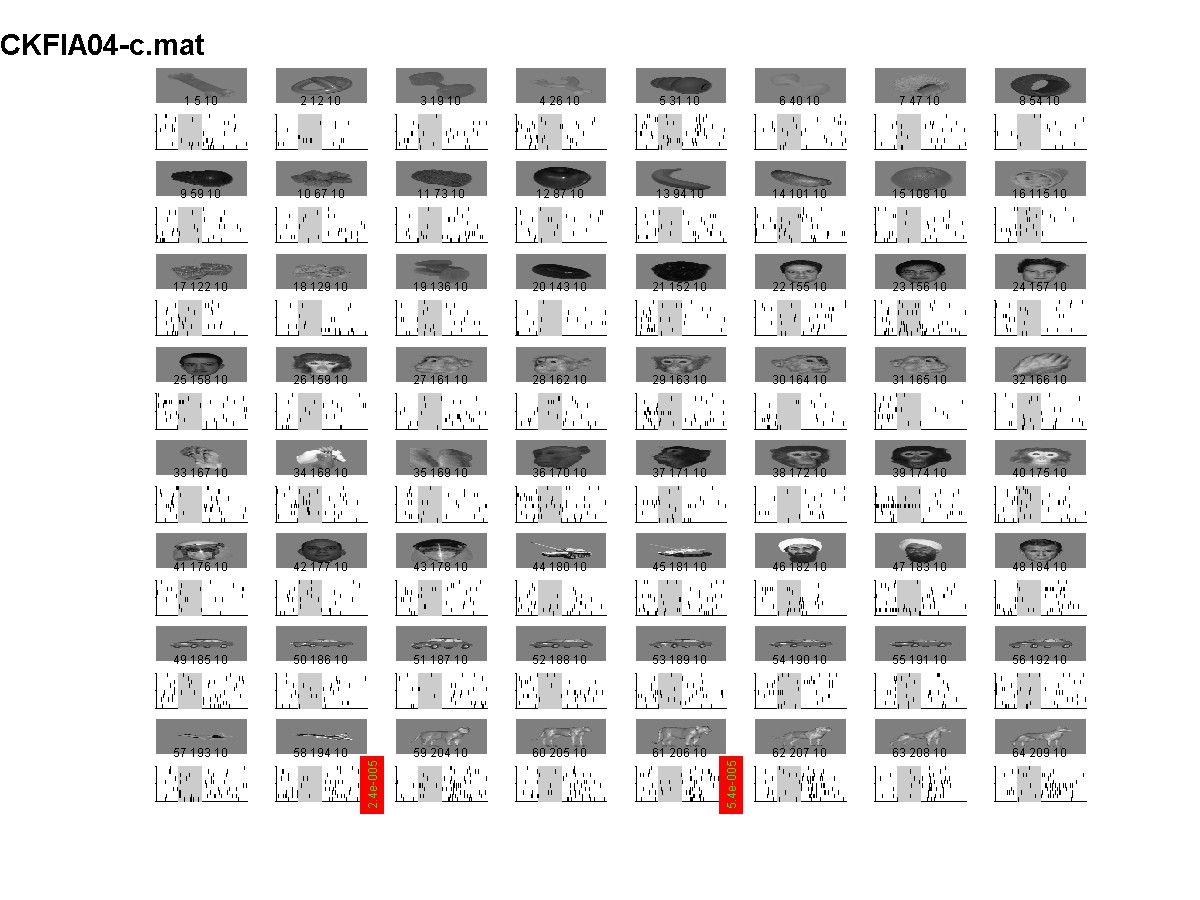
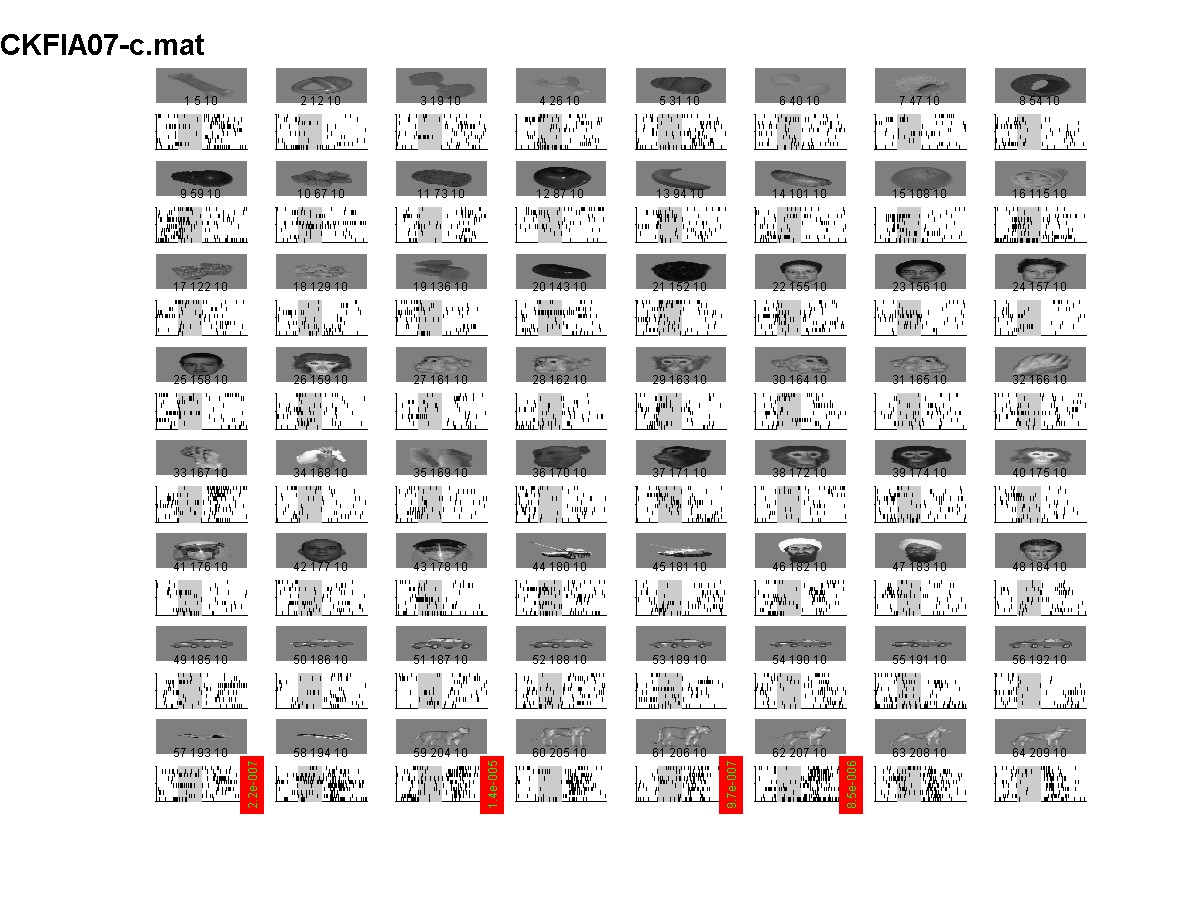
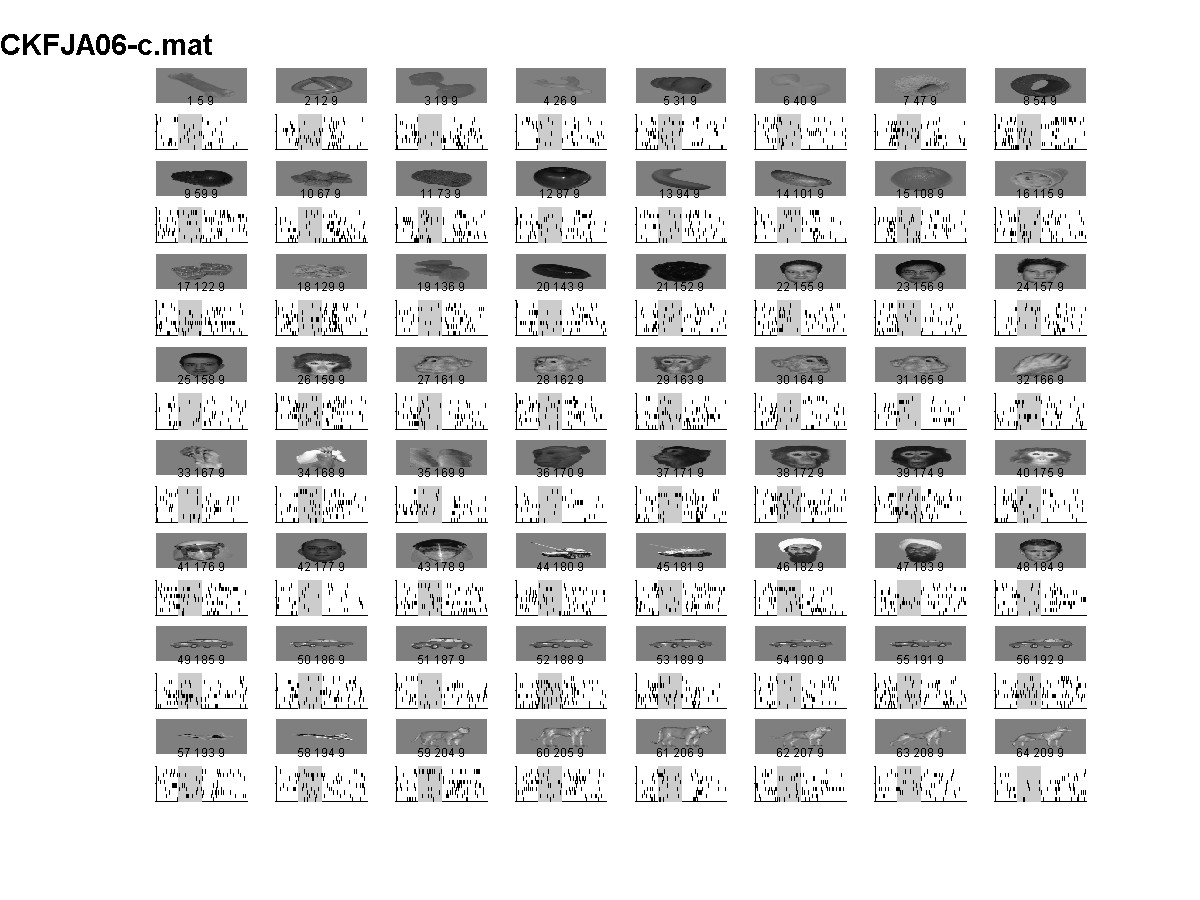
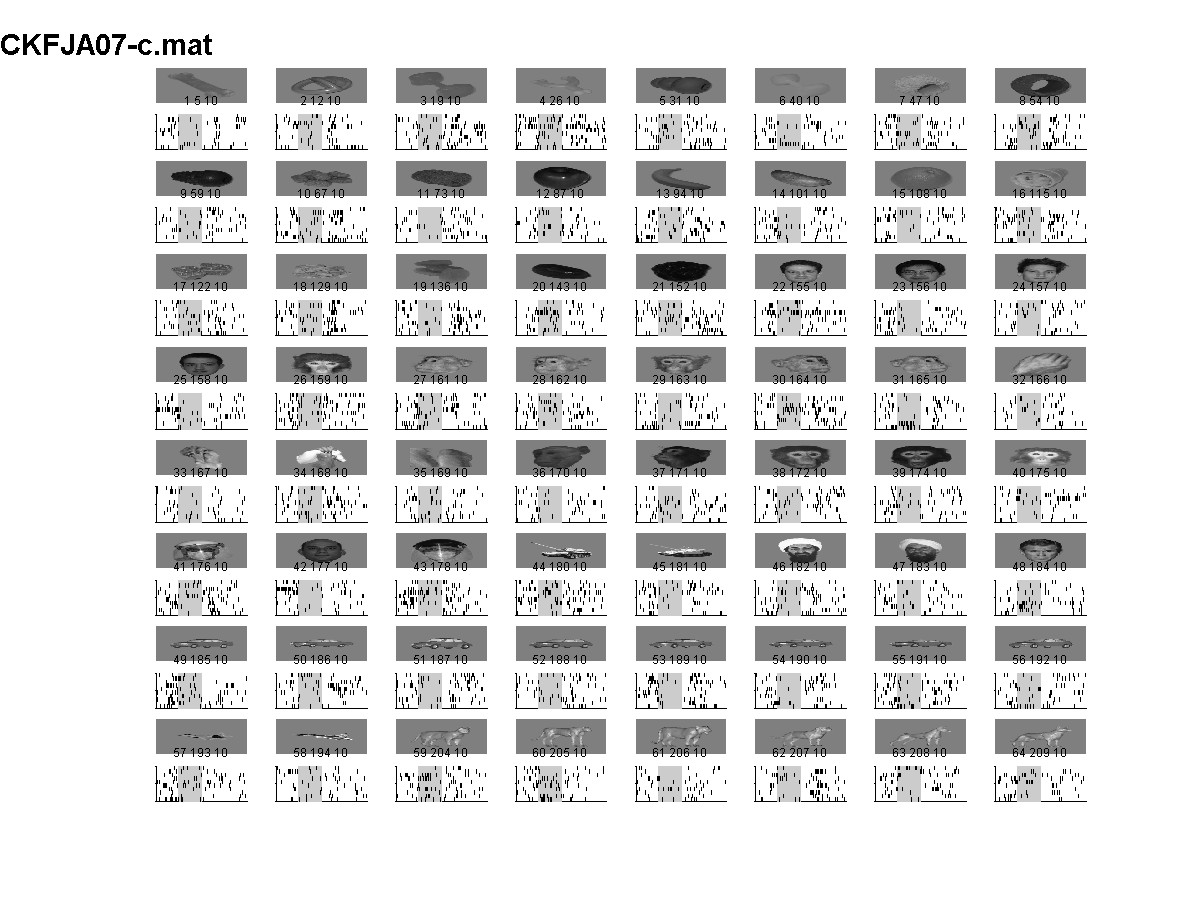
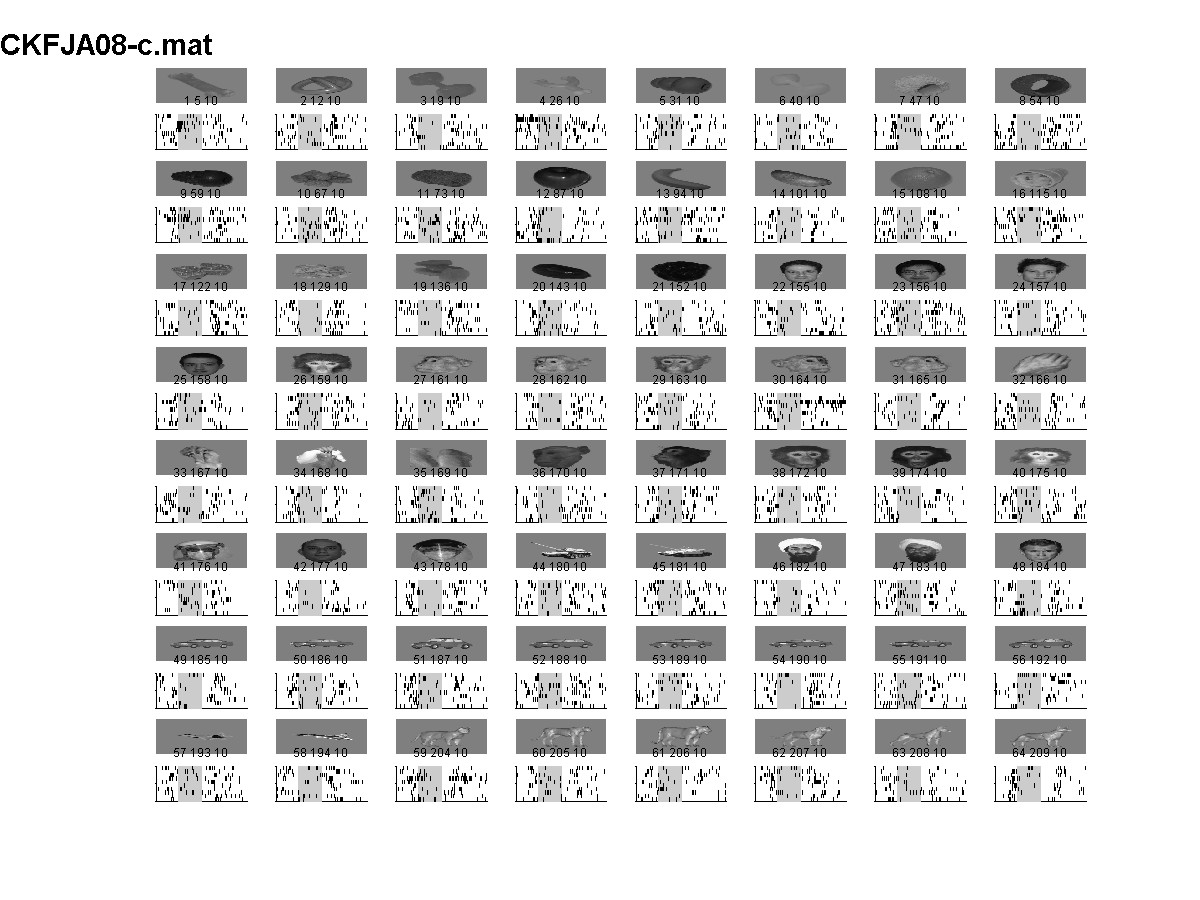
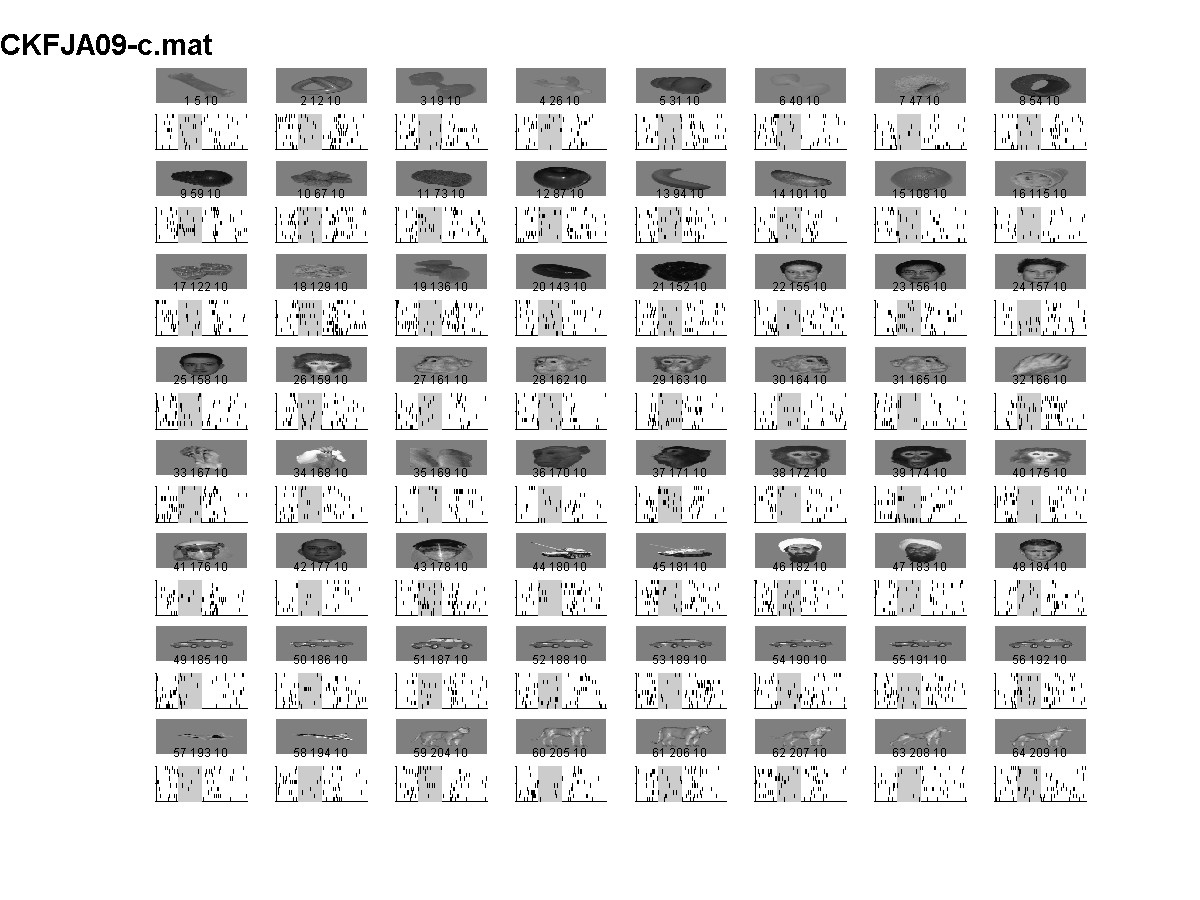
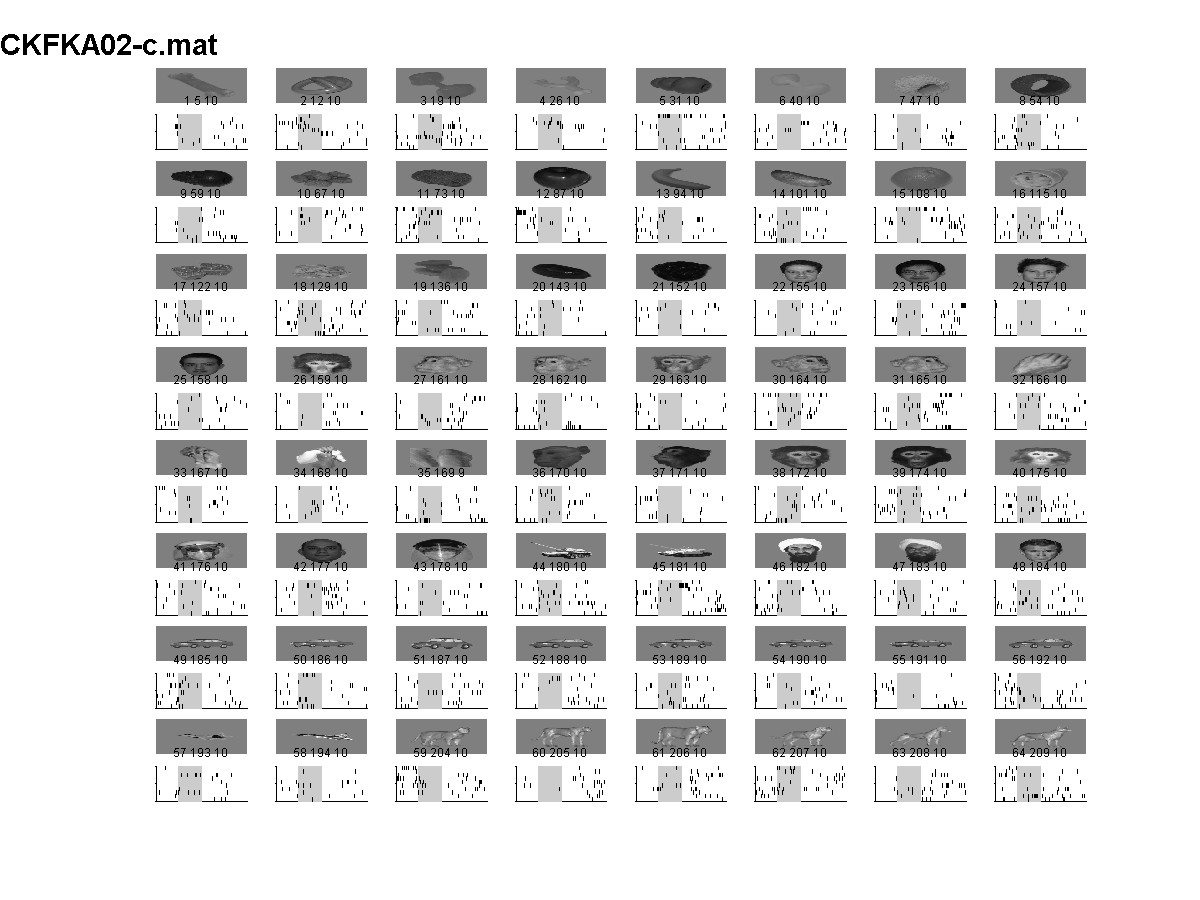
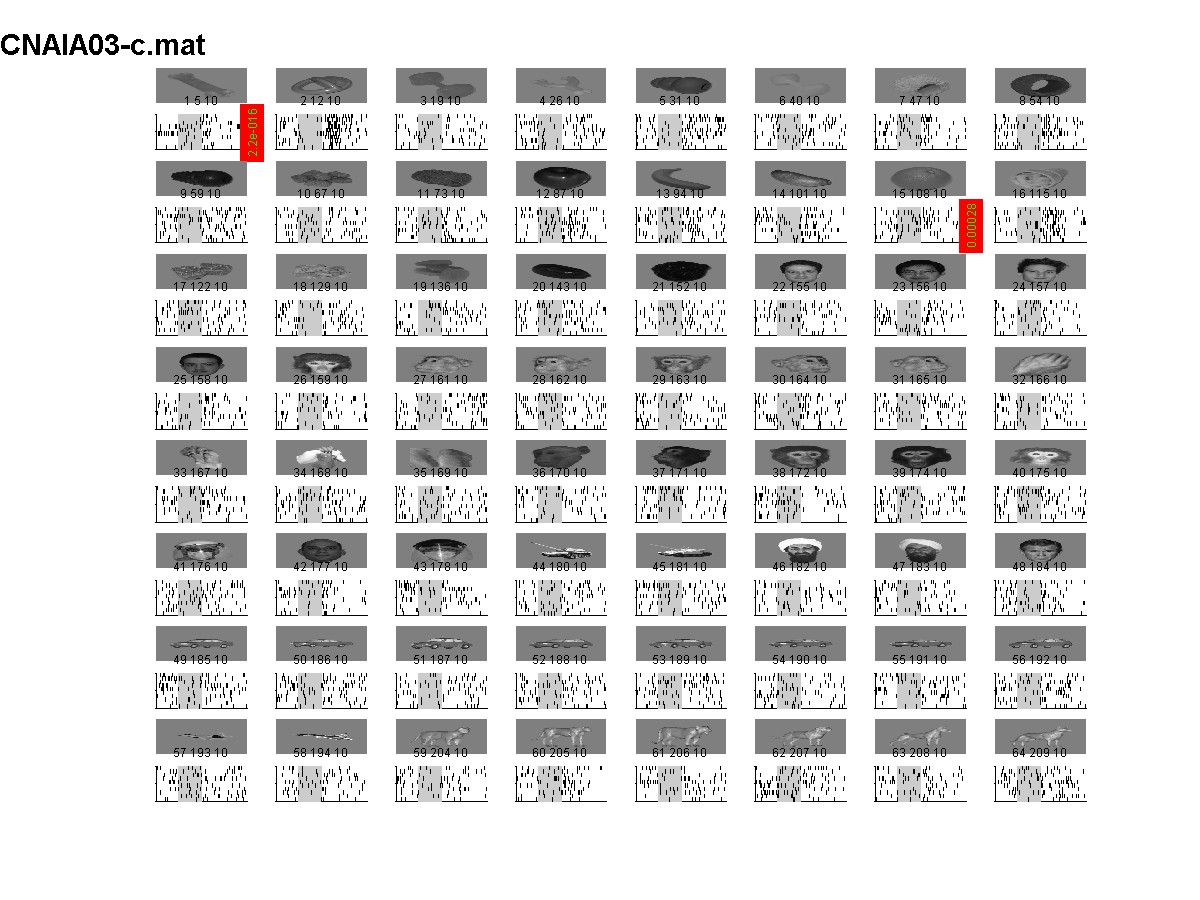
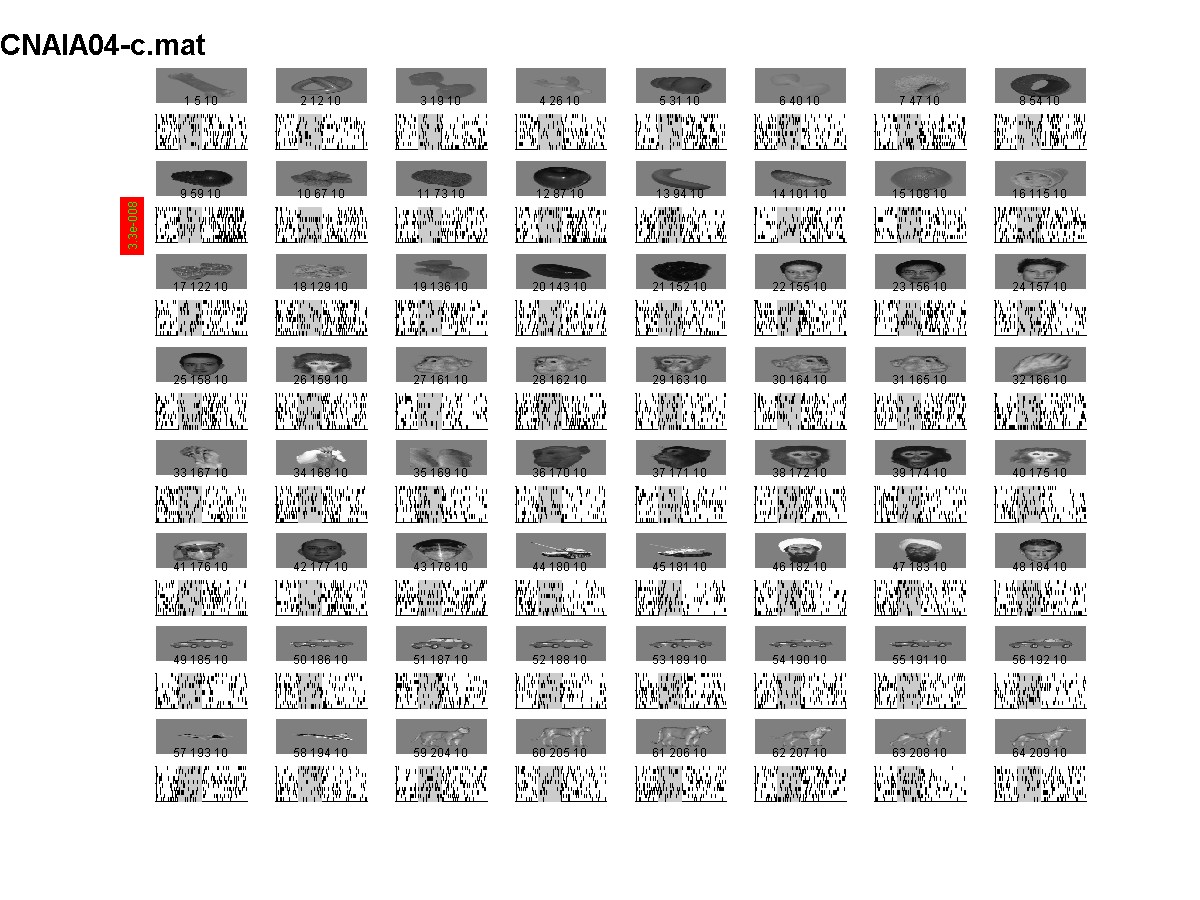
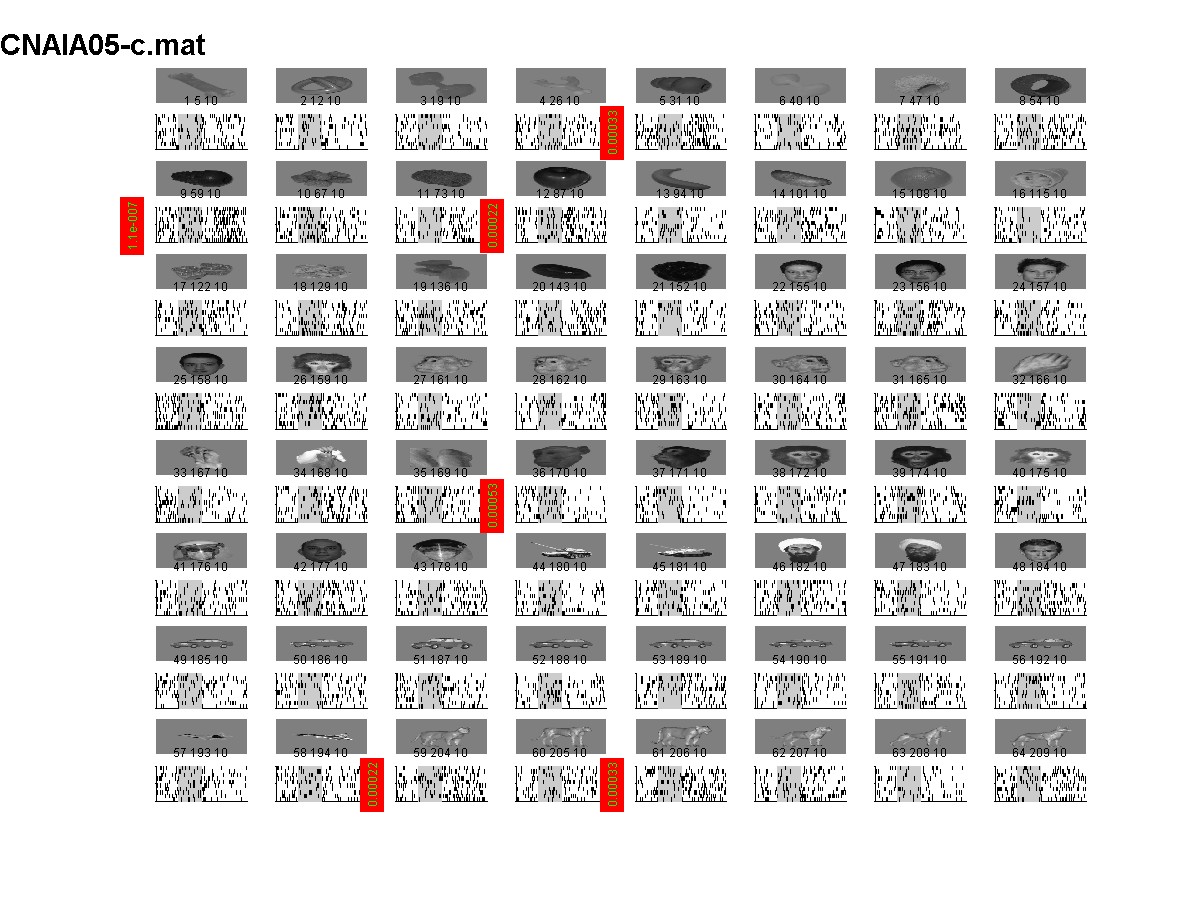
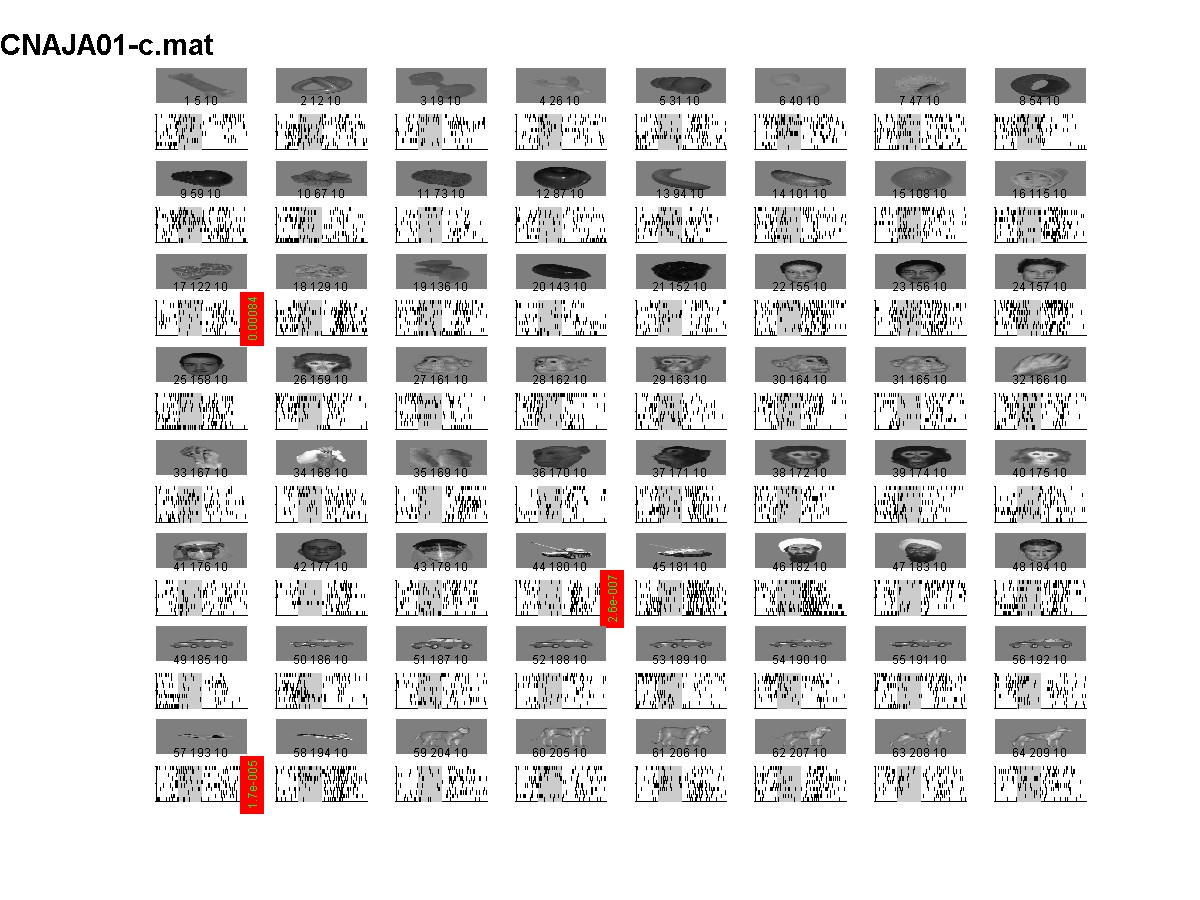
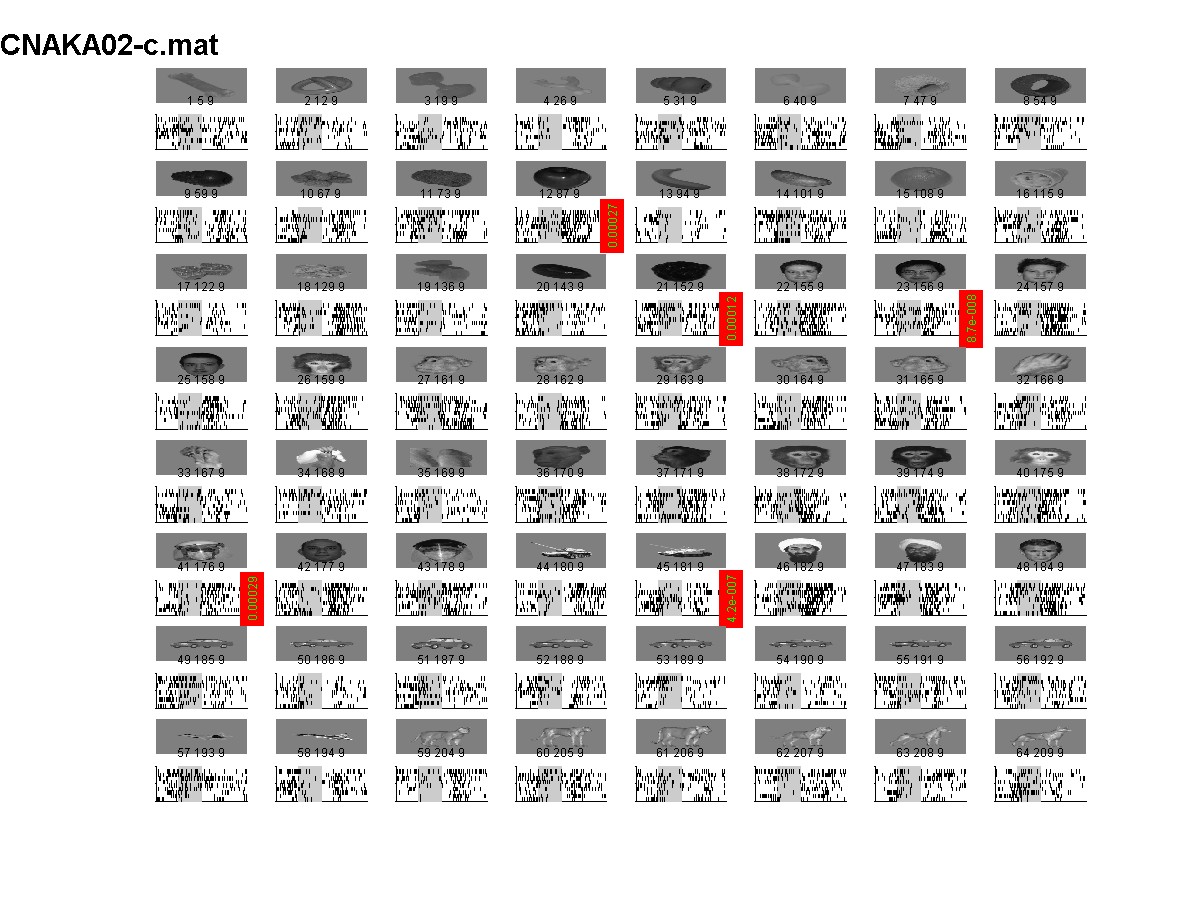
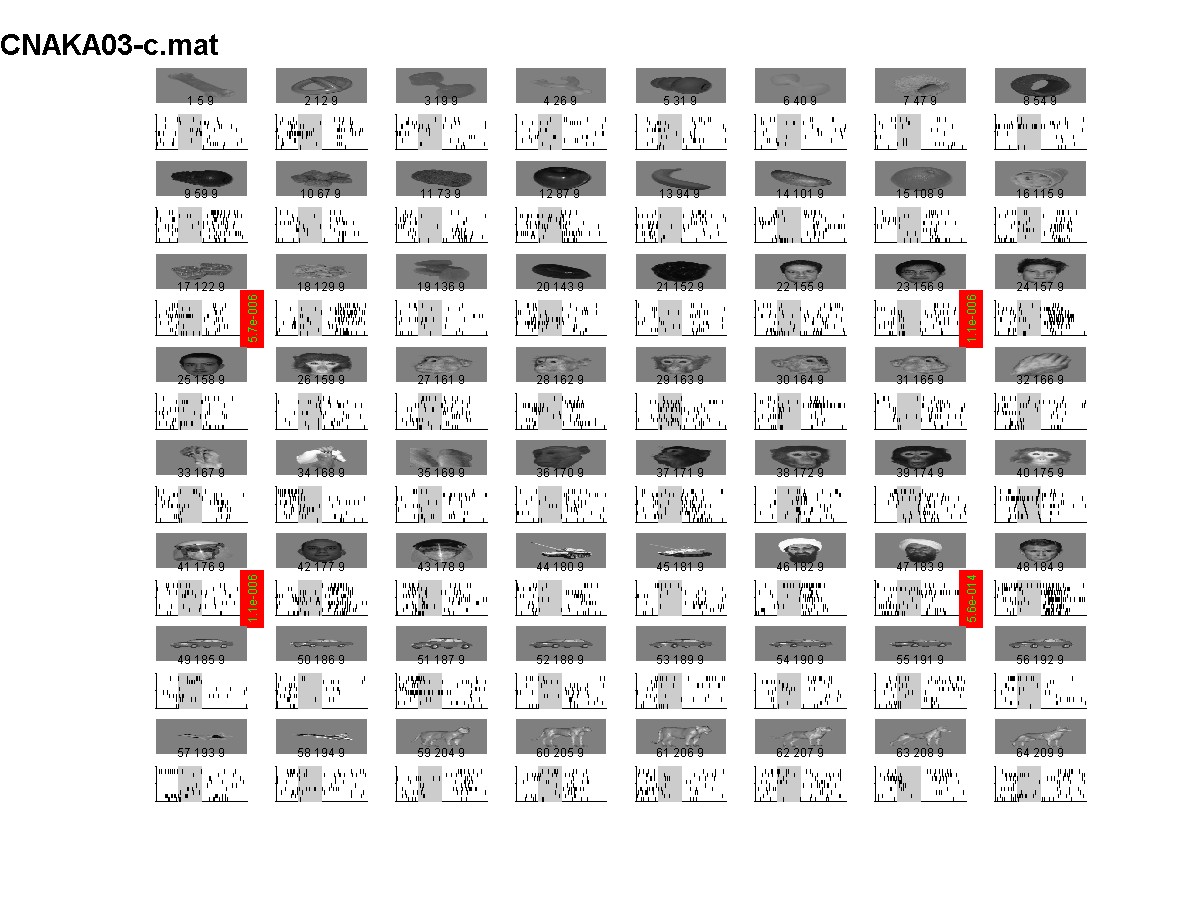
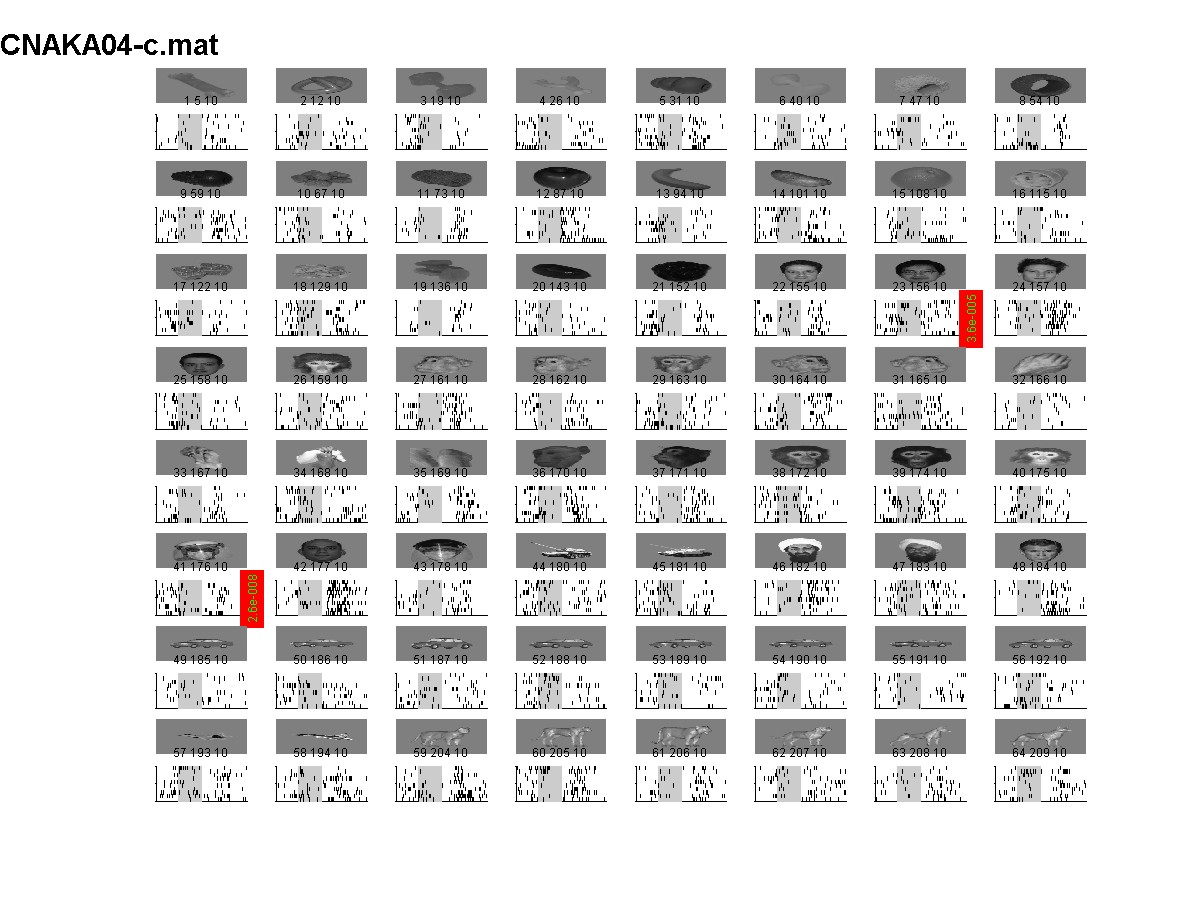
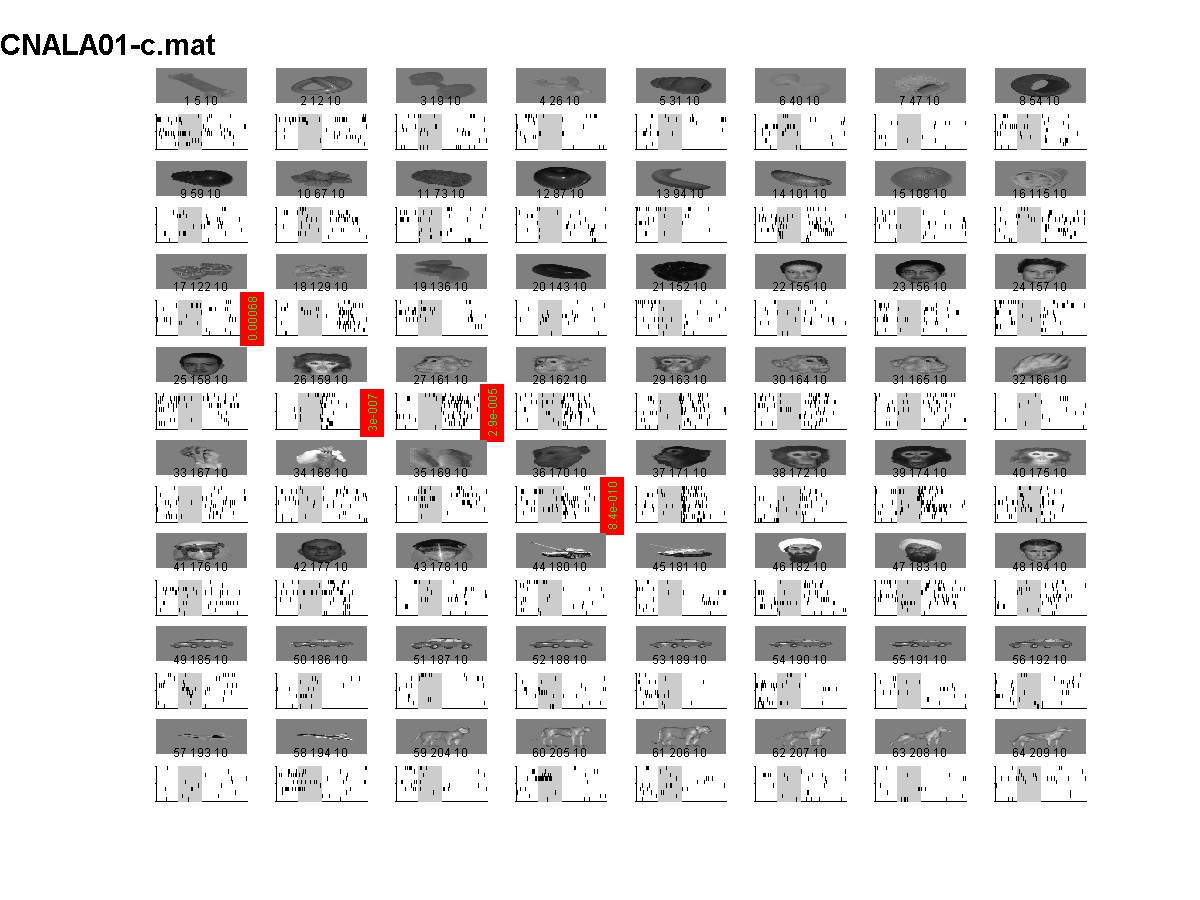
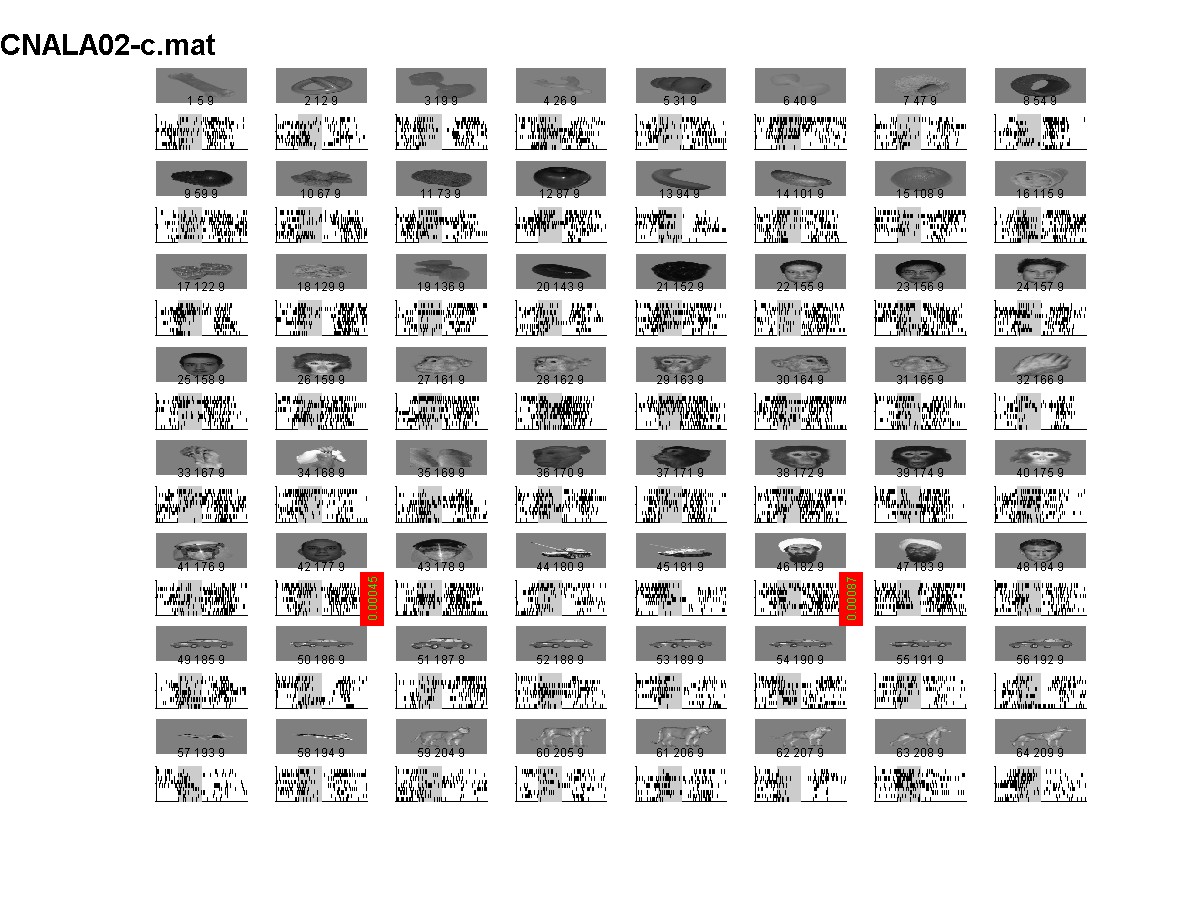
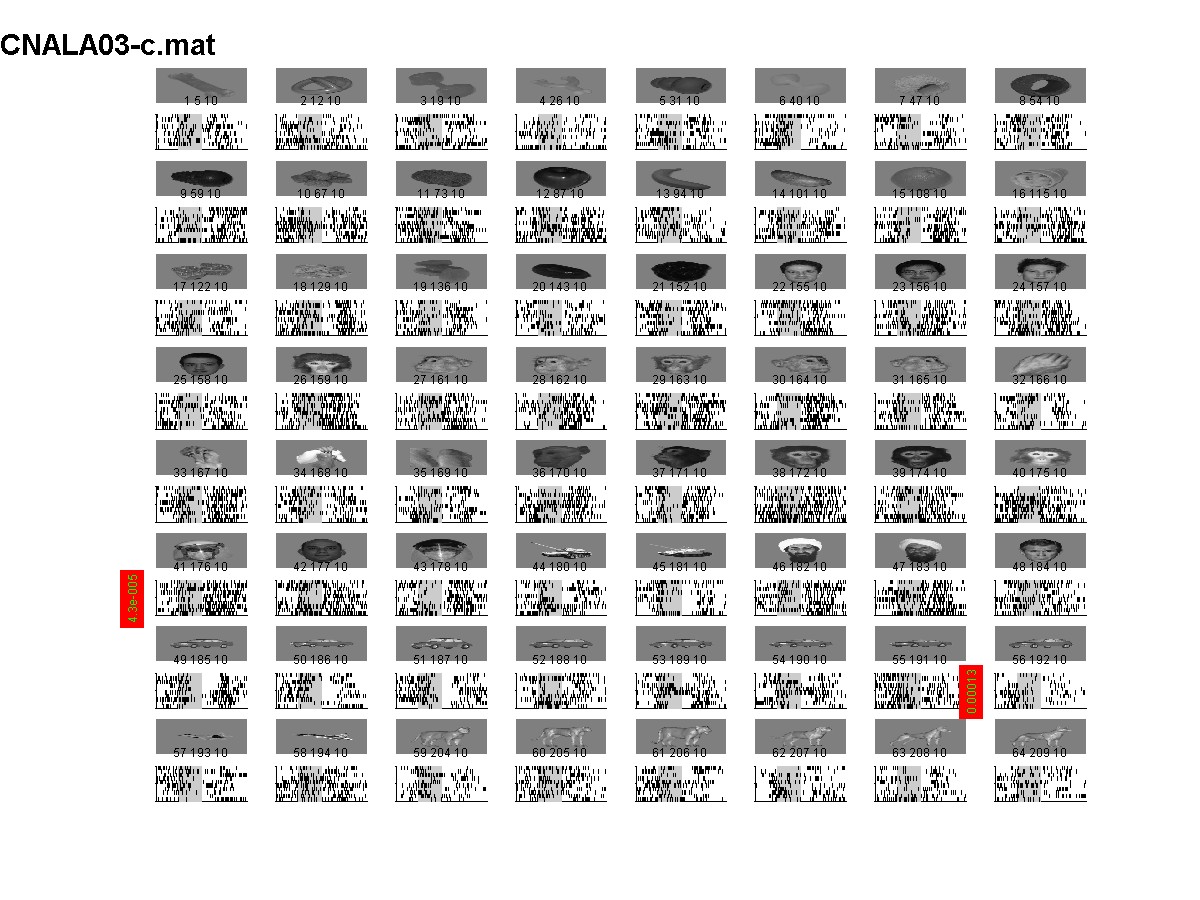
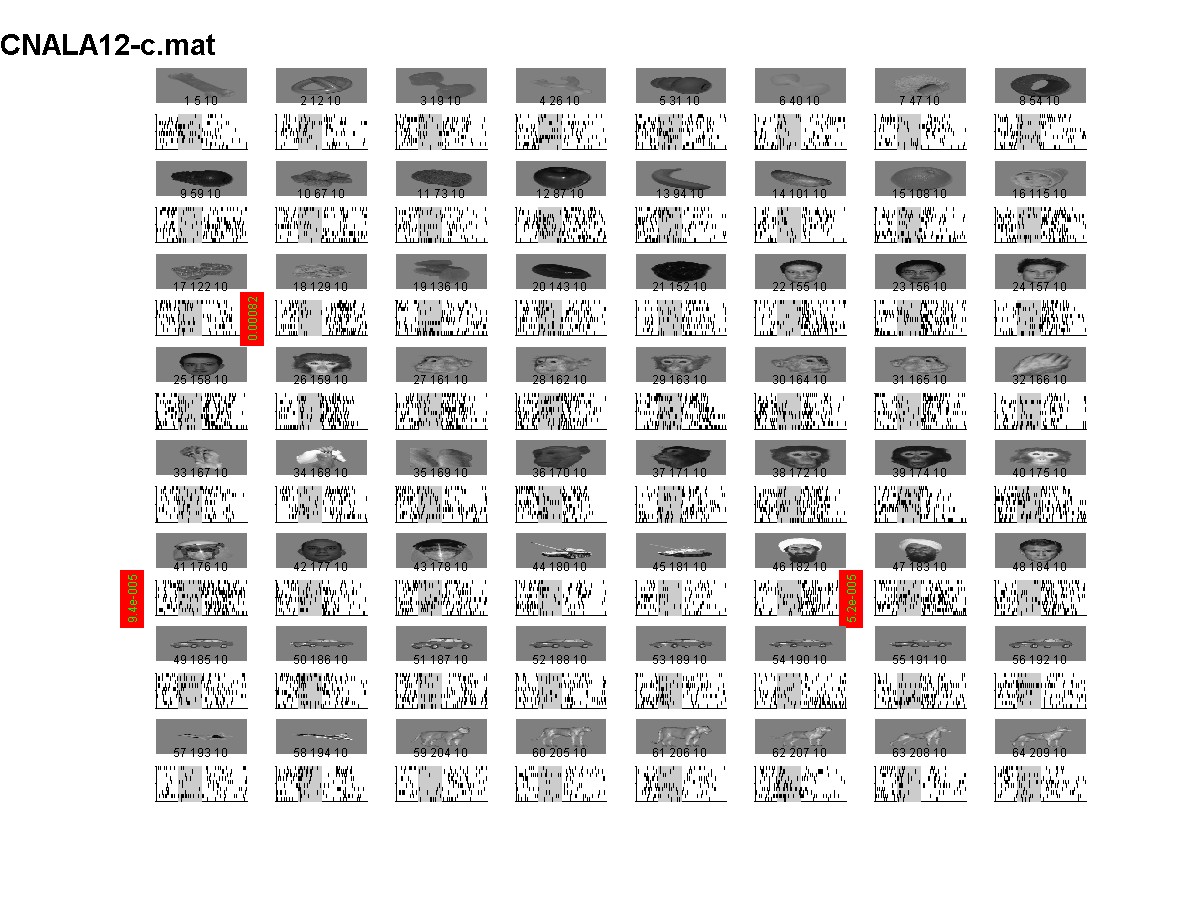
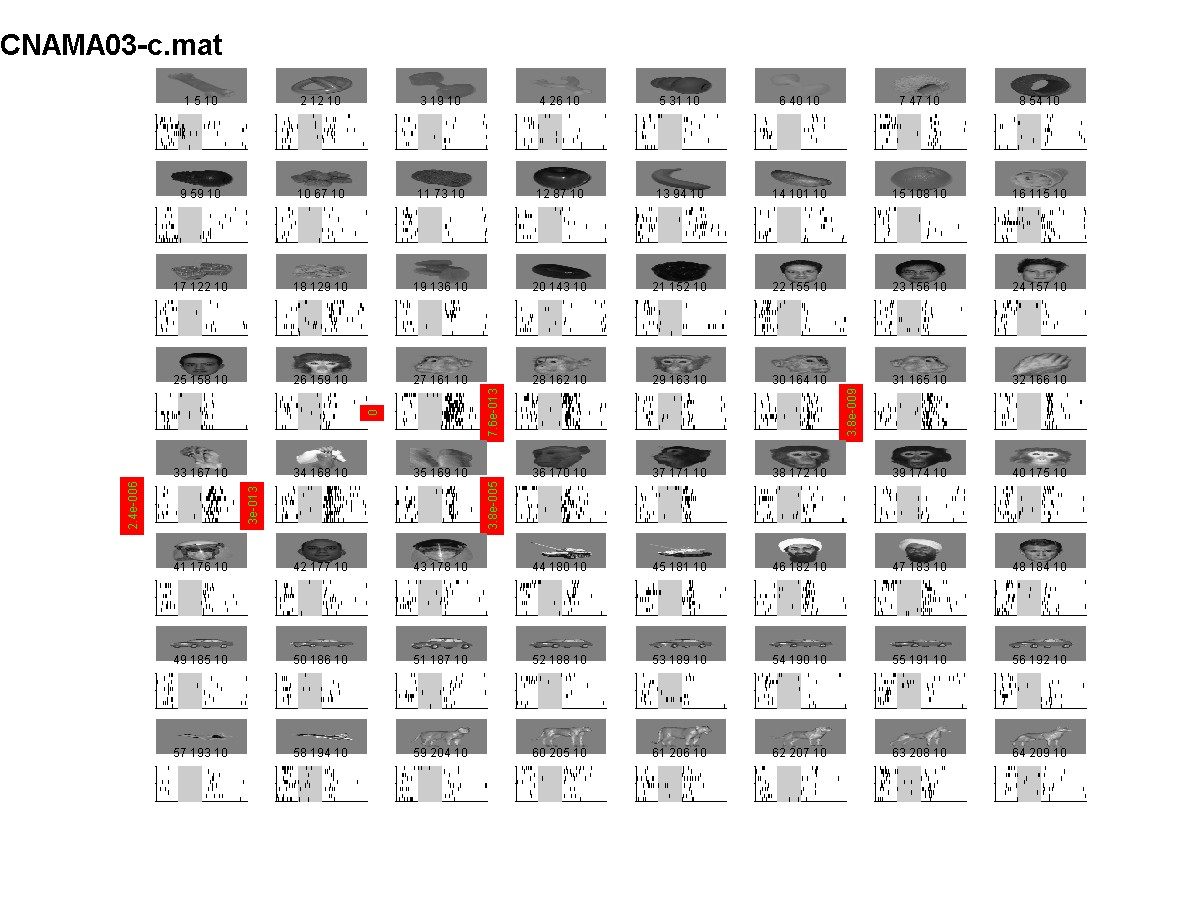
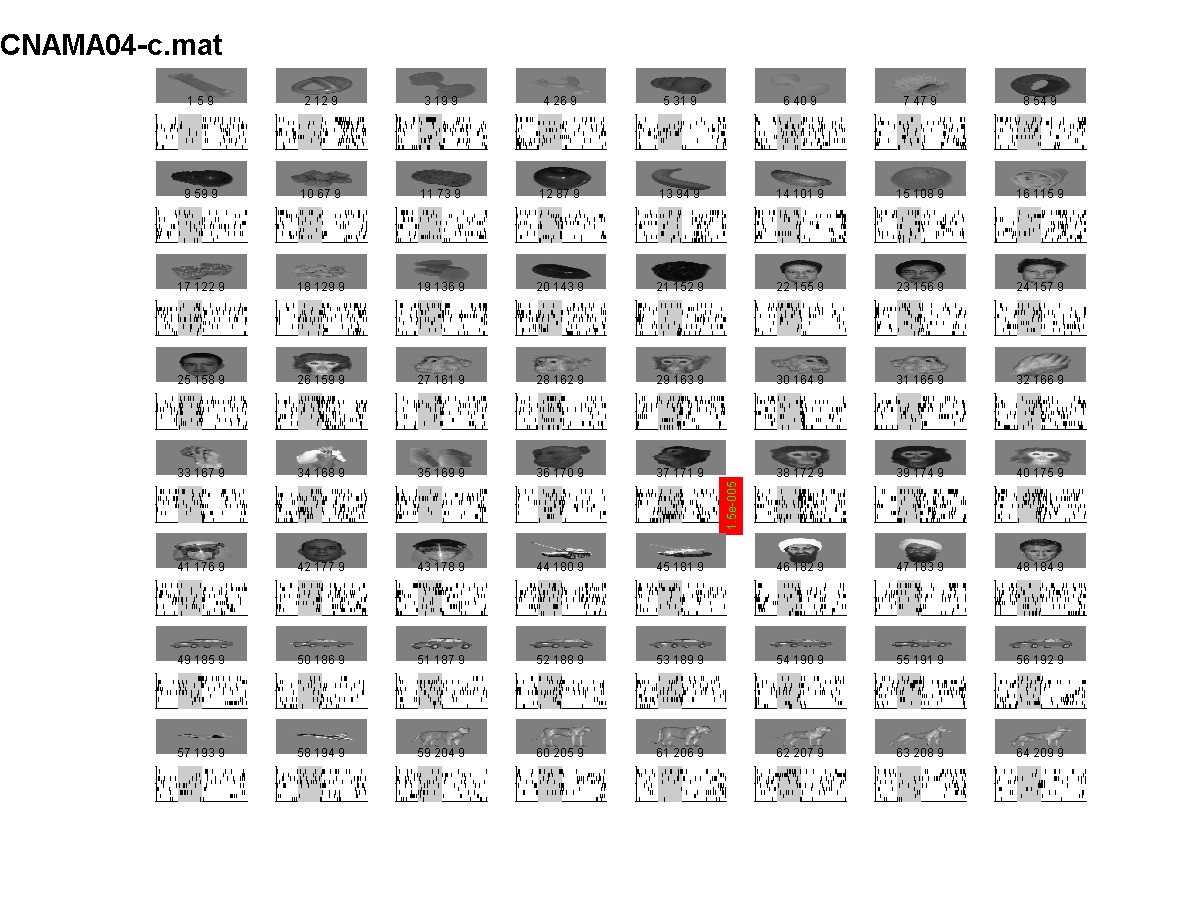
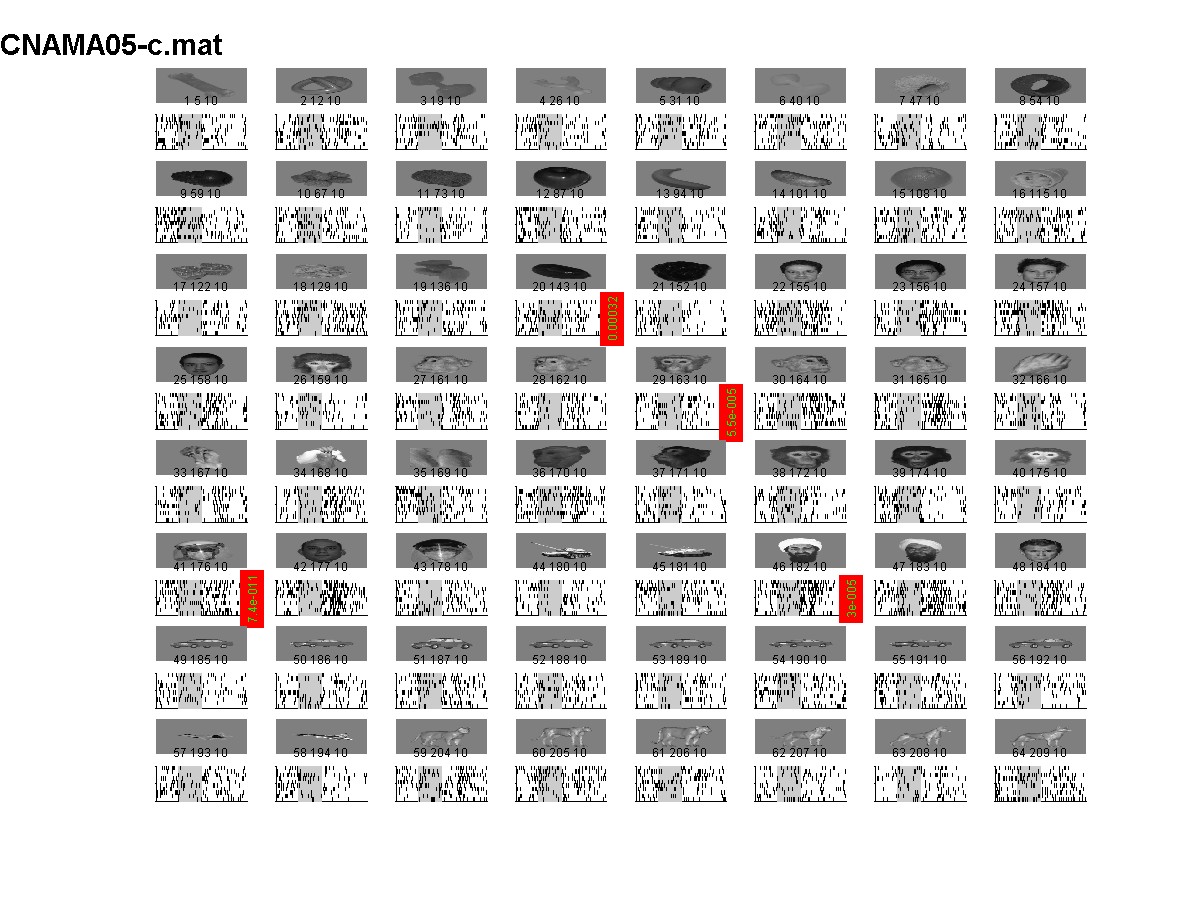
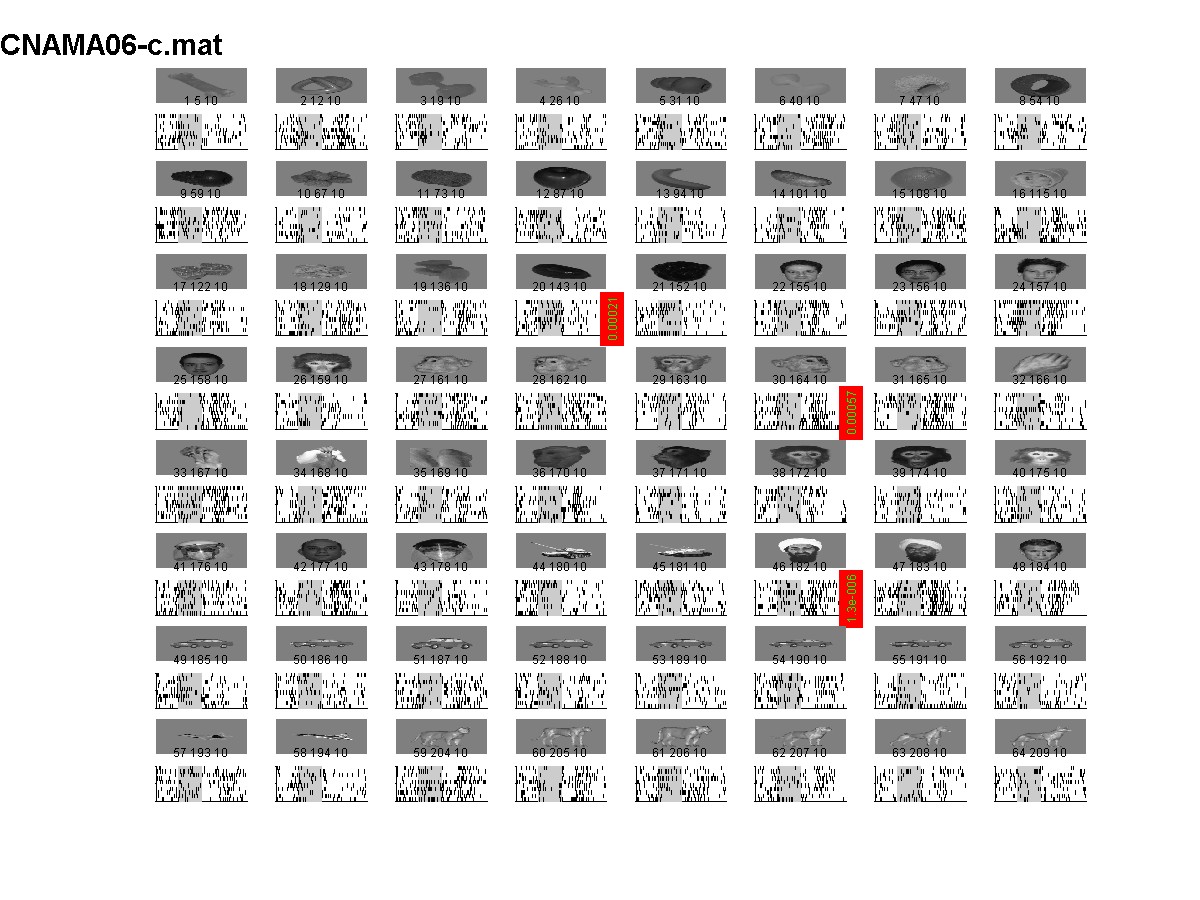
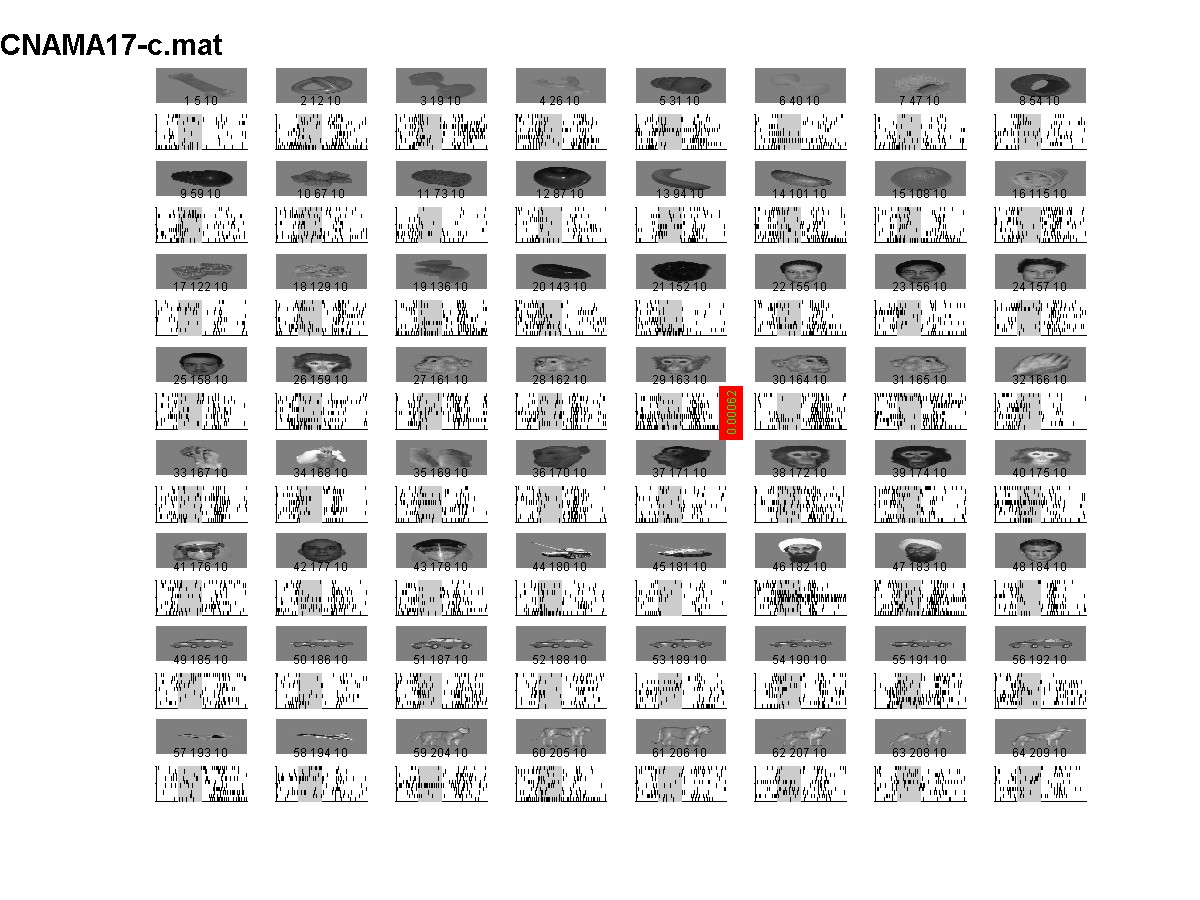
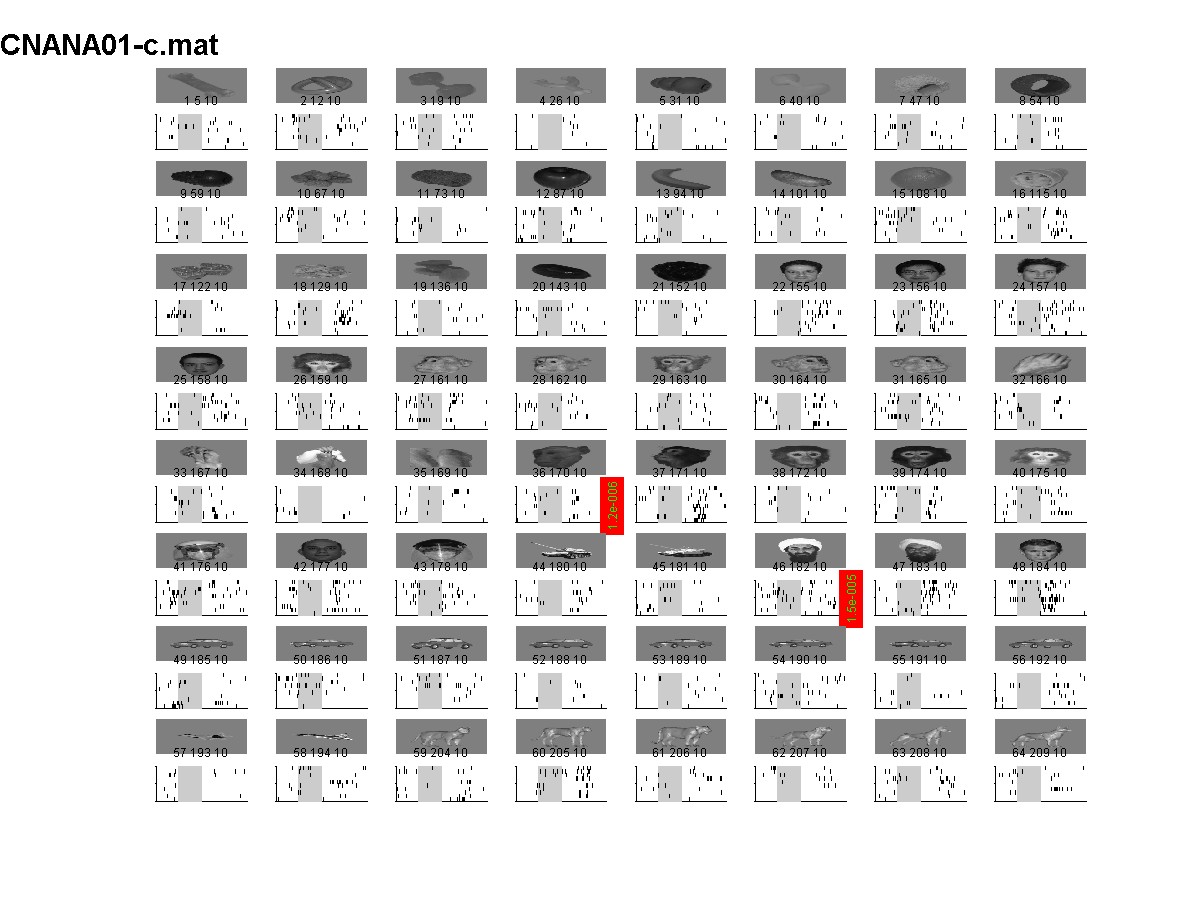
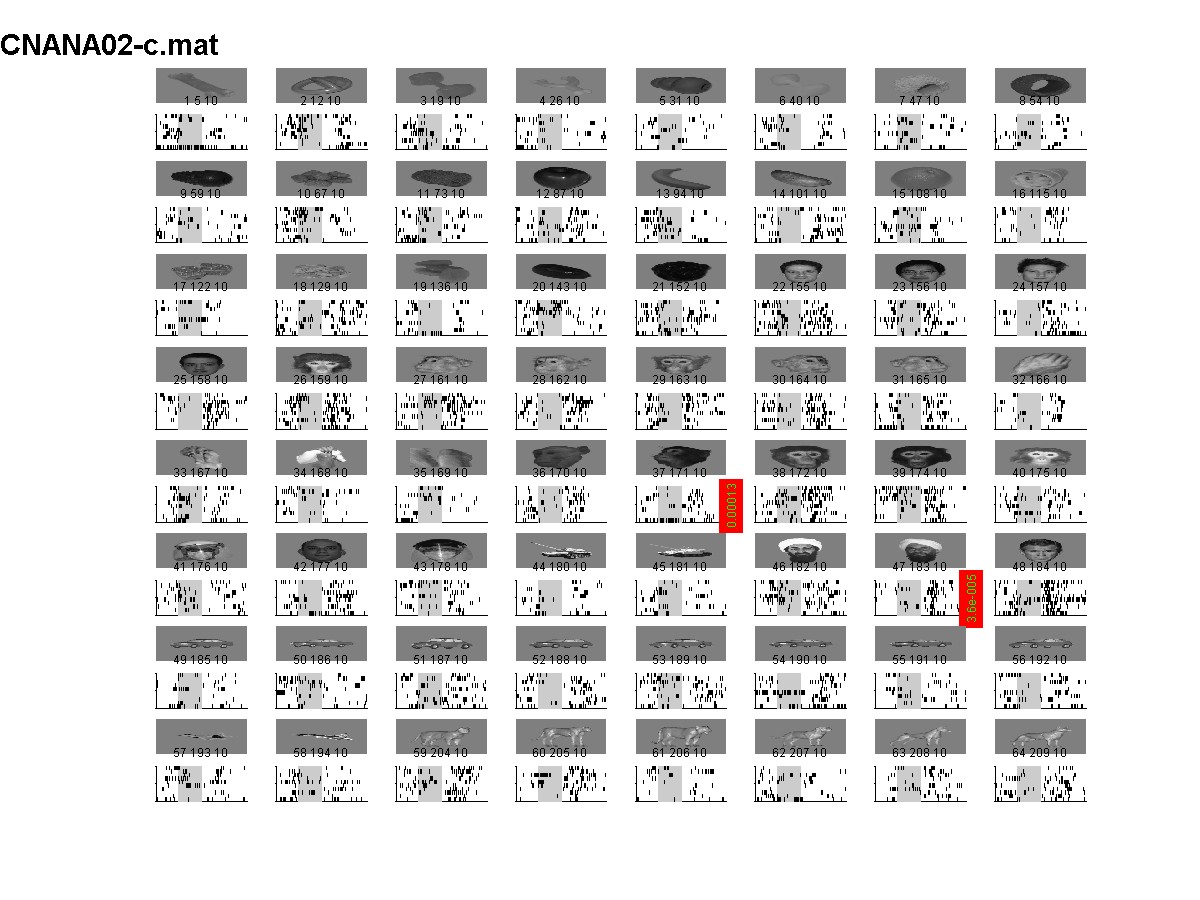
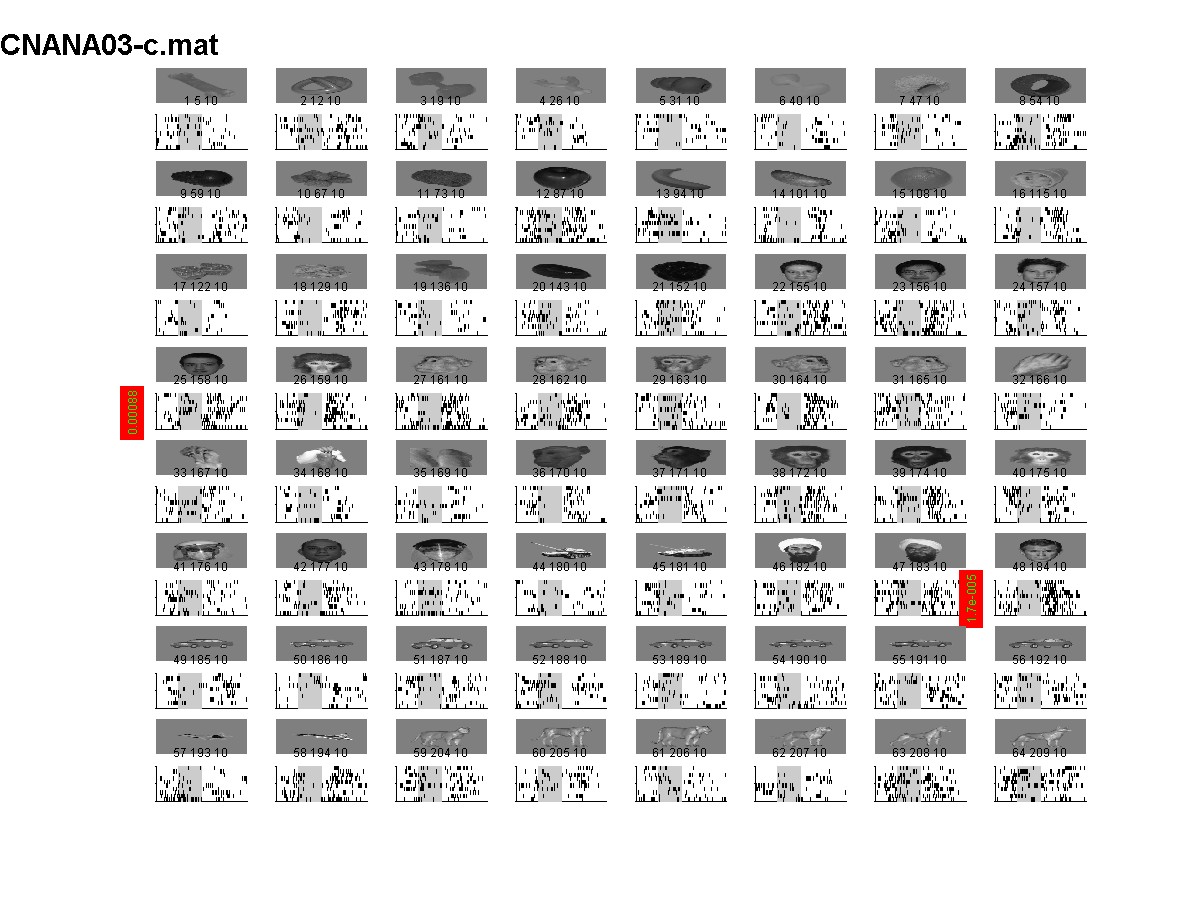
Raster plots of the MUA responses of each site. Each site is linked to an image showing the raster plot for each of the images. Each row of the raster plot corresponds to one repetition of the corresponding image and each mark denotes an action potential. The shaded area denotes the stimulus presentation interval (100 ms). Below each image, there are 3 numbers indicating two separate codes for each image and the number of repetitions. If the site was selective to one or more images according to the ANOVA and post-hoc analysis (p<0.001, see Methods for definition), the p value from the post-hoc test is shown next to the raster plot.
Number of sites selective to each of the images and groups. (A) MUA activity, selectivity to images. (B) LFP activity, selectivity to images. (C) MUA activity, selectivity to groups. (D) LFP activity, selectivity to groups. The names of the 9 different groups and the number of images in each group are shown to the right. p value threshold for selectivity = 0.001.
params.program_name='plot_mua'; params.ti_plot=-1e+002; params.tf_plot=300.000000; params.refractory_period=2.000000; params.write_html=1.000000; params.anova_p_threshold=0.001; params.ttest_p_threshold=0.001;