Dependence on thresholds and parameters
number of sites included in analysis = 356
number of sites excluded from analysis
| 60/120/hfn | non-IT | STS | unstable | no data | slope | |
|---|---|---|---|---|---|---|
| n_out_mua | 12 | 30 | 12 | 26 | 31 | 166 |
number of sites included in analysis = 309
number of sites excluded from analysis
| 60/120/hfn | non-IT | STS | unstable | no data | slope | |
|---|---|---|---|---|---|---|
| n_out_lfp | 108 | 30 | 12 | 25 | 94 | 62 |
60/120/hfn = peaks at 60 Hz or harmonics or high-frequency noise
non-IT = sites outside IT or STS
STS = sites in STS
unstable = unstable recordings
no data = sites without enough number of repetitions
slope = number of sites with change in slope larger than threshold (MUA [0.77
1.30], LFP [0.77 1.30])
| mean | s.d. | min | max | median | n | |
|---|---|---|---|---|---|---|
| pres | 10.33 | 1.92 | 7.72 | 20.03 | 10.01 | 356 |
| change stim mua | 1.04 | 0.13 | 0.78 | 1.29 | 1.04 | 356 |
| change bckg mua | 1.04 | 0.13 | 0.66 | 1.38 | 1.03 | 356 |
| cv stim | 0.89 | 0.13 | 0.46 | 1.37 | 0.89 | 356 |
| cv bckg | 0.86 | 0.14 | 0.54 | 1.31 | 0.85 | 356 |
| mean | s.d. | min | max | median | n | |
|---|---|---|---|---|---|---|
| change stim lfp 1 | 0.98 | 0.12 | 0.78 | 1.29 | 0.96 | 309 |
| change bckg lfp 1 | 1.08 | 1.29 | 0.34 | 23.30 | 0.96 | 309 |
pres = number of repetitions of each image
change stim = average response during last repetition / average response during
first repetition, stimulus interval
change bckg = average response during last repetition / average response during
first repetition, background interval
CV = coefficient of variation of the interspike interval distribution
| stimulus | background | |||
|---|---|---|---|---|
| nsites selective | percentage selective | nsites selective | percentage selective | |
| MUA | 279 | 78.37 | 0 | 0.00 |
nsites selective = number of sites with p ANOVA < threhsold=0.001000
percentage selective = percentage of total sites analyzed that were selective
stimulus = stimulus interval [100;300) ms with respect to stimulus onset
background = background interval [-200;0) ms with respect to stimulus onset
number of sites with at least 1 selective image = 248 (69.66 %)
| mean | s.d. | min | max | median | n | |
|---|---|---|---|---|---|---|
| n sel mua | 2.85 | 2.09 | 0.00 | 11.00 | 2.00 | 279 |
| r stim mua | 3.62 | 2.07 | 1.62 | 19.61 | 3.10 | 279 |
n sel MUA = number of images that had p < threshold=0.001000 in the post-hoc
t test
r stim MUA = across picture variance / within picture variance
| stimulus | background | ||||
|---|---|---|---|---|---|
| LFP variable | nsites selective | percentage selective | nsites selective | percentage selective | |
| 1 | max(LFP)-min(LFP) | 156 | 50.49 | 0 | 0.00 |
| 2 | msa power | 140 | 45.31 | 0 | 0.00 |
| 3 | [0;10) Hz | 138 | 44.66 | 0 | 0.00 |
| 4 | [10;20) Hz | 122 | 39.48 | 0 | 0.00 |
| 5 | [20;30) Hz | 21 | 6.80 | 0 | 0.00 |
| 6 | [30;40) Hz | 14 | 4.53 | 0 | 0.00 |
| 7 | [40;100) Hz | 41 | 13.27 | 0 | 0.00 |
| 8 | [100;300) Hz | 145 | 46.93 | 1 | 0.32 |
| mean | s.d. | min | max | median | n | |
|---|---|---|---|---|---|---|
| number of sites with 1 selective image max(LFP)-min(LFP) | 111 | 35.92 | ||||
| n sel lfp max(LFP)-min(LFP) | 2.05 | 2.24 | 0.00 | 17.00 | 1.00 | 156 |
| r stim lfp max(LFP)-min(LFP) | 3.34 | 1.67 | 1.62 | 10.54 | 2.81 | 156 |
| number of sites with 1 selective image msa power | 72 | 23.30 | ||||
| n sel lfp msa power | 1.16 | 1.78 | 0.00 | 14.00 | 1.00 | 140 |
| r stim lfp msa power | 3.08 | 1.39 | 1.63 | 10.26 | 2.59 | 140 |
| number of sites with 1 selective image [0;10) Hz | 109 | 35.28 | ||||
| n sel lfp [0;10) Hz | 1.86 | 1.57 | 0.00 | 8.00 | 2.00 | 138 |
| r stim lfp [0;10) Hz | 3.03 | 1.22 | 1.64 | 6.36 | 2.63 | 138 |
| number of sites with 1 selective image [10;20) Hz | 21 | 6.80 | ||||
| n sel lfp [10;20) Hz | 0.35 | 0.97 | 0.00 | 5.00 | 0.00 | 122 |
| r stim lfp [10;20) Hz | 2.84 | 0.99 | 1.63 | 5.80 | 2.66 | 122 |
| number of sites with 1 selective image [20;30) Hz | 0 | 0.00 | ||||
| n sel lfp [20;30) Hz | 0.00 | 0.00 | 0.00 | 0.00 | 0.00 | 21 |
| r stim lfp [20;30) Hz | 1.84 | 0.16 | 1.64 | 2.25 | 1.79 | 21 |
| number of sites with 1 selective image [30;40) Hz | 2 | 0.65 | ||||
| n sel lfp [30;40) Hz | 0.21 | 0.58 | 0.00 | 2.00 | 0.00 | 14 |
| r stim lfp [30;40) Hz | 1.94 | 0.31 | 1.61 | 2.61 | 1.90 | 14 |
| number of sites with 1 selective image [40;100) Hz | 18 | 5.83 | ||||
| n sel lfp [40;100) Hz | 0.68 | 0.99 | 0.00 | 4.00 | 0.00 | 41 |
| r stim lfp [40;100) Hz | 2.06 | 0.60 | 1.63 | 5.24 | 1.95 | 41 |
| number of sites with 1 selective image [100;300) Hz | 103 | 33.33 | ||||
| n sel lfp [100;300) Hz | 1.61 | 1.48 | 0.00 | 7.00 | 2.00 | 145 |
| r stim lfp [100;300) Hz | 2.83 | 1.75 | 1.63 | 16.64 | 2.32 | 145 |
| r bckg lfp [100;300) Hz | 1.66 | 0.00 | 1.66 | 1.66 | 1.66 | 1 |
| 60/120/hfn | non-IT | STS | unstable | no data | slope | |
|---|---|---|---|---|---|---|
| n_out_mua | 12 | 30 | 12 | 26 | 31 | 166 |
| nsites_sel_stim_mua2 | 3 | 0 | 8 | 8 | 2 | 117 |
| psites_sel_stim_mua2 | 25 | 0 | 67 | 31 | 6 | 70 |
| nsites_sel_bckg_mua2 | 0 | 0 | 0 | 0 | 0 | 0 |
| psites_sel_bckg_mua2 | 0 | 0 | 0 | 0 | 0 | 0 |
| 60/120/hfn | non-IT | STS | unstable | no data | slope | ||
|---|---|---|---|---|---|---|---|
| n_out_lfp | 108 | 30 | 12 | 25 | 94 | 62 | |
| nsites_sel_stim_lfp2 | max(LFP)-min(LFP) | 21 | 0 | 2 | 2 | 3 | 10 |
| psites_sel_stim_lfp2 | max(LFP)-min(LFP) | 19 | 0 | 17 | 8 | 3 | 16 |
| nsites_sel_bckg_lfp2 | max(LFP)-min(LFP) | 1 | 0 | 0 | 0 | 0 | 0 |
| psites_sel_bckg_lfp2 | max(LFP)-min(LFP) | 1 | 0 | 0 | 0 | 0 | 0 |
| nsites_sel_stim_lfp2 | msa power | 24 | 0 | 1 | 0 | 1 | 5 |
| psites_sel_stim_lfp2 | msa power | 22 | 0 | 8 | 0 | 1 | 8 |
| nsites_sel_bckg_lfp2 | msa power | 0 | 0 | 0 | 0 | 0 | 0 |
| psites_sel_bckg_lfp2 | msa power | 0 | 0 | 0 | 0 | 0 | 0 |
| nsites_sel_stim_lfp2 | [0;10) Hz | 3 | 0 | 2 | 1 | 2 | 8 |
| psites_sel_stim_lfp2 | [0;10) Hz | 3 | 0 | 17 | 4 | 2 | 13 |
| nsites_sel_bckg_lfp2 | [0;10) Hz | 0 | 0 | 0 | 0 | 0 | 0 |
| psites_sel_bckg_lfp2 | [0;10) Hz | 0 | 0 | 0 | 0 | 0 | 0 |
| nsites_sel_stim_lfp2 | [10;20) Hz | 3 | 0 | 0 | 0 | 1 | 5 |
| psites_sel_stim_lfp2 | [10;20) Hz | 3 | 0 | 0 | 0 | 1 | 8 |
| nsites_sel_bckg_lfp2 | [10;20) Hz | 0 | 0 | 0 | 0 | 0 | 0 |
| psites_sel_bckg_lfp2 | [10;20) Hz | 0 | 0 | 0 | 0 | 0 | 0 |
| nsites_sel_stim_lfp2 | [20;30) Hz | 2 | 0 | 0 | 0 | 0 | 1 |
| psites_sel_stim_lfp2 | [20;30) Hz | 2 | 0 | 0 | 0 | 0 | 2 |
| nsites_sel_bckg_lfp2 | [20;30) Hz | 0 | 0 | 0 | 0 | 0 | 0 |
| psites_sel_bckg_lfp2 | [20;30) Hz | 0 | 0 | 0 | 0 | 0 | 0 |
| nsites_sel_stim_lfp2 | [30;40) Hz | 0 | 0 | 0 | 0 | 0 | 2 |
| psites_sel_stim_lfp2 | [30;40) Hz | 0 | 0 | 0 | 0 | 0 | 3 |
| nsites_sel_bckg_lfp2 | [30;40) Hz | 1 | 0 | 0 | 0 | 0 | 0 |
| psites_sel_bckg_lfp2 | [30;40) Hz | 1 | 0 | 0 | 0 | 0 | 0 |
| nsites_sel_stim_lfp2 | [40;100) Hz | 4 | 0 | 0 | 0 | 0 | 3 |
| psites_sel_stim_lfp2 | [40;100) Hz | 4 | 0 | 0 | 0 | 0 | 5 |
| nsites_sel_bckg_lfp2 | [40;100) Hz | 1 | 0 | 0 | 0 | 0 | 0 |
| psites_sel_bckg_lfp2 | [40;100) Hz | 1 | 0 | 0 | 0 | 0 | 0 |
| nsites_sel_stim_lfp2 | [100;300) Hz | 29 | 0 | 6 | 5 | 2 | 24 |
| psites_sel_stim_lfp2 | [100;300) Hz | 27 | 0 | 50 | 20 | 2 | 39 |
| nsites_sel_bckg_lfp2 | [100;300) Hz | 0 | 0 | 0 | 0 | 0 | 1 |
| psites_sel_bckg_lfp2 | [100;300) Hz | 0 | 0 | 0 | 0 | 0 | 2 |
|
|
statistical threshold | |||
| 0.01 | 0.001 | 0.0001 | ||
| slope interval | [0.77;1.3] | stats | stats | stats |
| [0.5;2.0] | stats | stats | stats | |
| [0.25,4.0] | stats | stats | stats | |
For each value of the statistical threshold (for the ANOVA analysis and post-hoc comparisons) and for each possible interval for the signal slope, the table provides a link to several table summarizing the total number of sites, the number of selective sites, and the distribution of selective units. The colored entry corresponds to the default parameters used in the summary of results above.
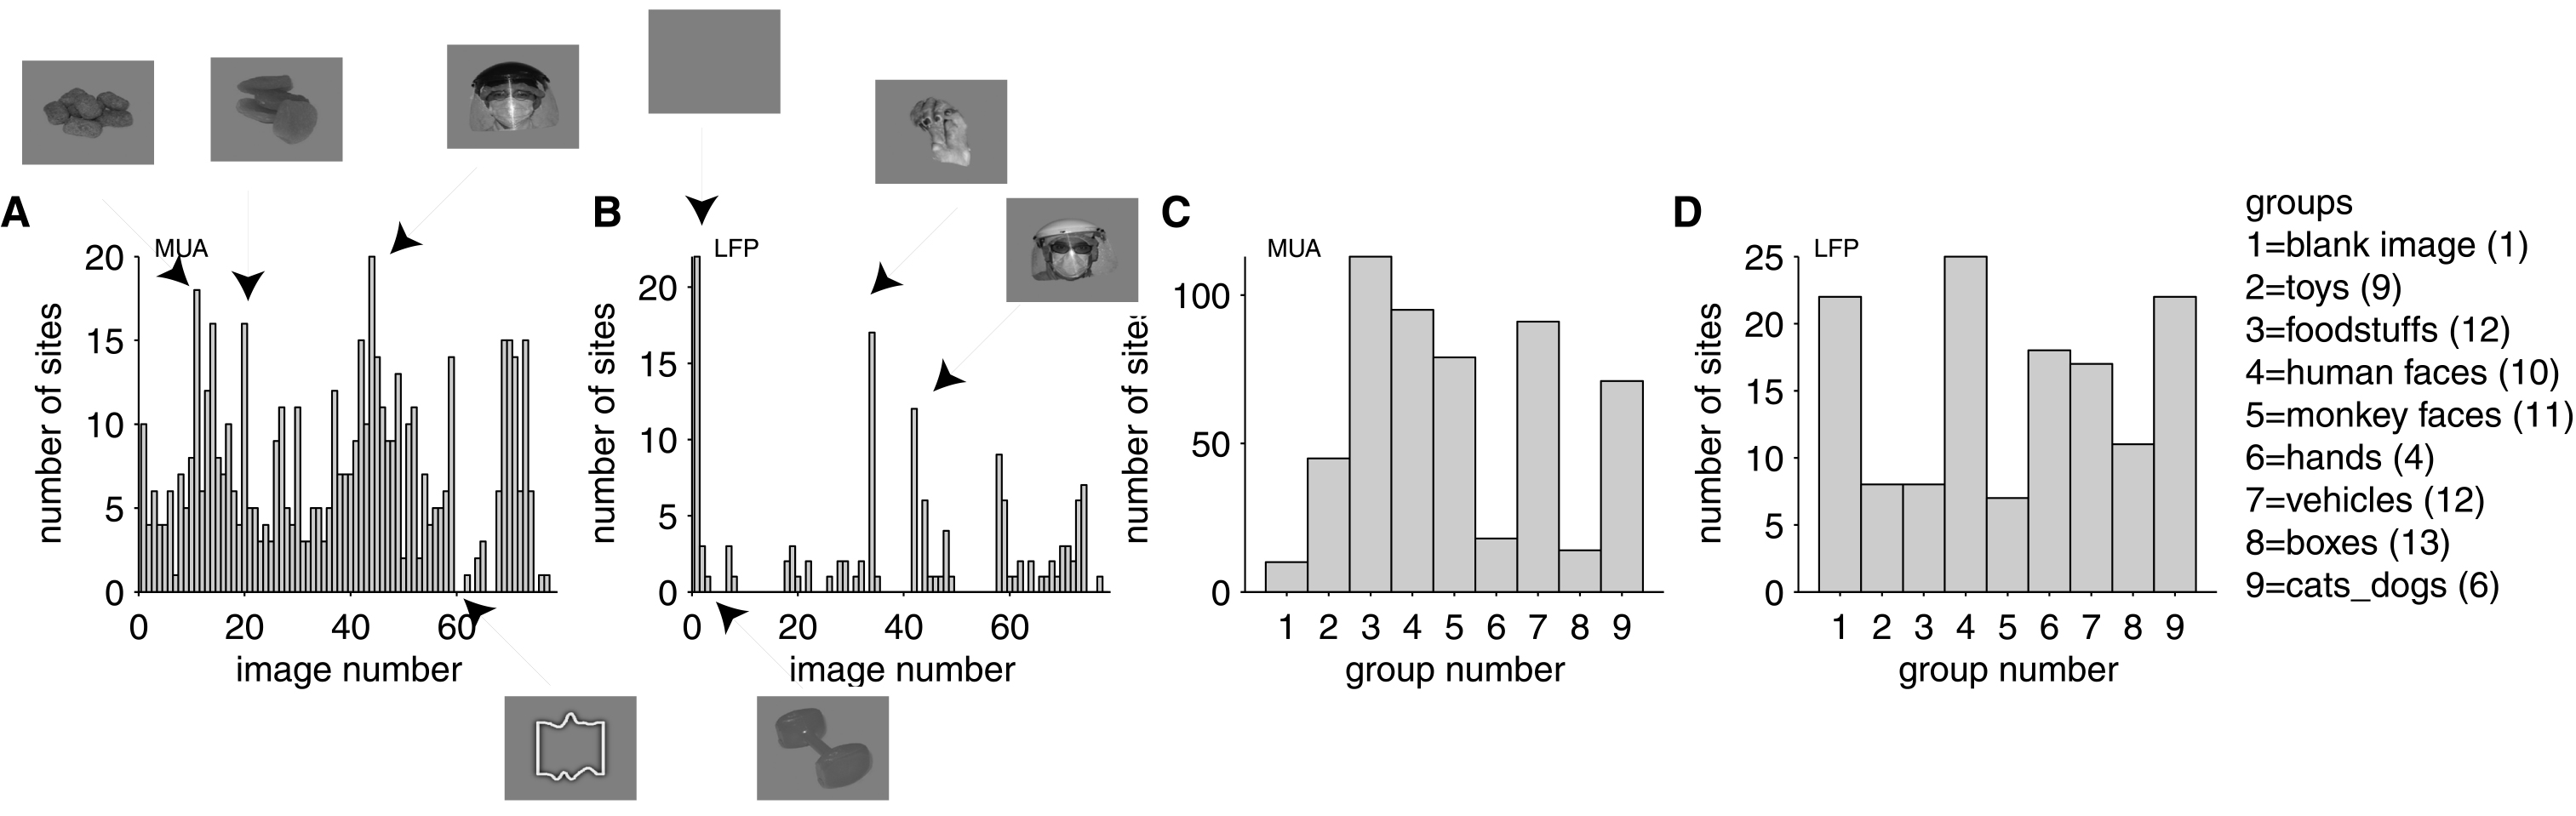
Number of sites selective to each of the images and groups. (A) MUA activity, selectivity to images. (B) LFP activity, selectivity to images. (C) MUA activity, selectivity to groups. (D) LFP activity, selectivity to groups. The names of the 9 different groups and the number of images in each group are shown to the right. p value threshold for selectivity = 0.001.