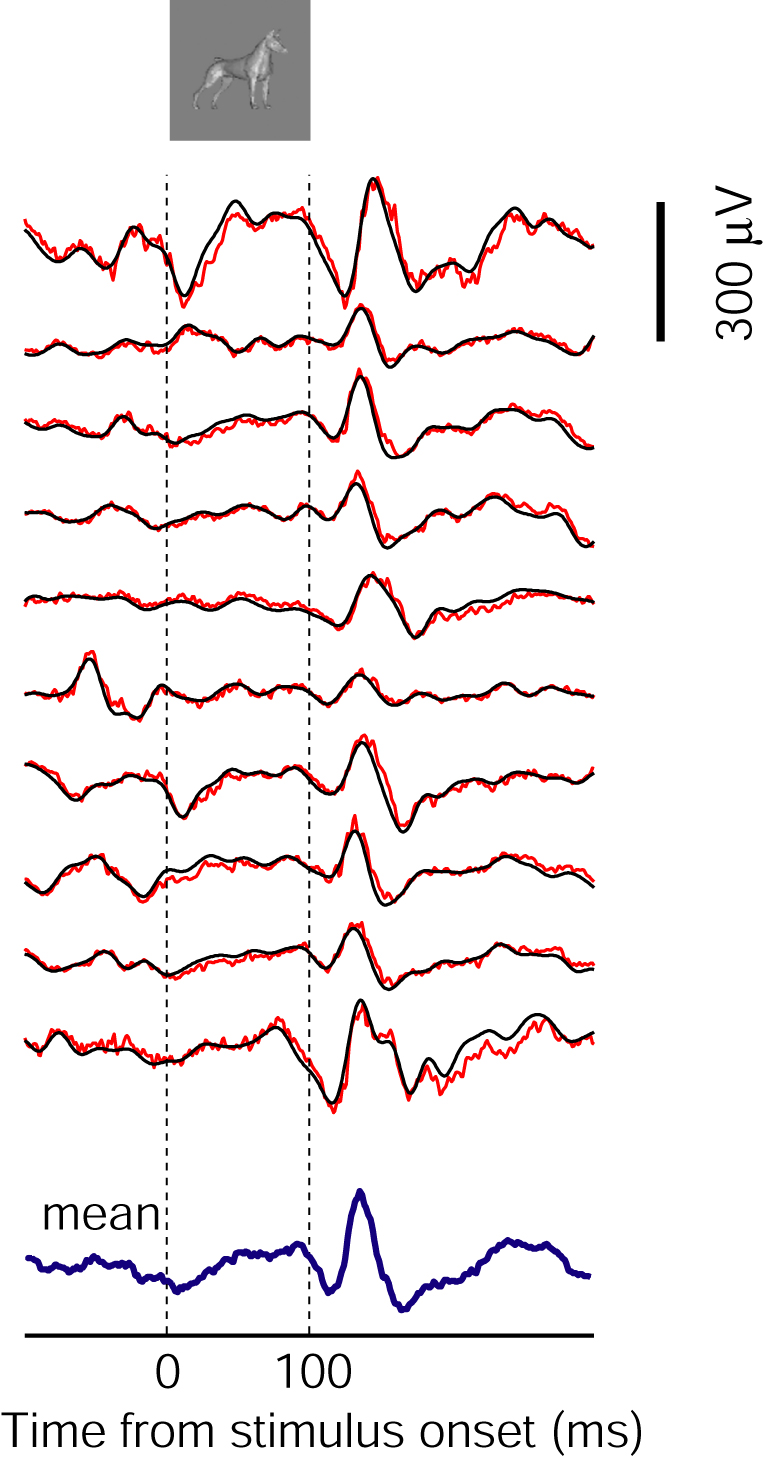
This example zooms in to show the reliability of the LFP responses below 40 Hz for the stimulus eliciting the strongest response in Figure 1. We show the 10 individual repetitions in black. The red traces show the same data after low-pass filtering at 40 Hz and are hardly distinguishable from the black traces. The bottom blue trace shows the average of the 10 repetitions. The dashed lines denote the stimulus presentation interval.