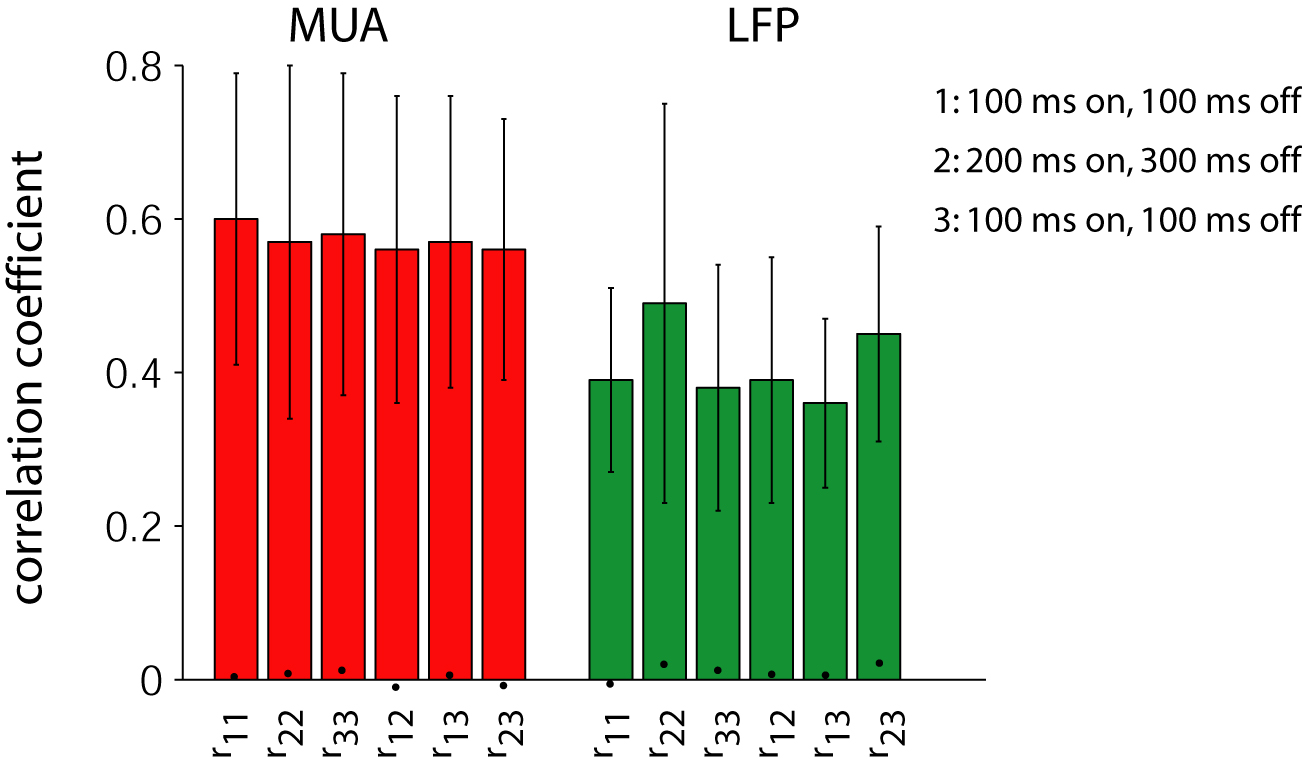
For each site, three experiments were conducted: (1) 100 ms presentation time, 100 ms blank; (2) 200 ms presentation time, 300 ms blank; (3) 100 ms presentation time, 100 ms blank. Here we show the correlation coefficient for between the average responses to each of the 77 objects for all possible pair comparisons among these 3 experiments. Error bars show 1 SD. Responses were defined in the [100;200) ms interval in all cases. The circles show the corresponding correlation coefficients using the responses in the 100 ms preceding stimulus onset.