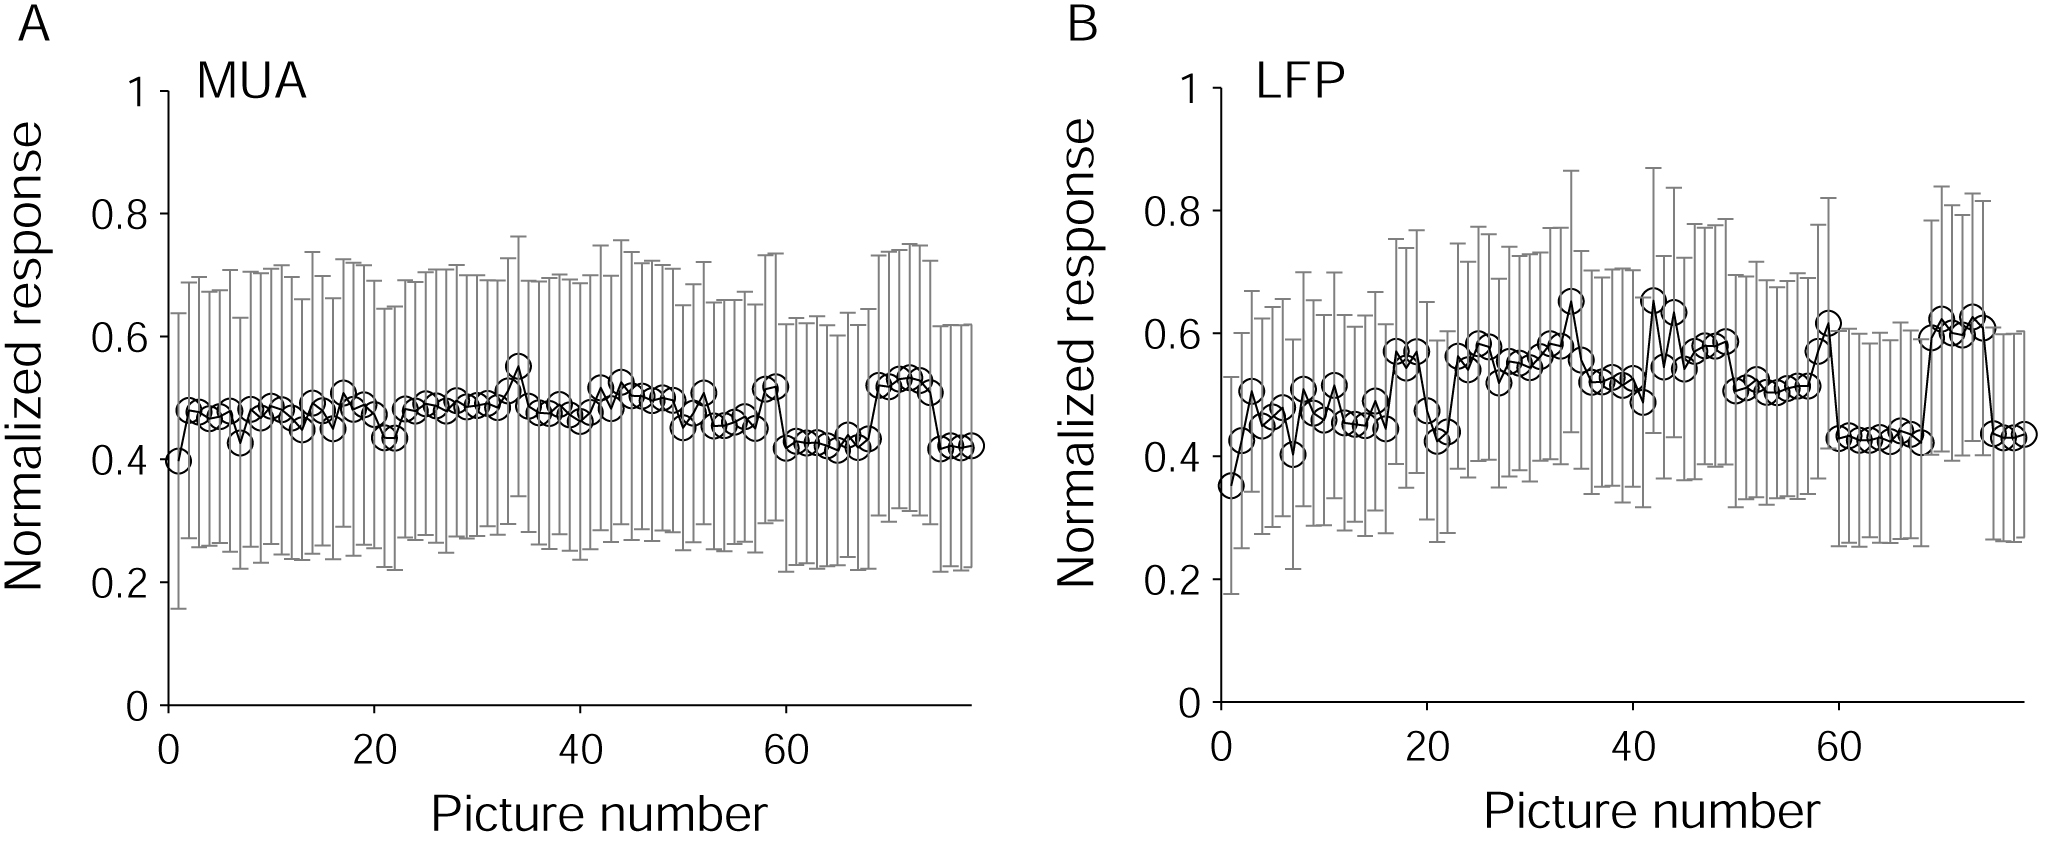

Average normalized response across all sites for each of the 77 objects for (A) MUA and (B) LFP. For each site, the responses were normalized by the maximum response and then the repsonse vector was averaged across all sites. Error bars show 1 SD (across sites).

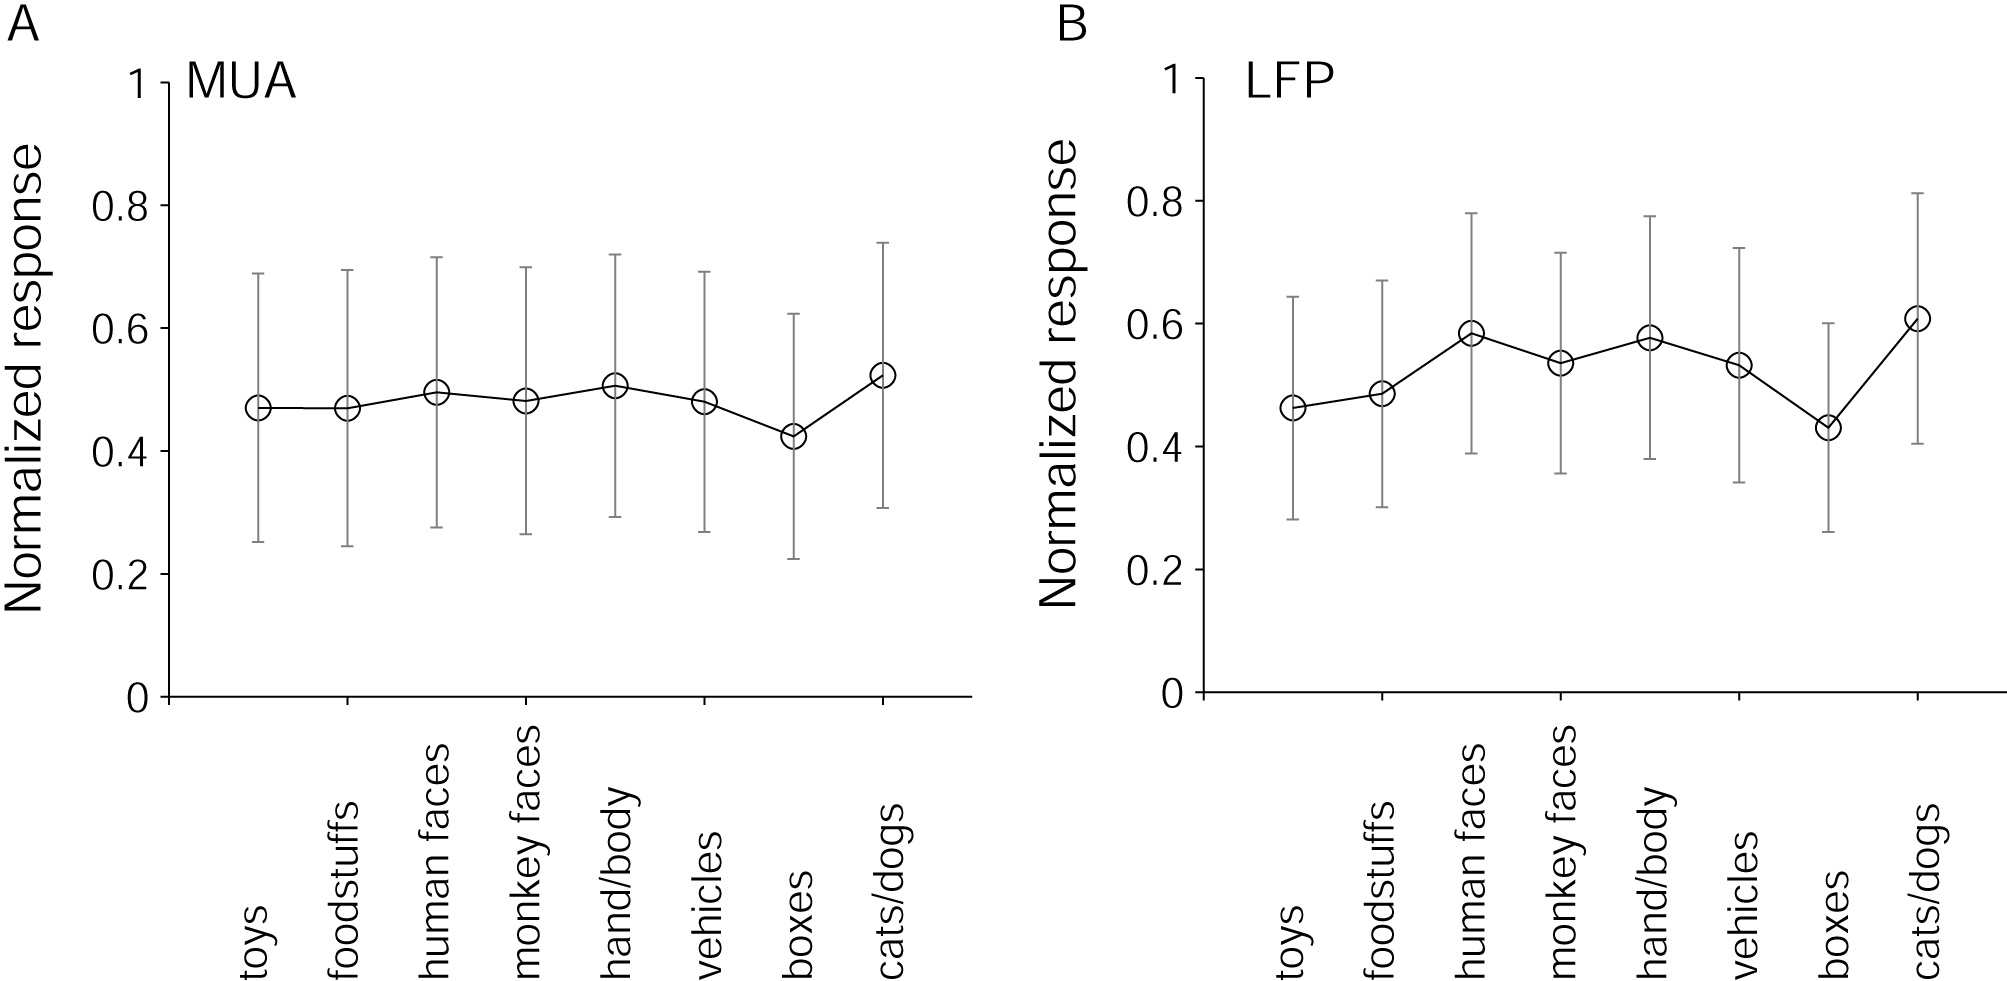
Average normalized response across all sites for each of the 8 groups of objects for (A) MUA and (B) LFP. Here the responses were averaged across all the objects wtihin each group. For each site, the responses were normalized by the maximum response and then the repsonse vector was averaged across all sites. Error bars show 1 SD (across sites).