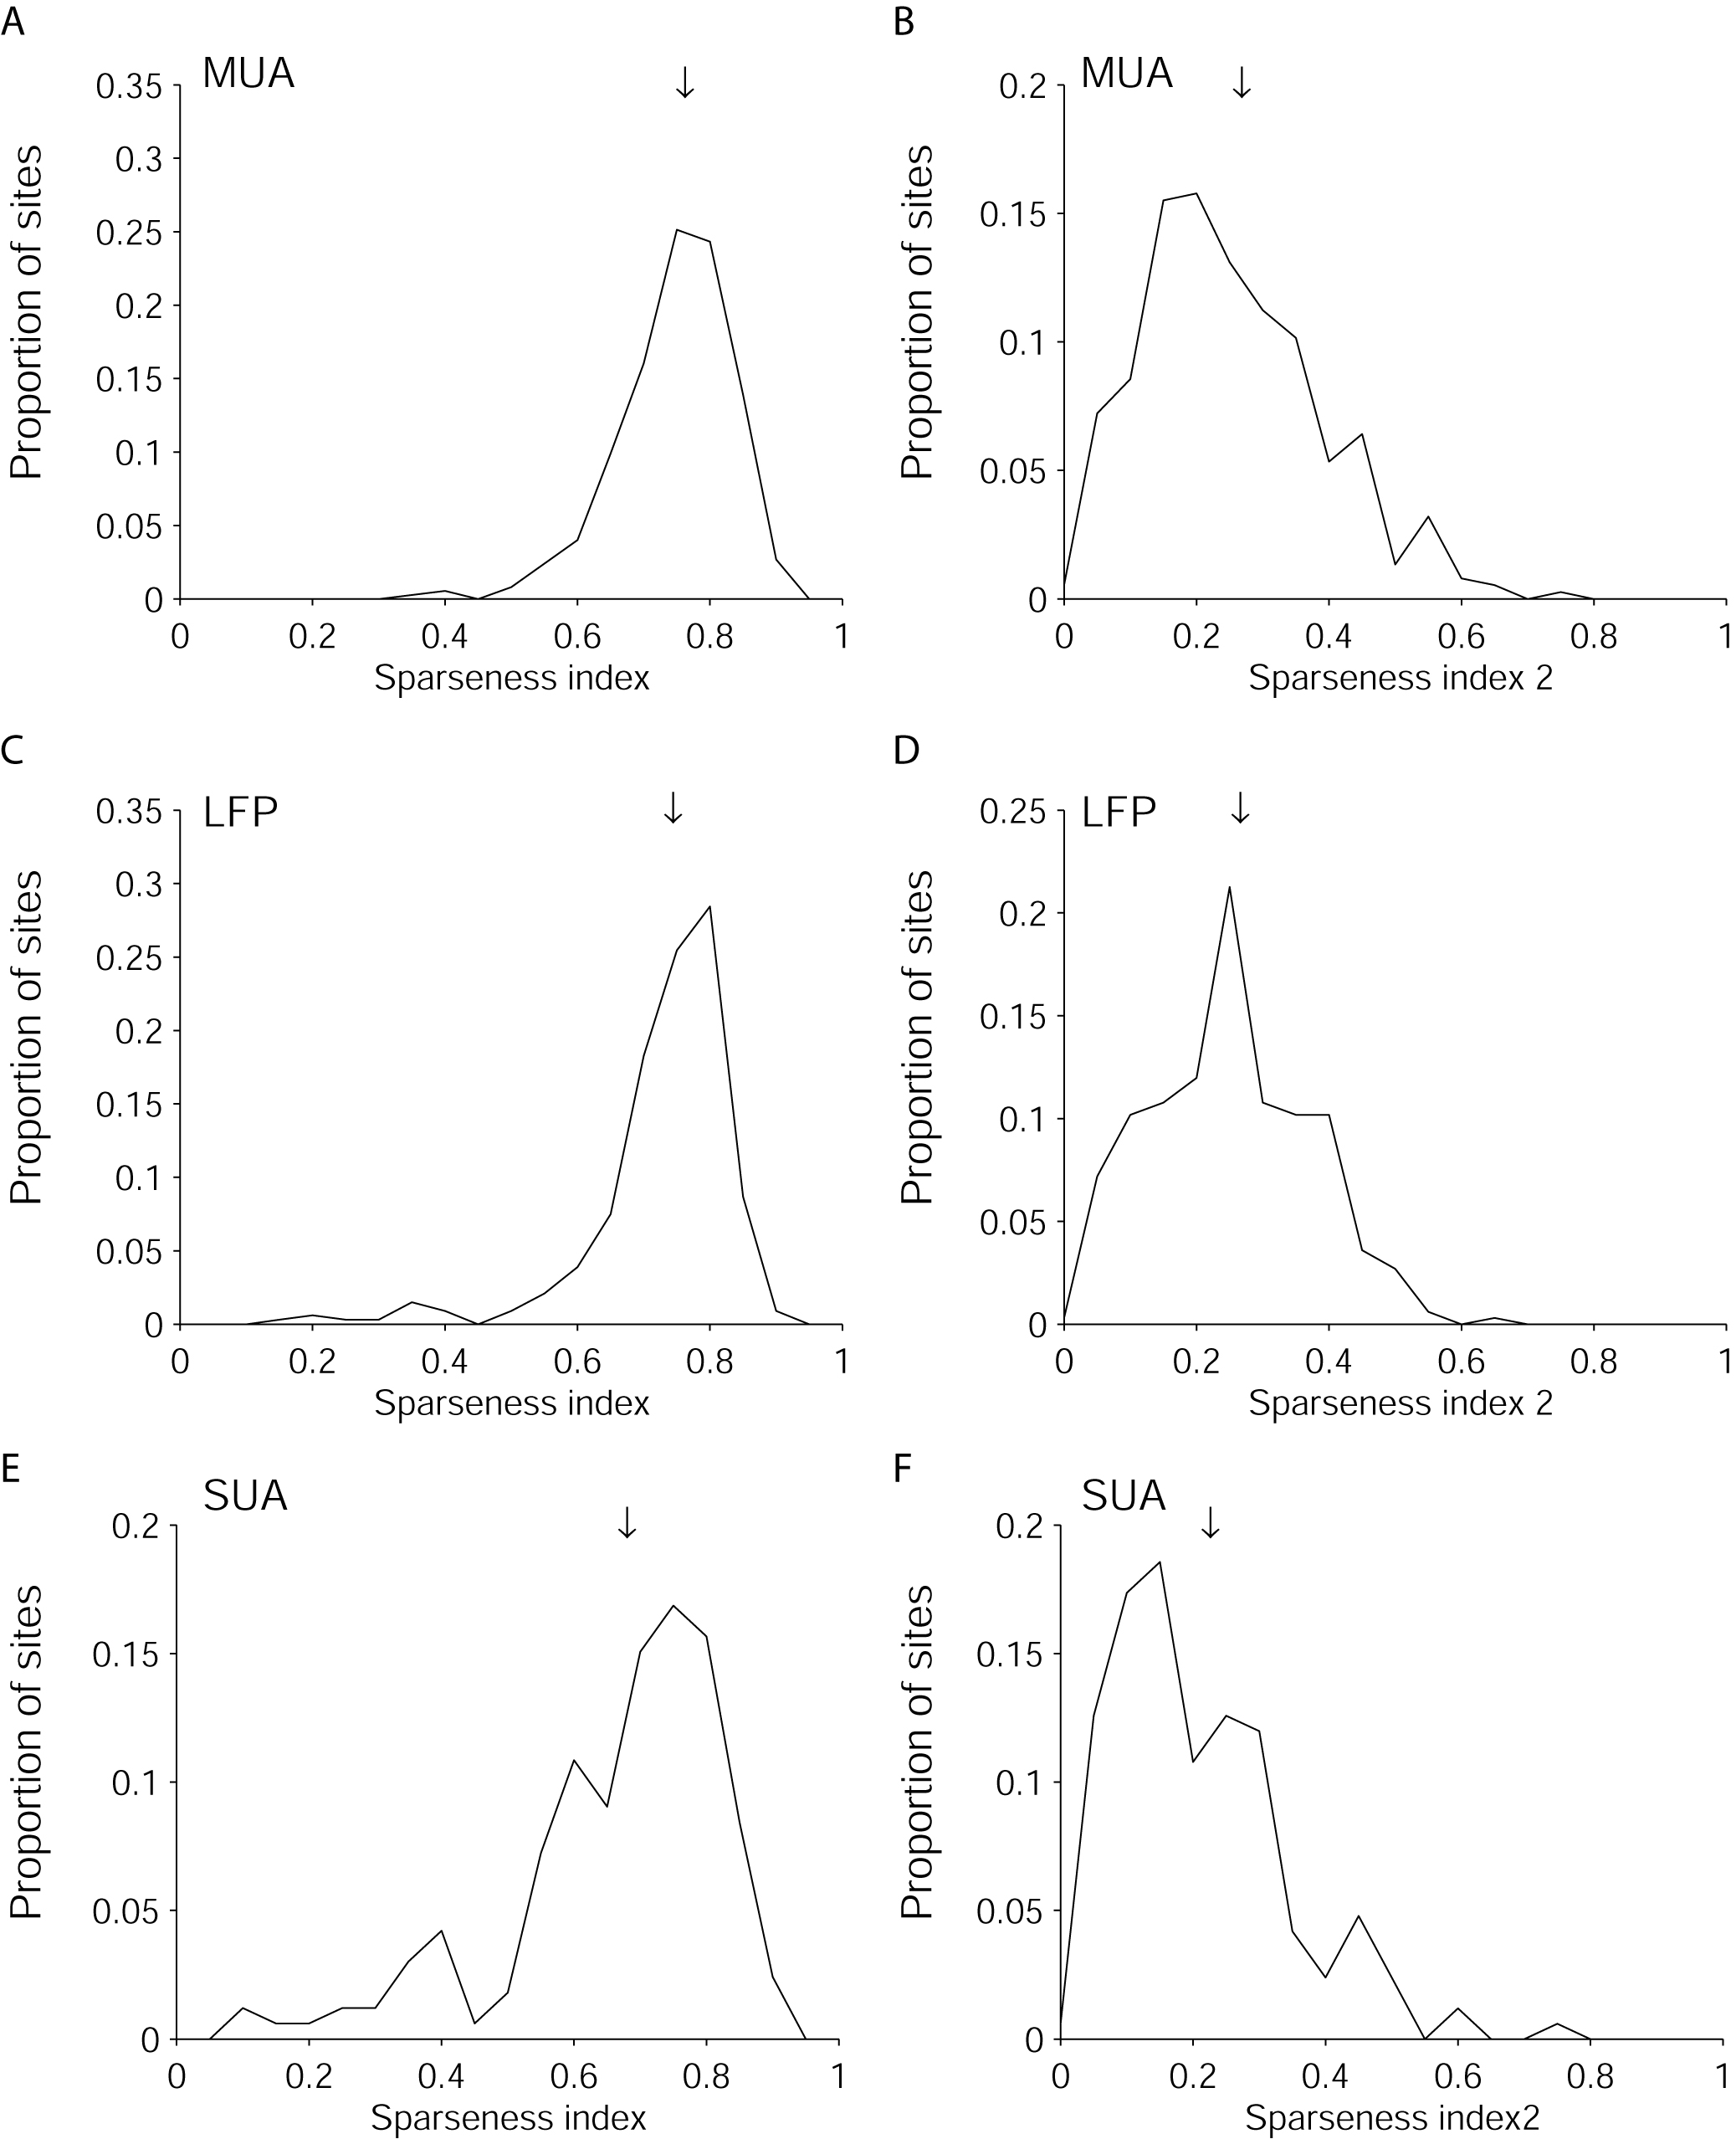
Distribution of sparseness indicies for the MUA (A, B), LFP
(C, D) and SUA (E, F) responses. Two definitions
of sparseness indices are shown here. In (A, C, E) the sparseness
index was defined as  where ri is the average response to picture i after subtracting
the minimum response and there were n pictures (Rolls and Tovee, 1995).
In (B, D, F) the sparseness index was defined as the proportion
of stimuli that elicited a response that was more than half the maximum response.
The arrows indicate the mean values (A= 0.75+/-0.09, B=0.25+/-0.14, C=0.73+/-0.11,
D=0.25+/-0.12, E=0.66+/-0.16, F=0.21+/-0.13).
where ri is the average response to picture i after subtracting
the minimum response and there were n pictures (Rolls and Tovee, 1995).
In (B, D, F) the sparseness index was defined as the proportion
of stimuli that elicited a response that was more than half the maximum response.
The arrows indicate the mean values (A= 0.75+/-0.09, B=0.25+/-0.14, C=0.73+/-0.11,
D=0.25+/-0.12, E=0.66+/-0.16, F=0.21+/-0.13).