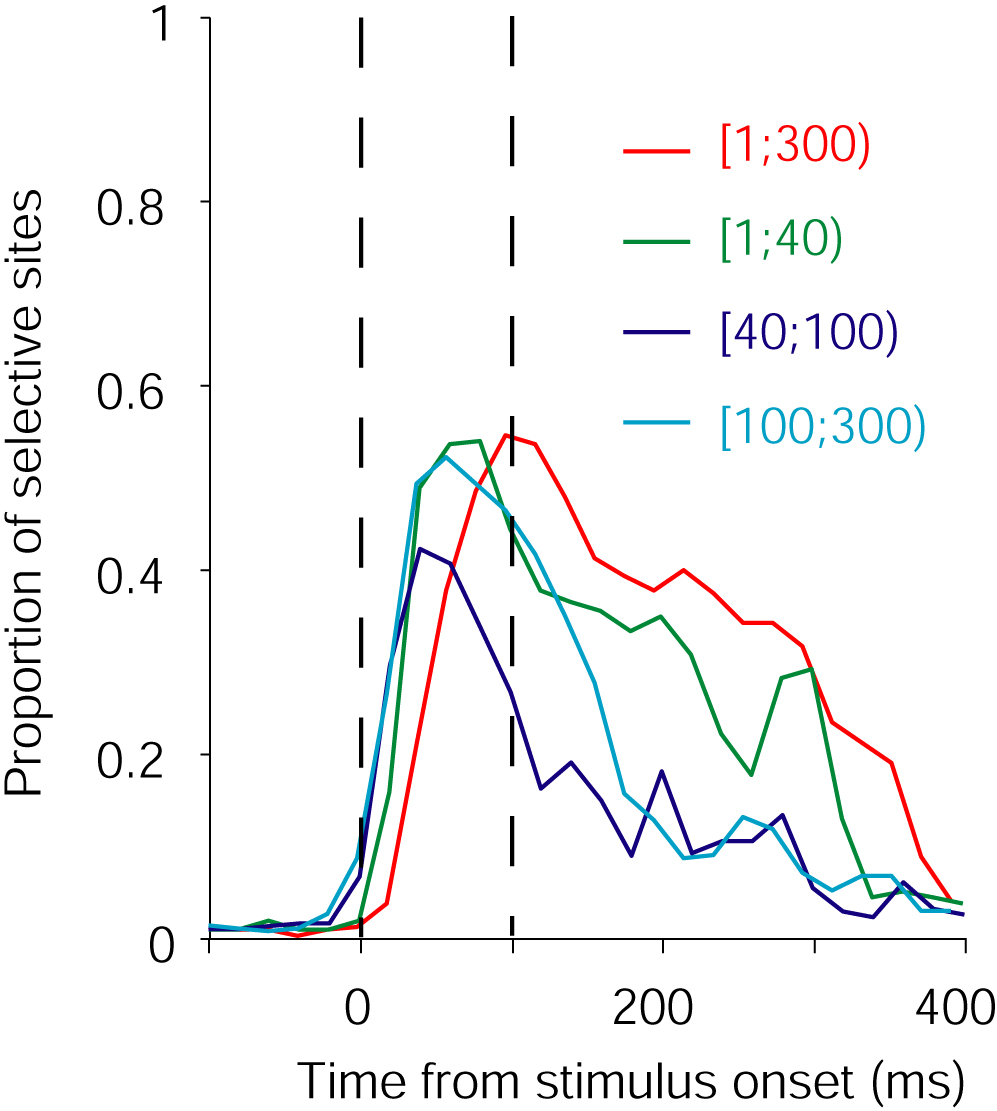

Proportion of selective sites for different frequency bands of the LFP response. We used windows of 100 ms that start at the time indicated on the x-axis. Selectivity was assessed by a one-way ANOVA on the responses for the 77 objects (we used a threshold p value of 0.001 to define a site as selective). The dashed lines indicate the stimulus onset and offset respectively. For the frequencies below 40 Hz, the duration of the response extends significantly into the presentation of the next object (which would be between 200 and 300 ms in this figure). The lower frequencies of the LFP response are more sustained than the higher frequencies. The duration of the response in the [100;300) Hz frequency band resembles the duration of the response for the spiking activity.