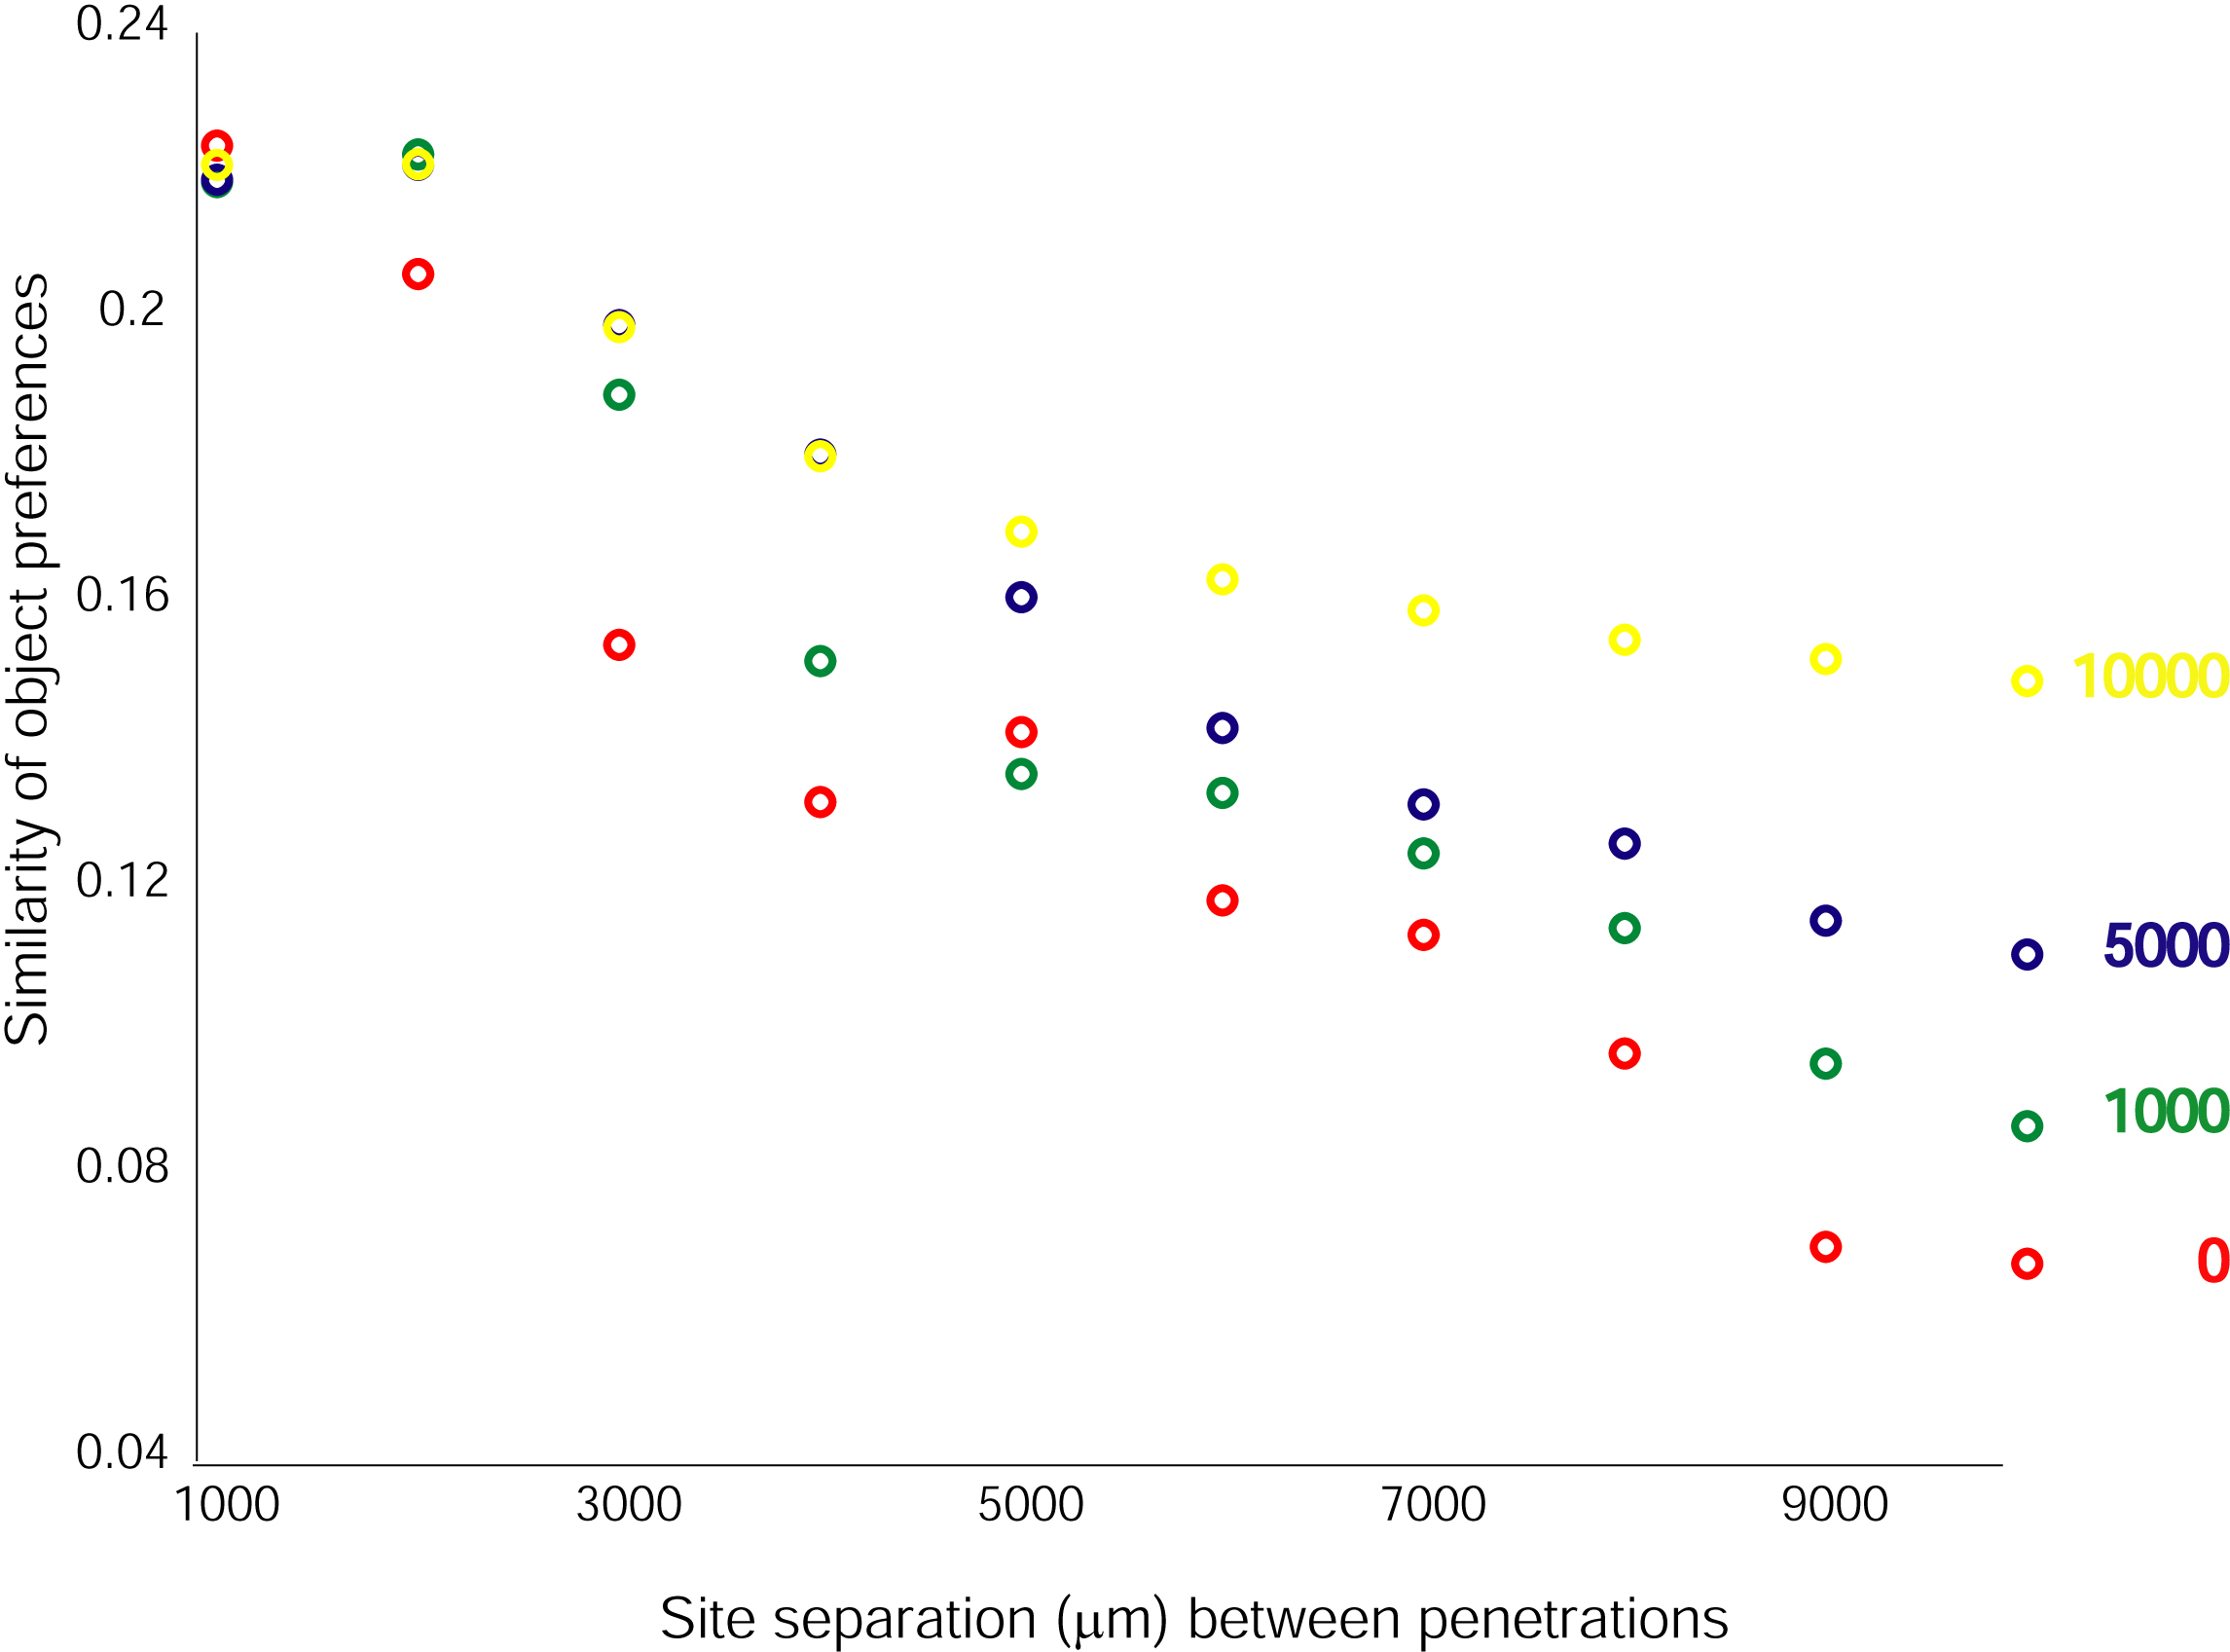
The ordinate shows the mean Pearson correlation coefficients between the LFP responses to all 77 images at spatially separate sites as a function of the separation distance as in Figure 7 in the main text. The distance between each pair of sites was determined from the anterior/posterior and lateral/medial locations of the penetrations at the cortical surface (see text and Experimental Procedures for details). Since these distances are prone to errors, here we estimate how the plot would change after assuming different degrees of error in the distance measurements. For each pair of recording site, a random amount of noise was added to the distance between sites. The noise was a zero-mean gaussian with either 0 (red), 1000 (green), 5000 (blue) or 10000 (yellow) microns for standard deviation.