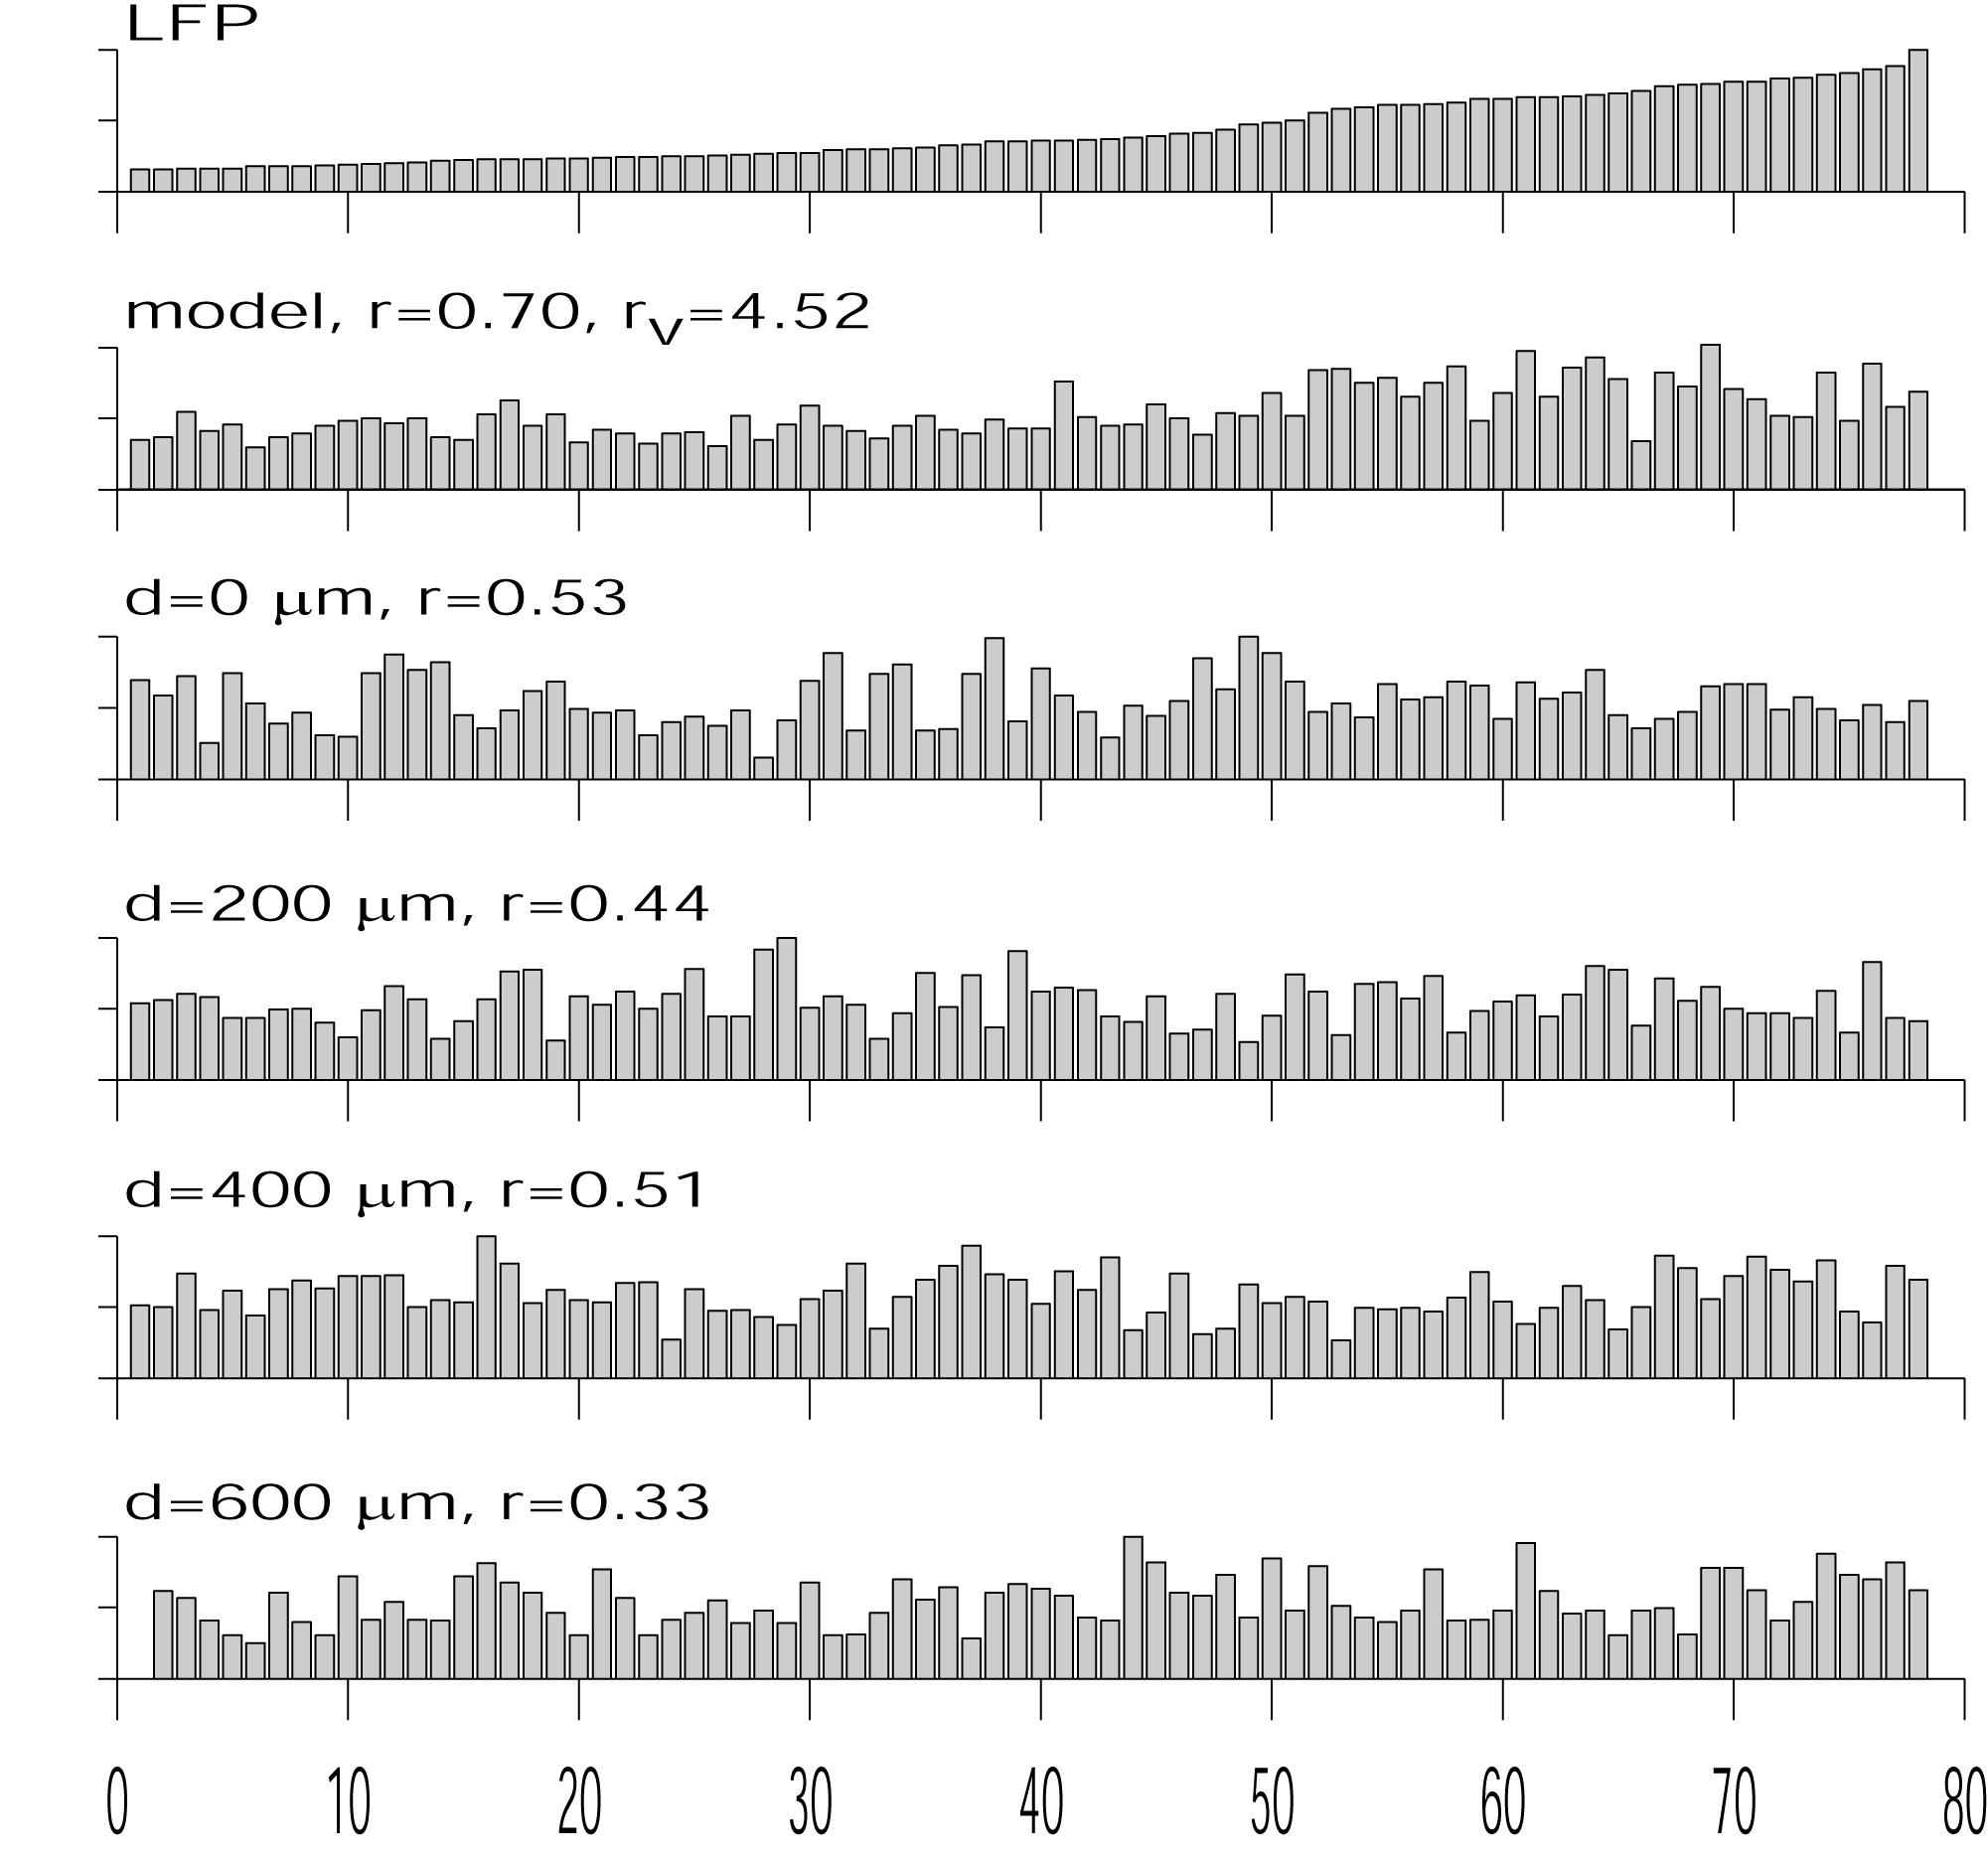
Example 1
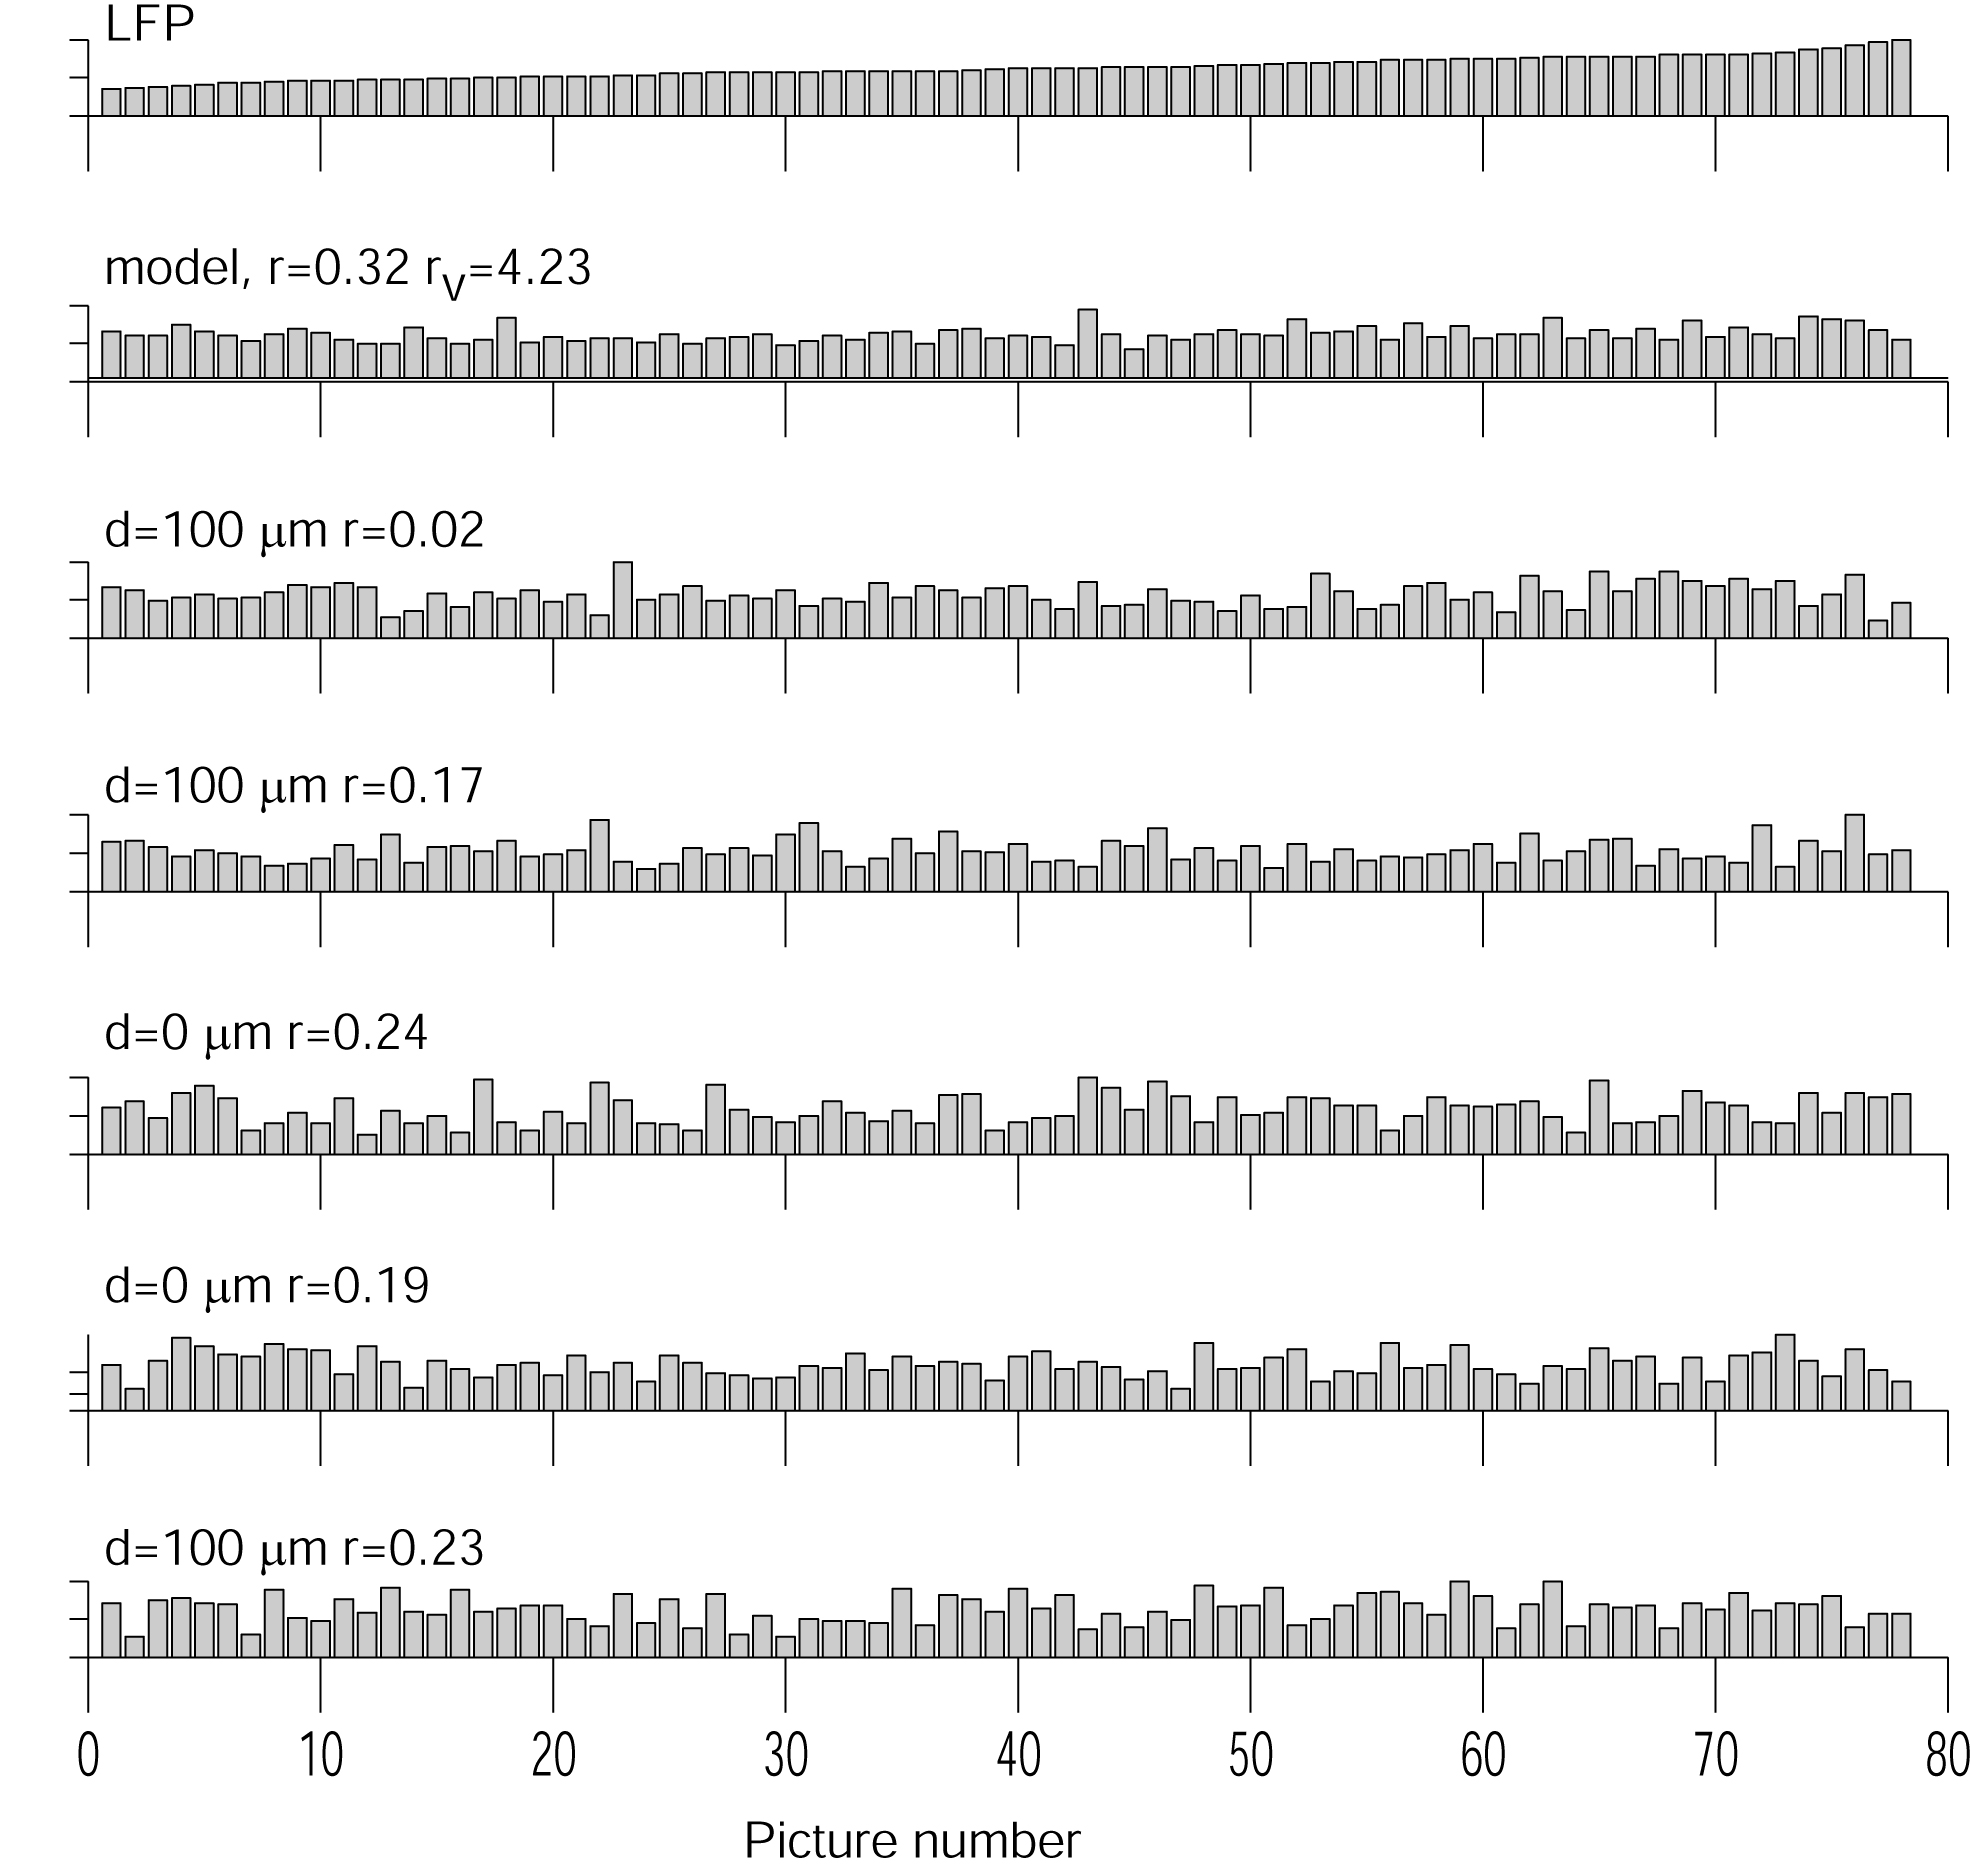
Example 2
Example 3
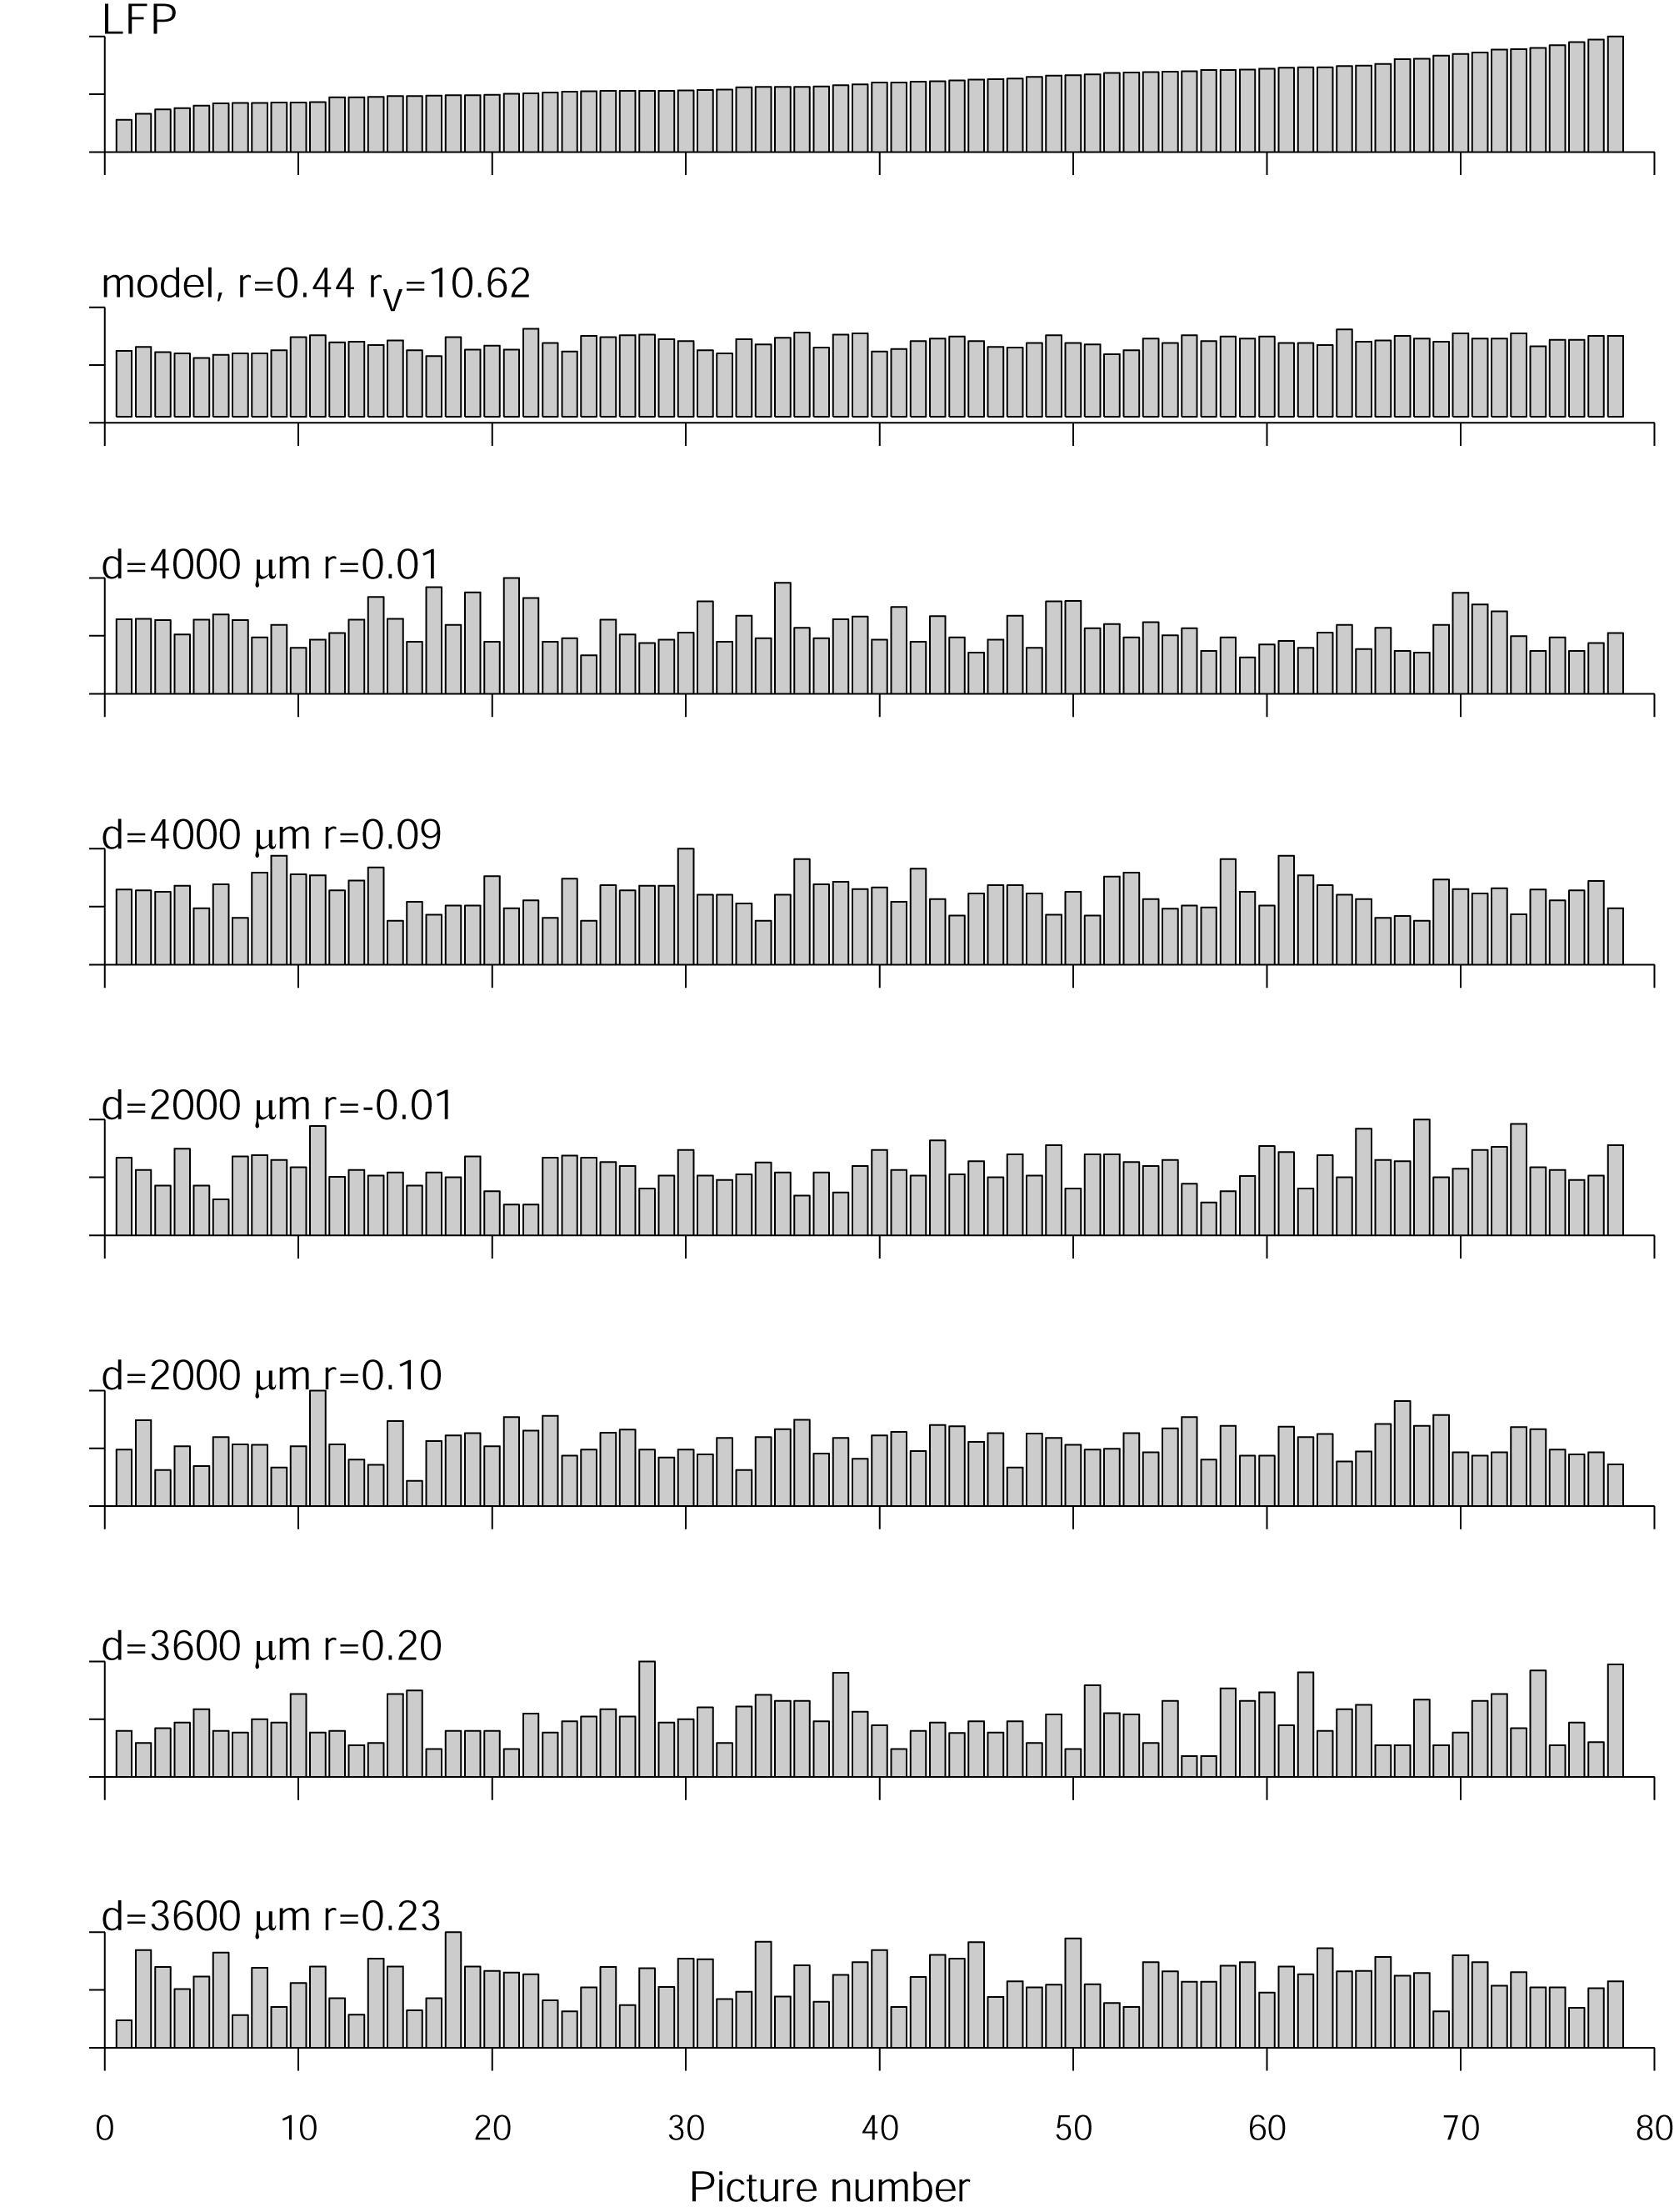
Three examples showing the responses to the 77 pictures for the LFPs (top), model averaging spiking activity around the LFP recording site and several individual examples of the spiking activity around the LFP recording site. Responses are sorted based on the LFP response magnitude. "r" indicates the correlation coefficient for the 77 images to the LFP, "rv" indicates the ratio of the variance across images to the variance within images. Responses were normalized to the maximum rsponse across the 77 images in each case.