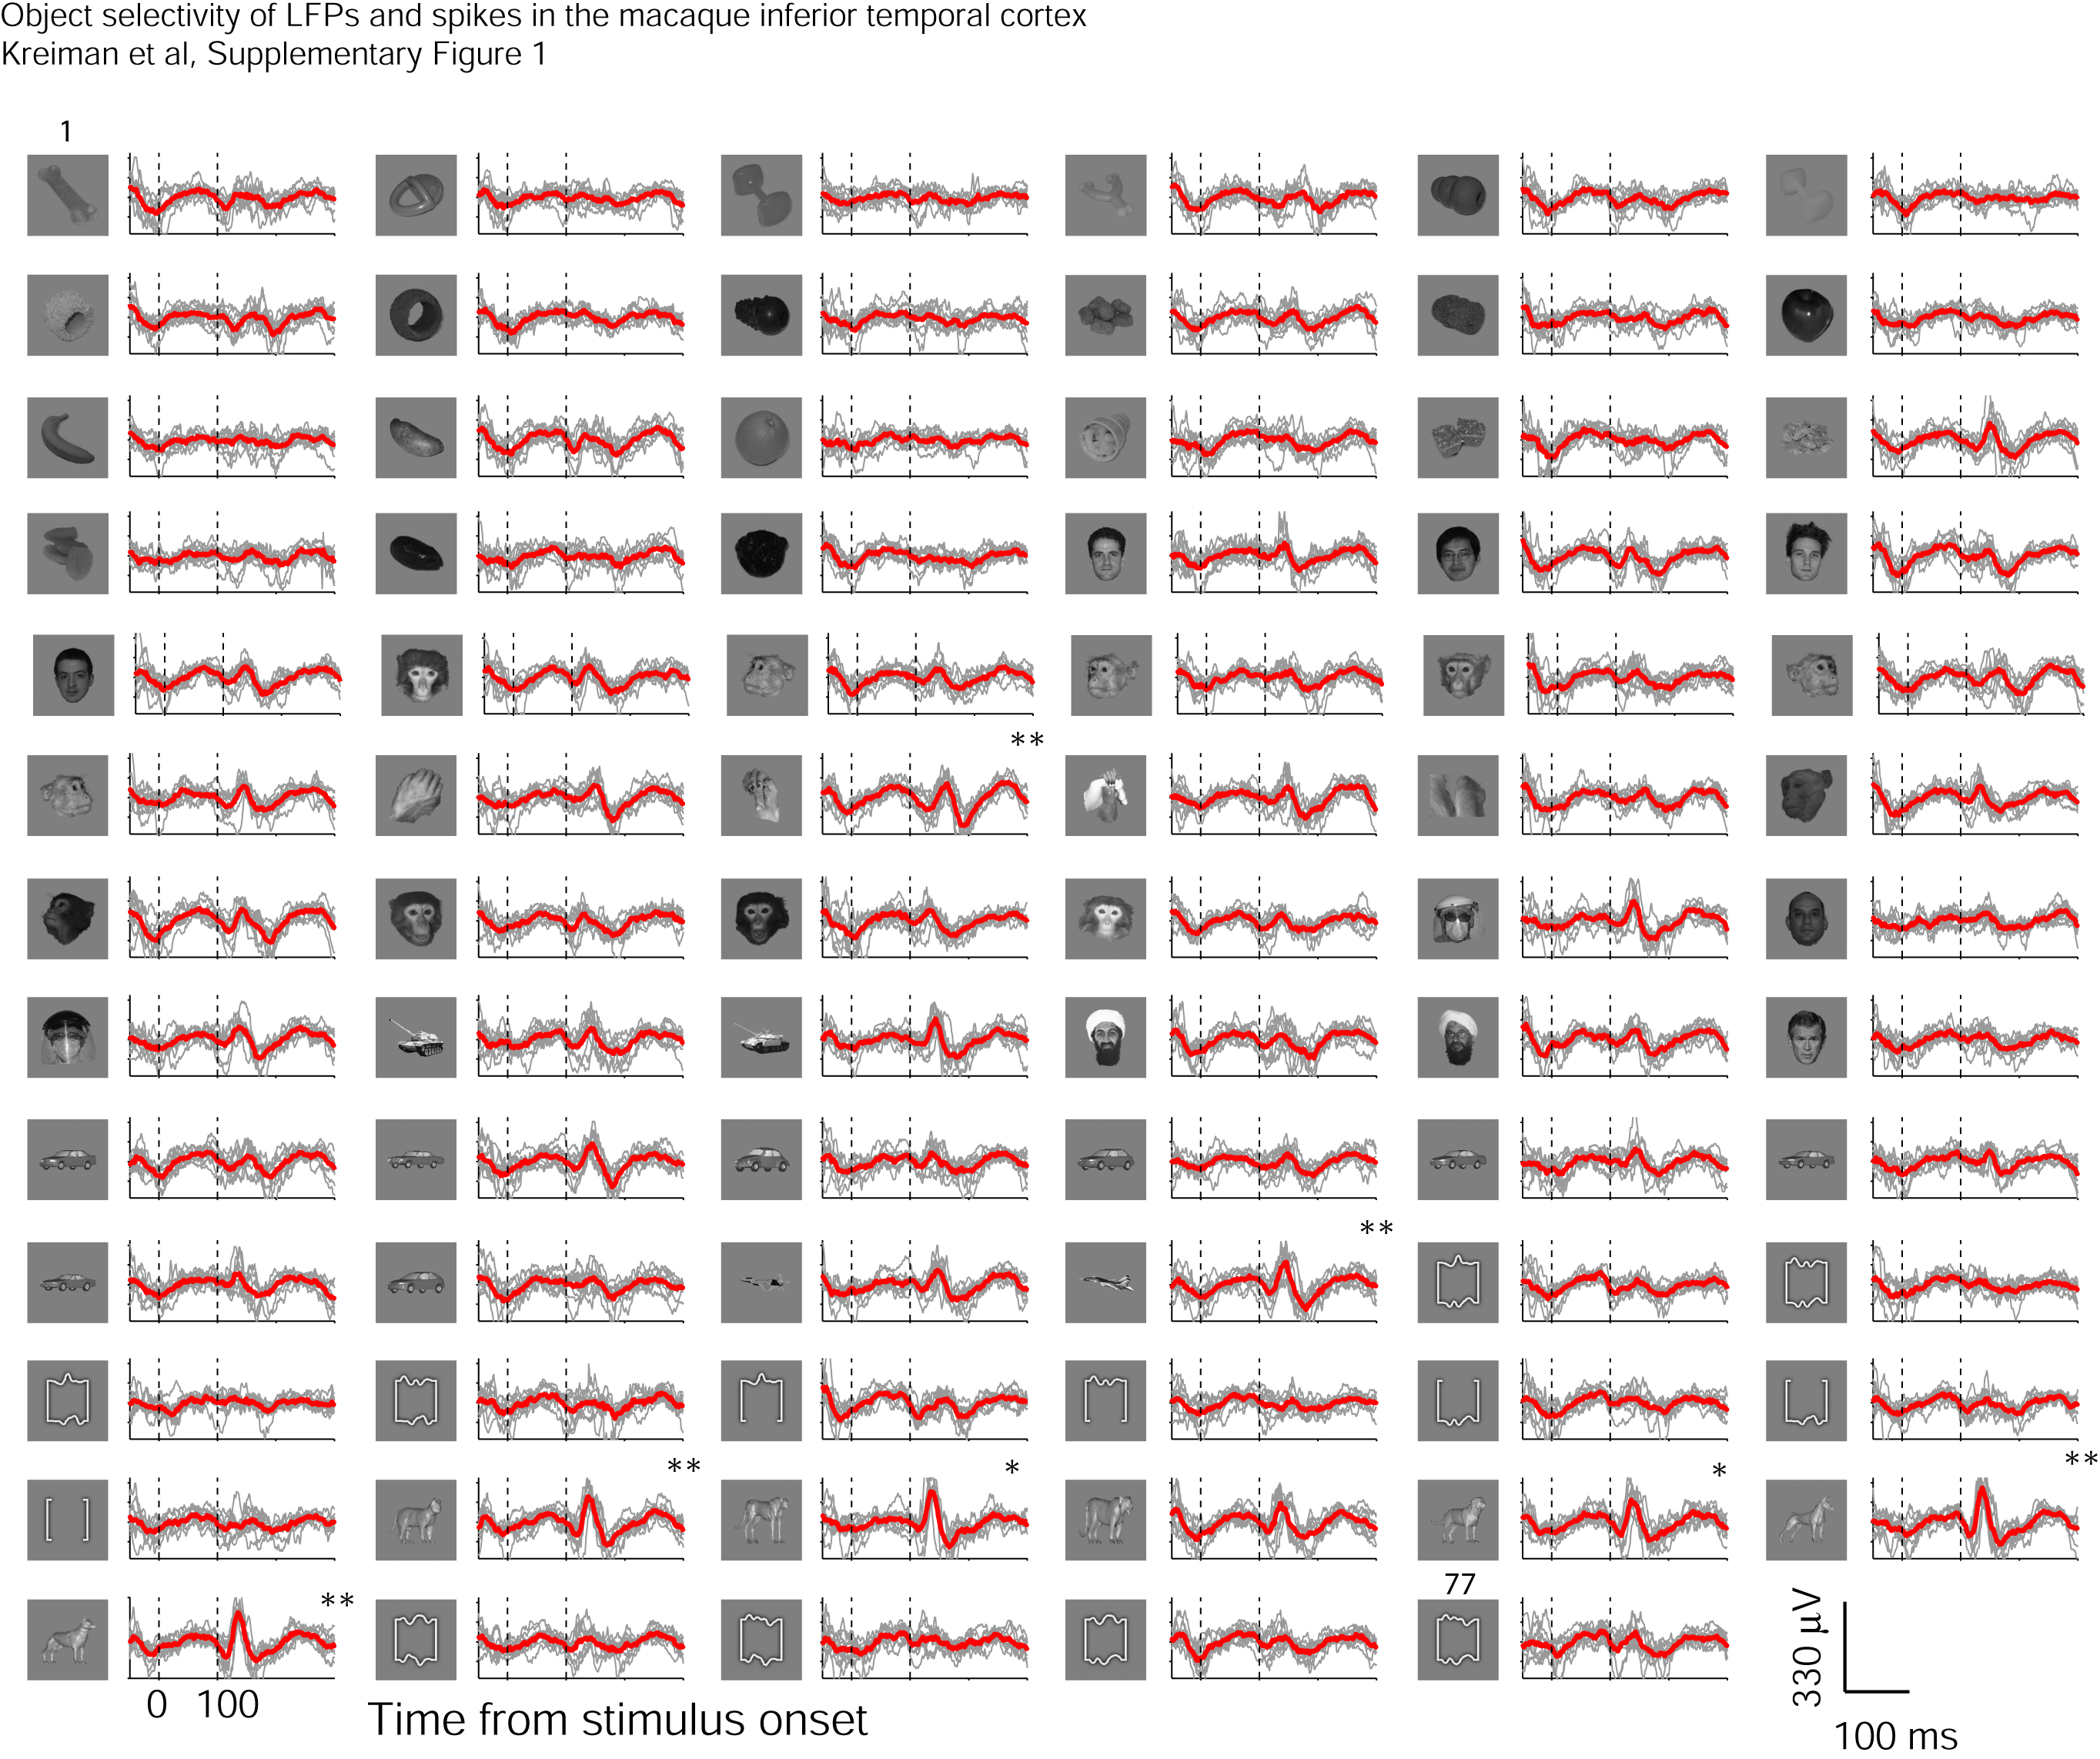
Example of the LFP responses at one IT recording site to the 77 different images.
This is the same site shown in Figure 1 in the main text; here we show the responses
to all 77 objects. The gray lines show the LFP response to each of the 10 repetitions
of each stimulus aligned at the time of stimulus onset (the raw signal is low
pass filtered at 300 Hz and the DC component is removed). The thick red line
shows the average LFP waveform. The vertical dashed lines denote stimulus onset
and offset. The ratio of the variance across images to the variance within images
for the total power for this site was 4.4 (ANOVA p < 10-8). A post-hoc t
test to compare the responses during the 100 to 200 ms interval after stimulus
onset to the baseline before stimulus presentation was applied to the LFP responses
to the individual images (see Experimental Procedures, ‘**’ denotes
p<0.001 and ‘*’ denotes p<0.01).