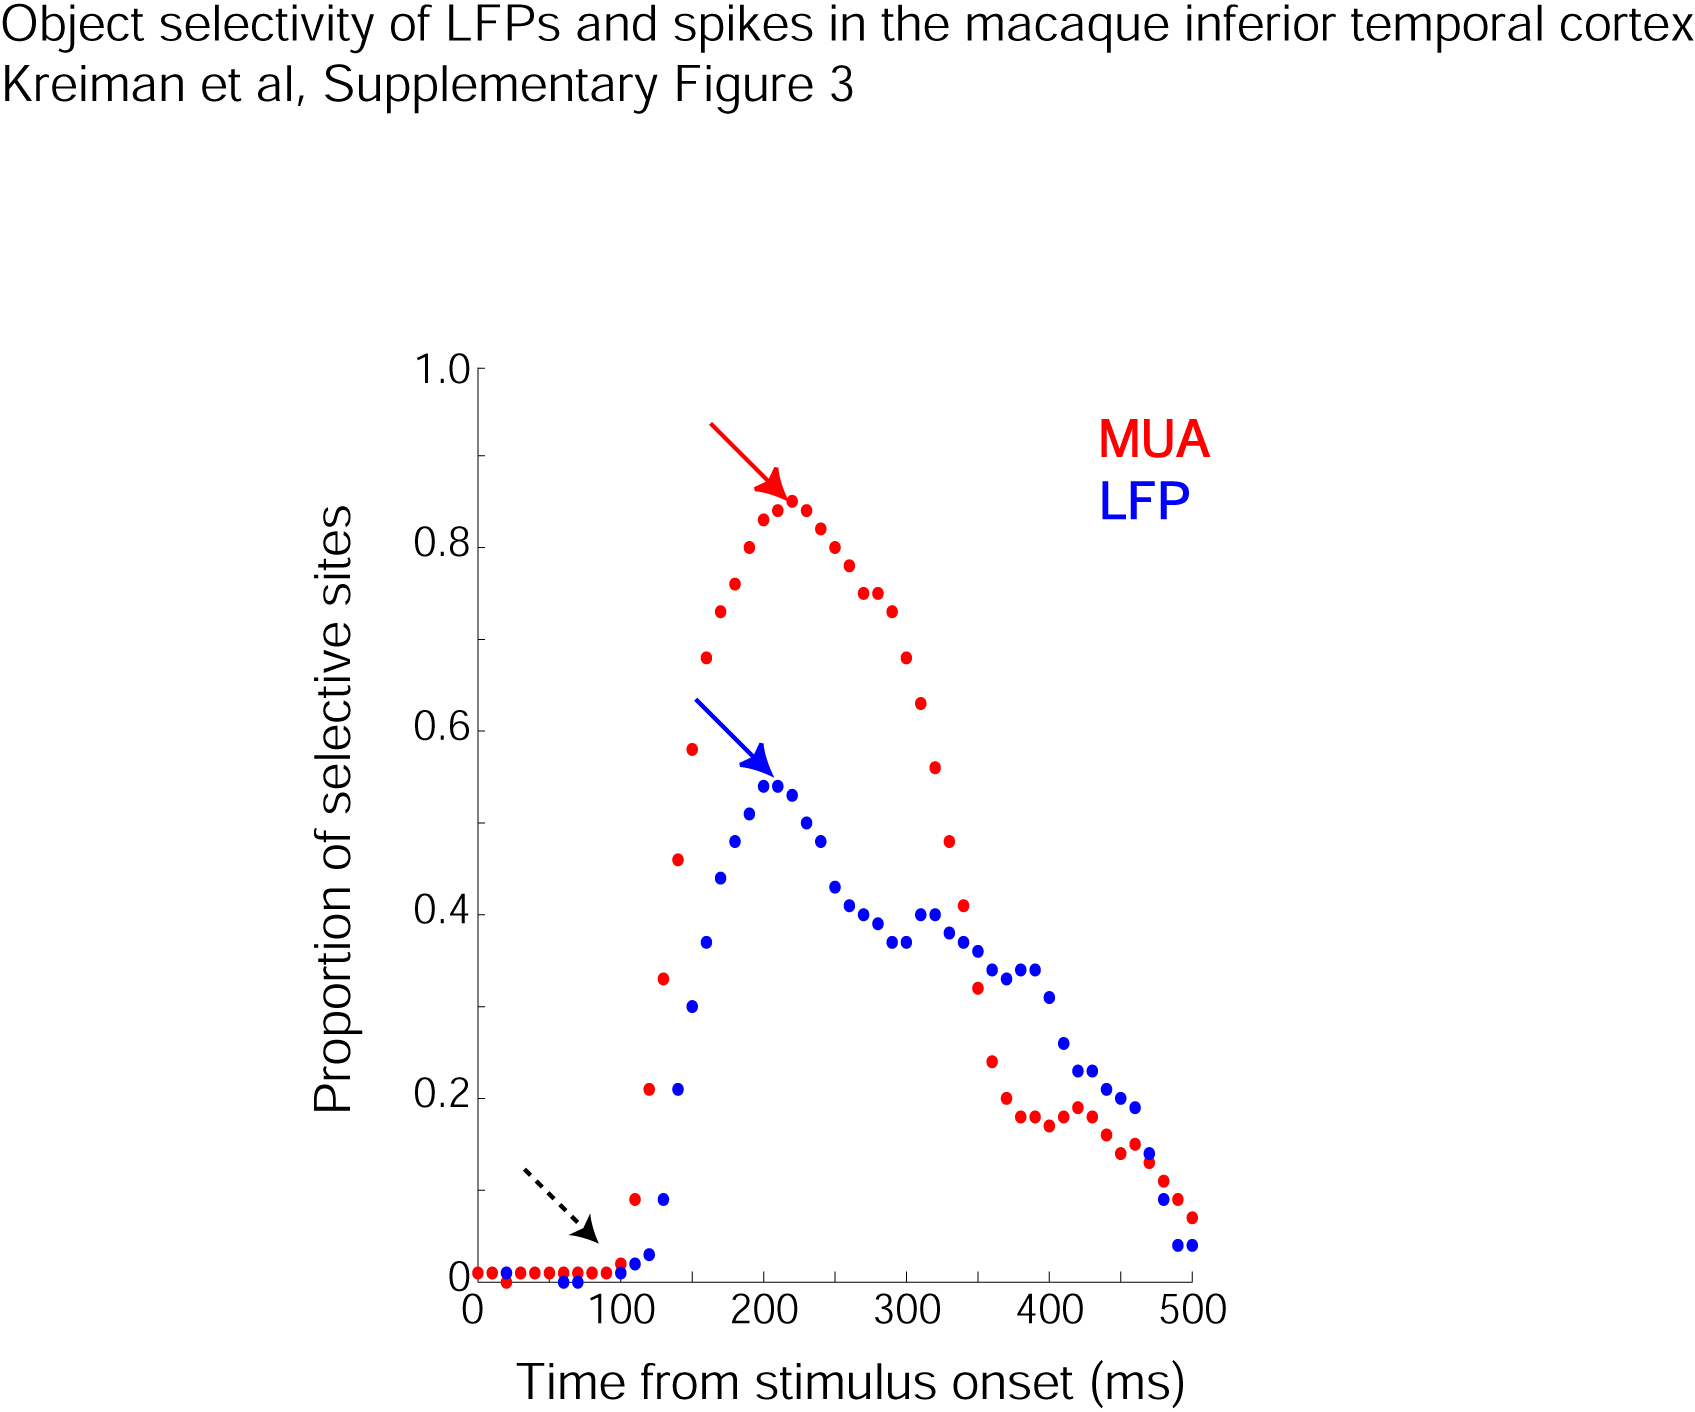
Responses were defined in a sliding window (step = 10 ms) of 100 ms ending
at the time indicated on the x-axis. For each window, we performed a one-way
ANOVA (p<0.001) to determine whether a site was selective or not. The y-axis
indicates the proportion of sites that showed a selective response for MUA (red)
and LFP (blue). The dotted arrow shows the proportion of selective sites for
the [0;100) ms interval and the red and blue arrows indicate the maxima of the
MUA and LFP curves respectively.