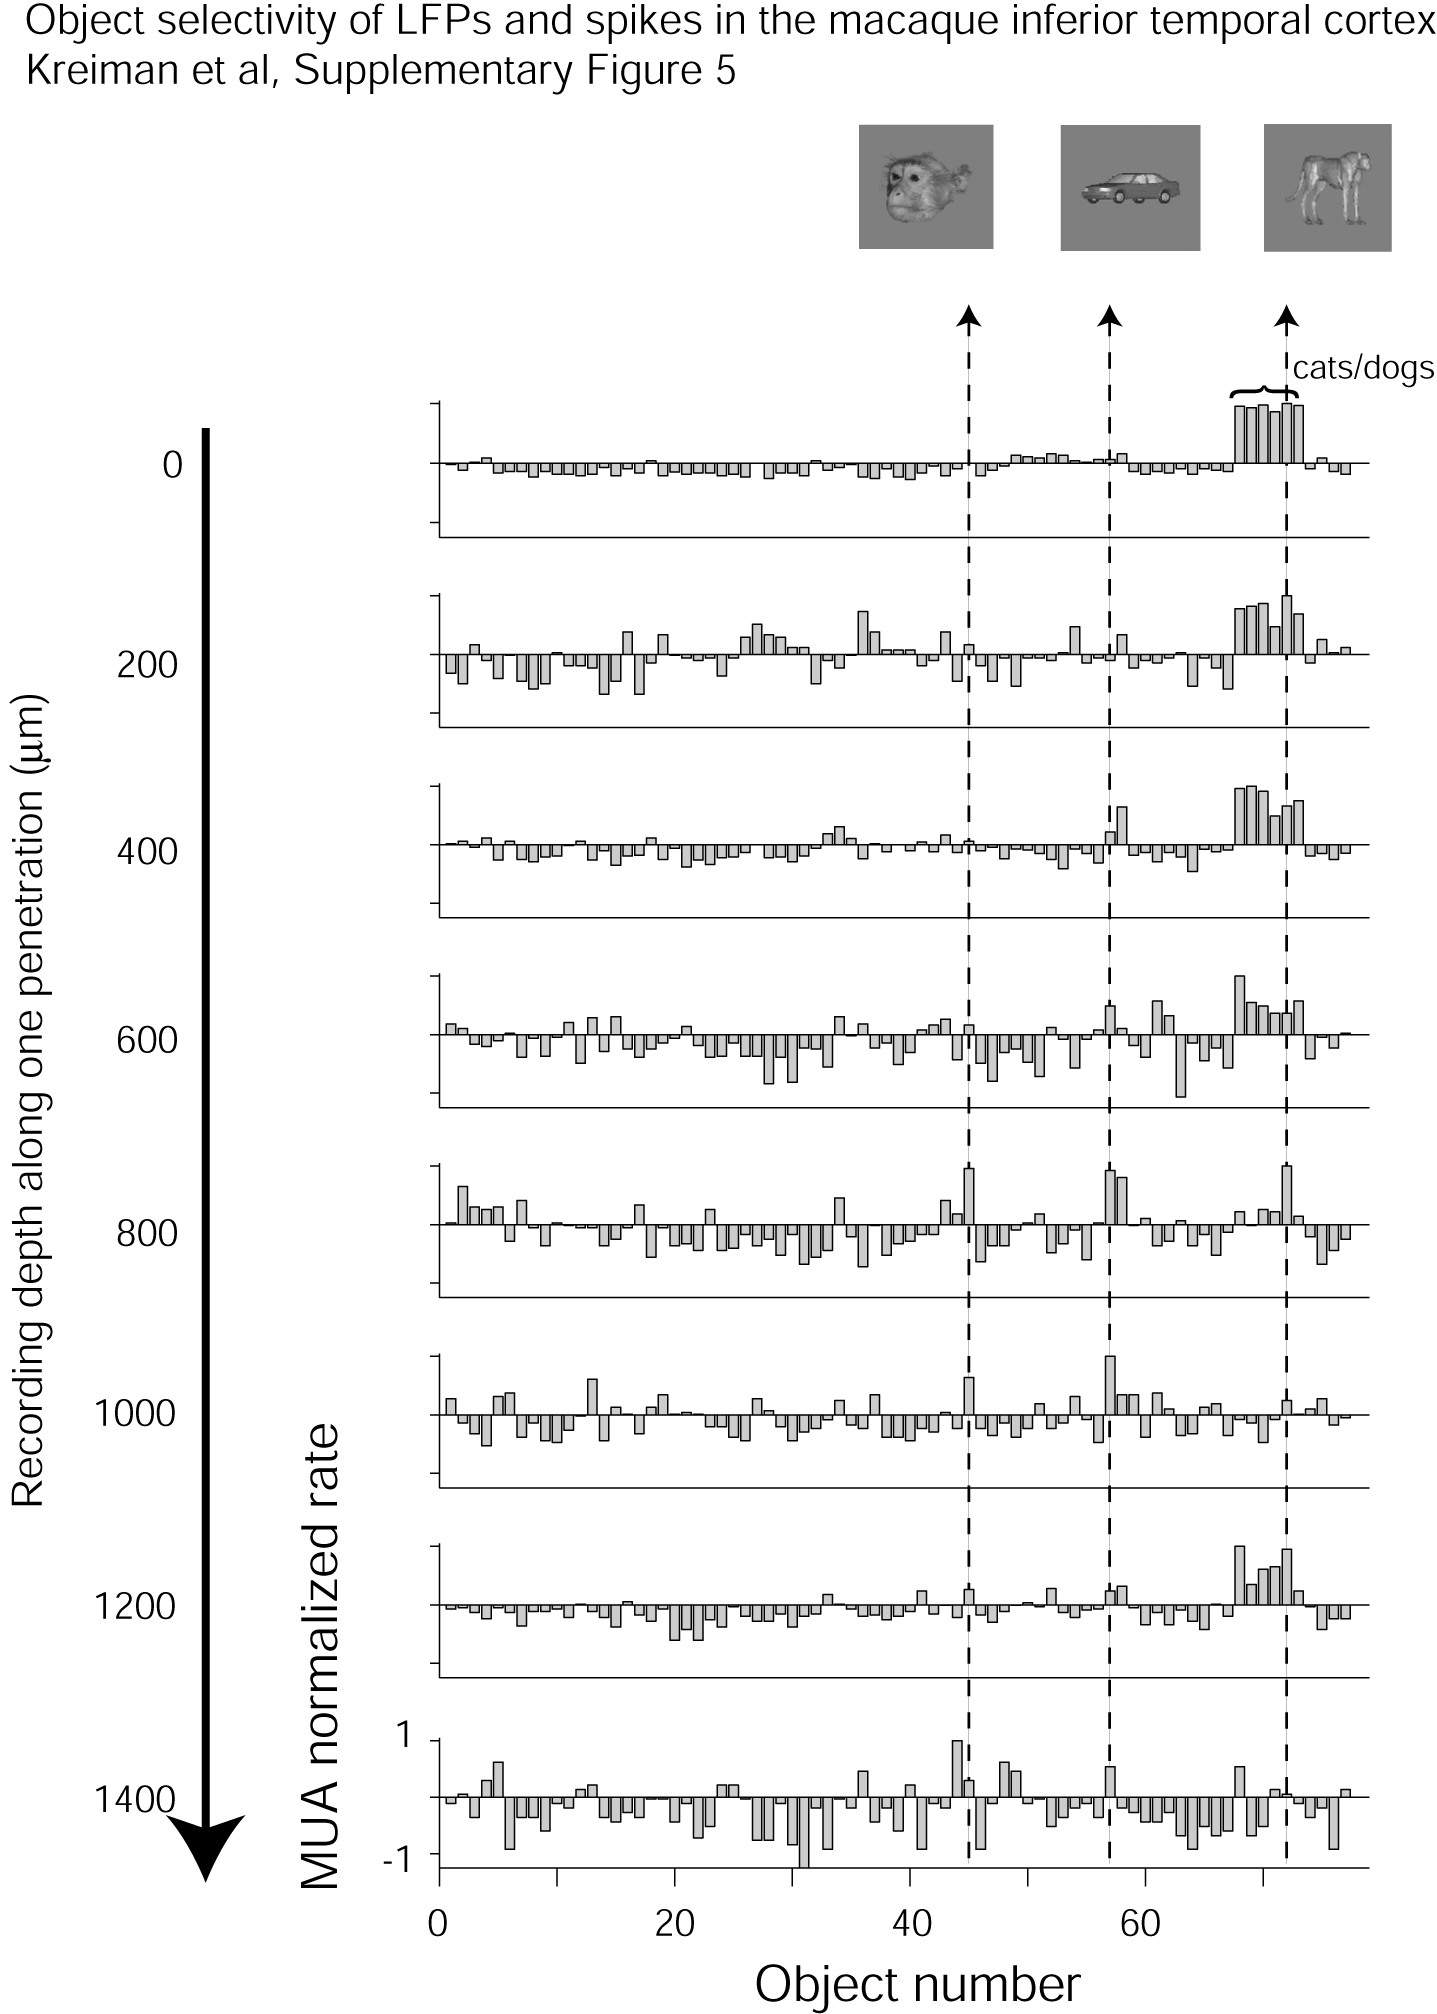
Normalized spike response to each of the 77 images for 8 sites separated by 200 ?m steps recorded along one penetration through ventral IT. For each site, the ordinate was computed by subtracting the average spike response to all images from the spike response to each image and then dividing by the maximum spike response (in the 100 to 300 ms interval following stimulus onset). The images are arranged along the abscissa in the same order as shown in Figure 1; the dashed lines highlight the responses to three example images shown at the top. The recording depth of each site is indicated to the right of the plot, and more superficial cortical layers are at the bottom of the plot.