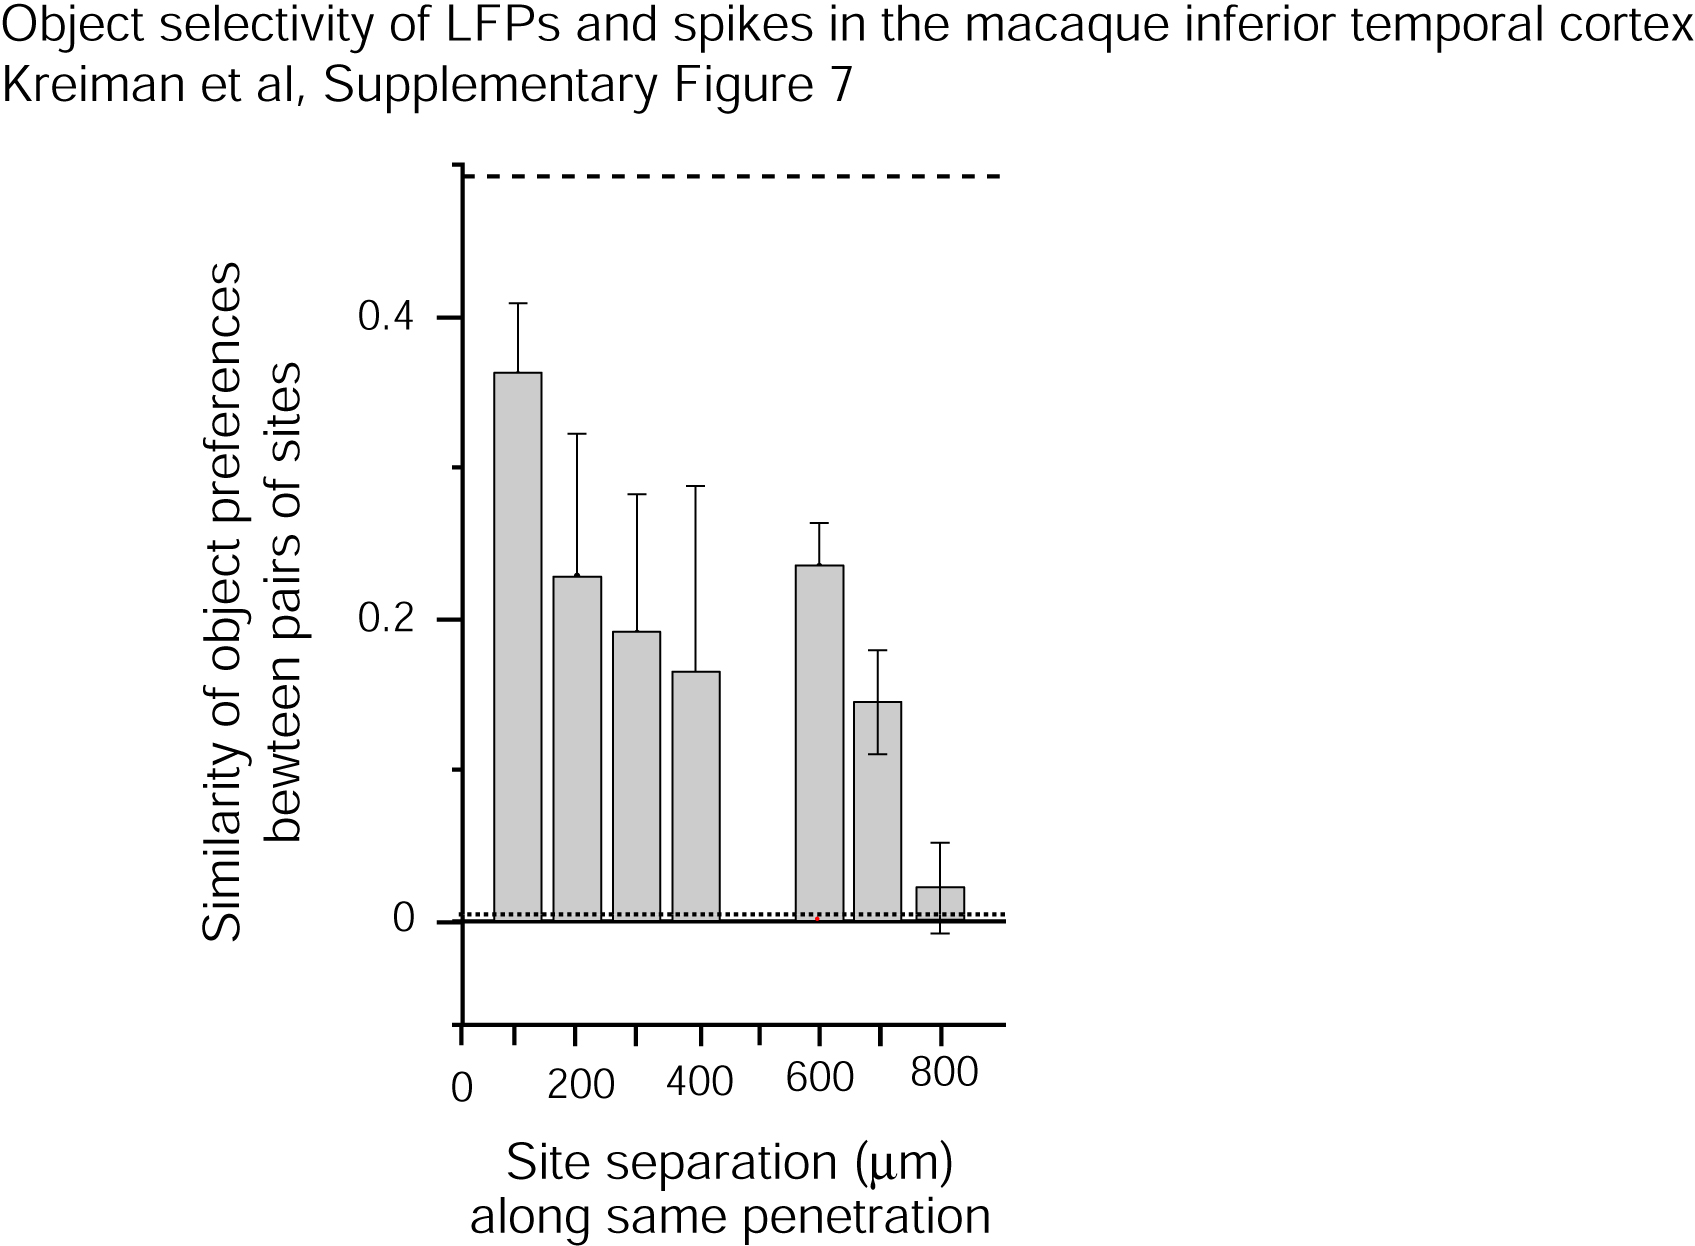

The ordinate shows the mean Pearson correlation coefficients between responses
to all 77 images at spatially separate sites as a function of the separation
distance within the same penetration for single unit activity (the format is
the same as in Figure 7). The distance between each pair of sites was determined
by the microdrive readings along the penetration. As an estimate of the maximum
correlation that could be expected given the variability in the data, the dashed
horizontal line shows the mean correlation obtained from comparing the odd and
even repetitions of the SUA vs. SUA at the same site (after correction for the
number of repetitions. The dotted line shows the correlation coefficient between
sites in different hemispheres.