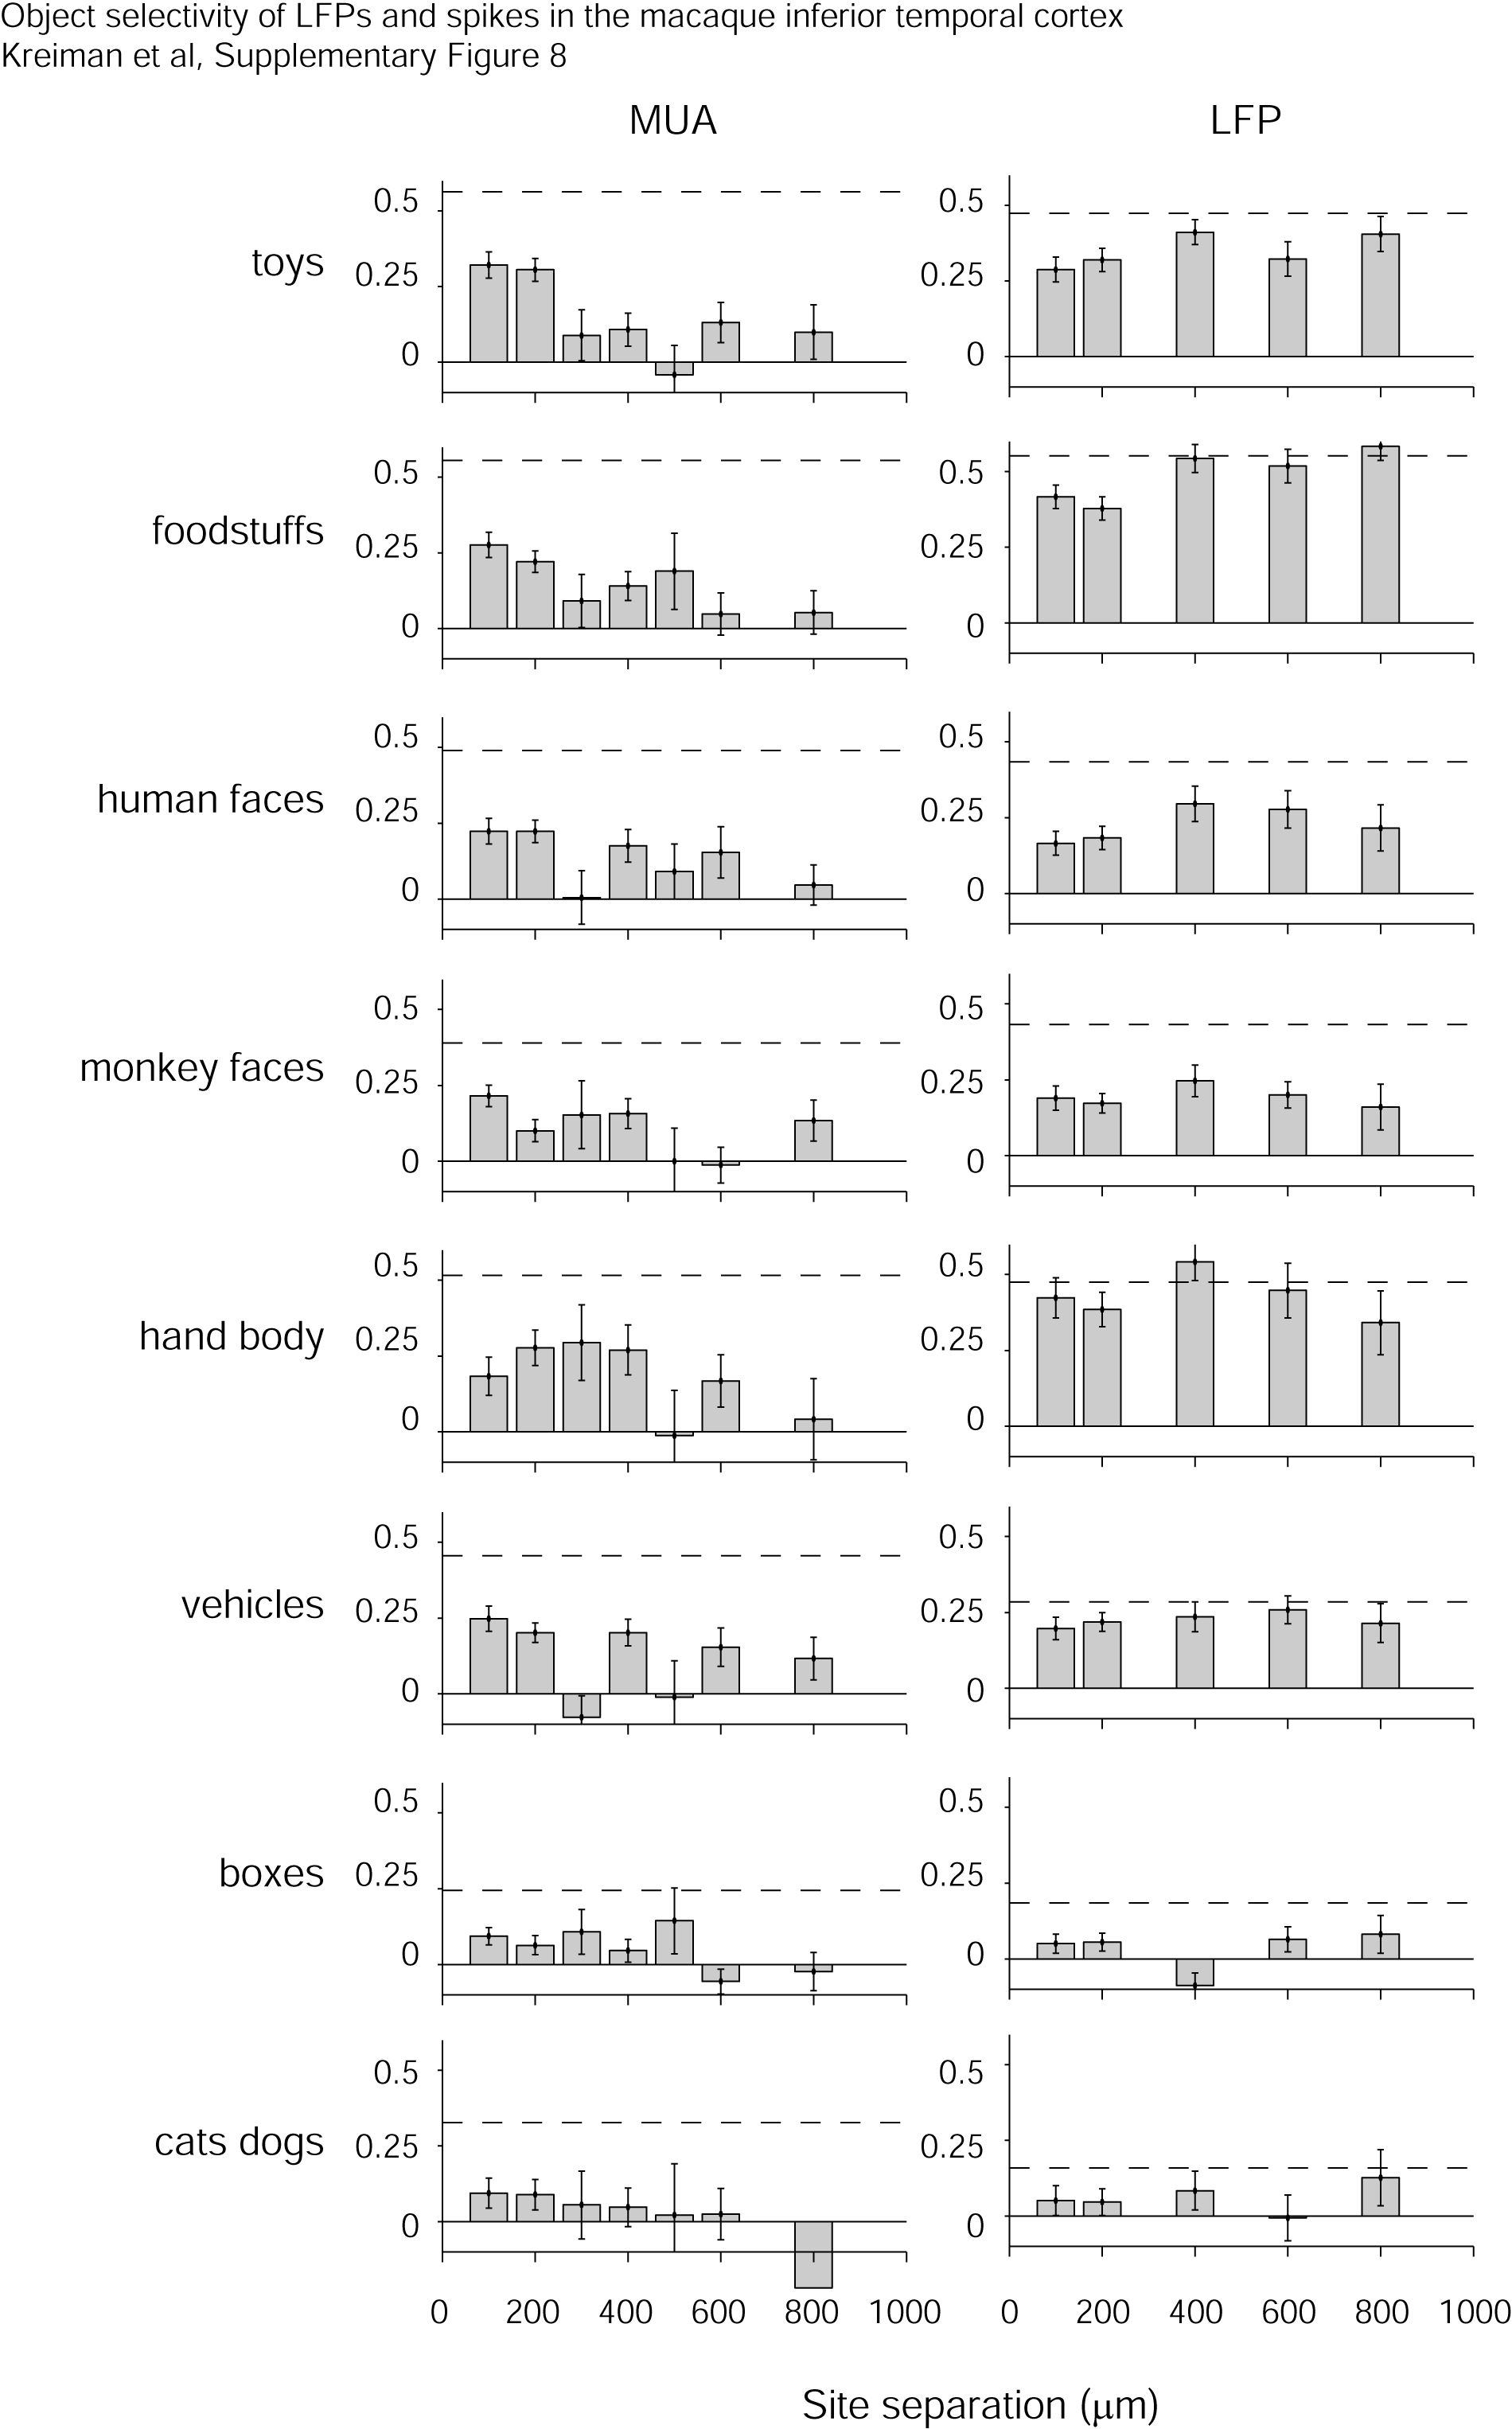
This figure extends the observations in Figure 7 where correlations were computed
between all 77 pictures. Here we compute the correlation coefficients for MUA
(left) and LFPs (right) only within each of 8 specific groups of pictures: toys
(9 images), foodstuffs (12 images), human faces (10 images), monkey faces (11
images), hand/body (4 images), vehicles (12 images), boxes (13 images) and cats/dogs
(6 images). All the images are shown in Figure S1. The format is the same as
in Figure 7.