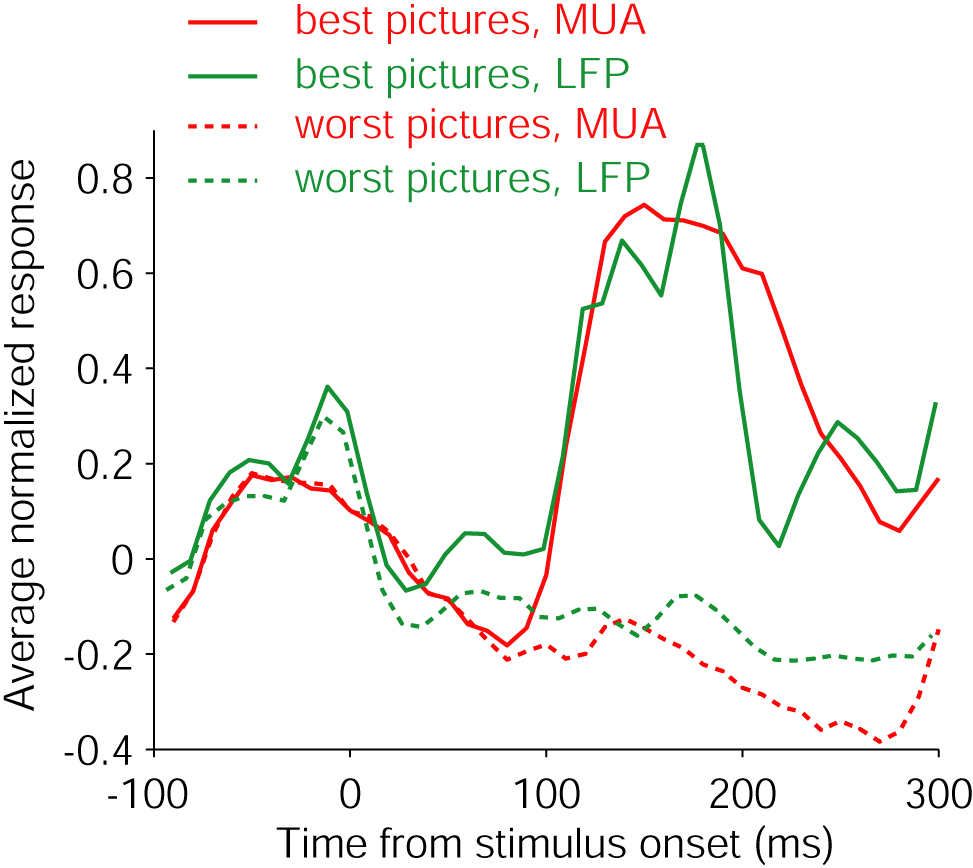
Average time course of the MUA responses (red, n=279 MUA-selective sites) and LFP responses (green, n=139 LFP-selective sites). For each site, we took the activity for the best 5 stimuli (solid trace), and the worst 5 stimuli (dashed trace). The activity was binned (bin size = 10 ms, spike count for MUA and signal power for LFP), the average response in the [0;50) ms interval was subtracted and the resulting signal was normalized by the 95th response percentile (similar to normalizing by the maximum but more robust). The resulting response waveform was then averaged over all the included sites.