Supplementary Figure 3
Click on Figure to enlarge
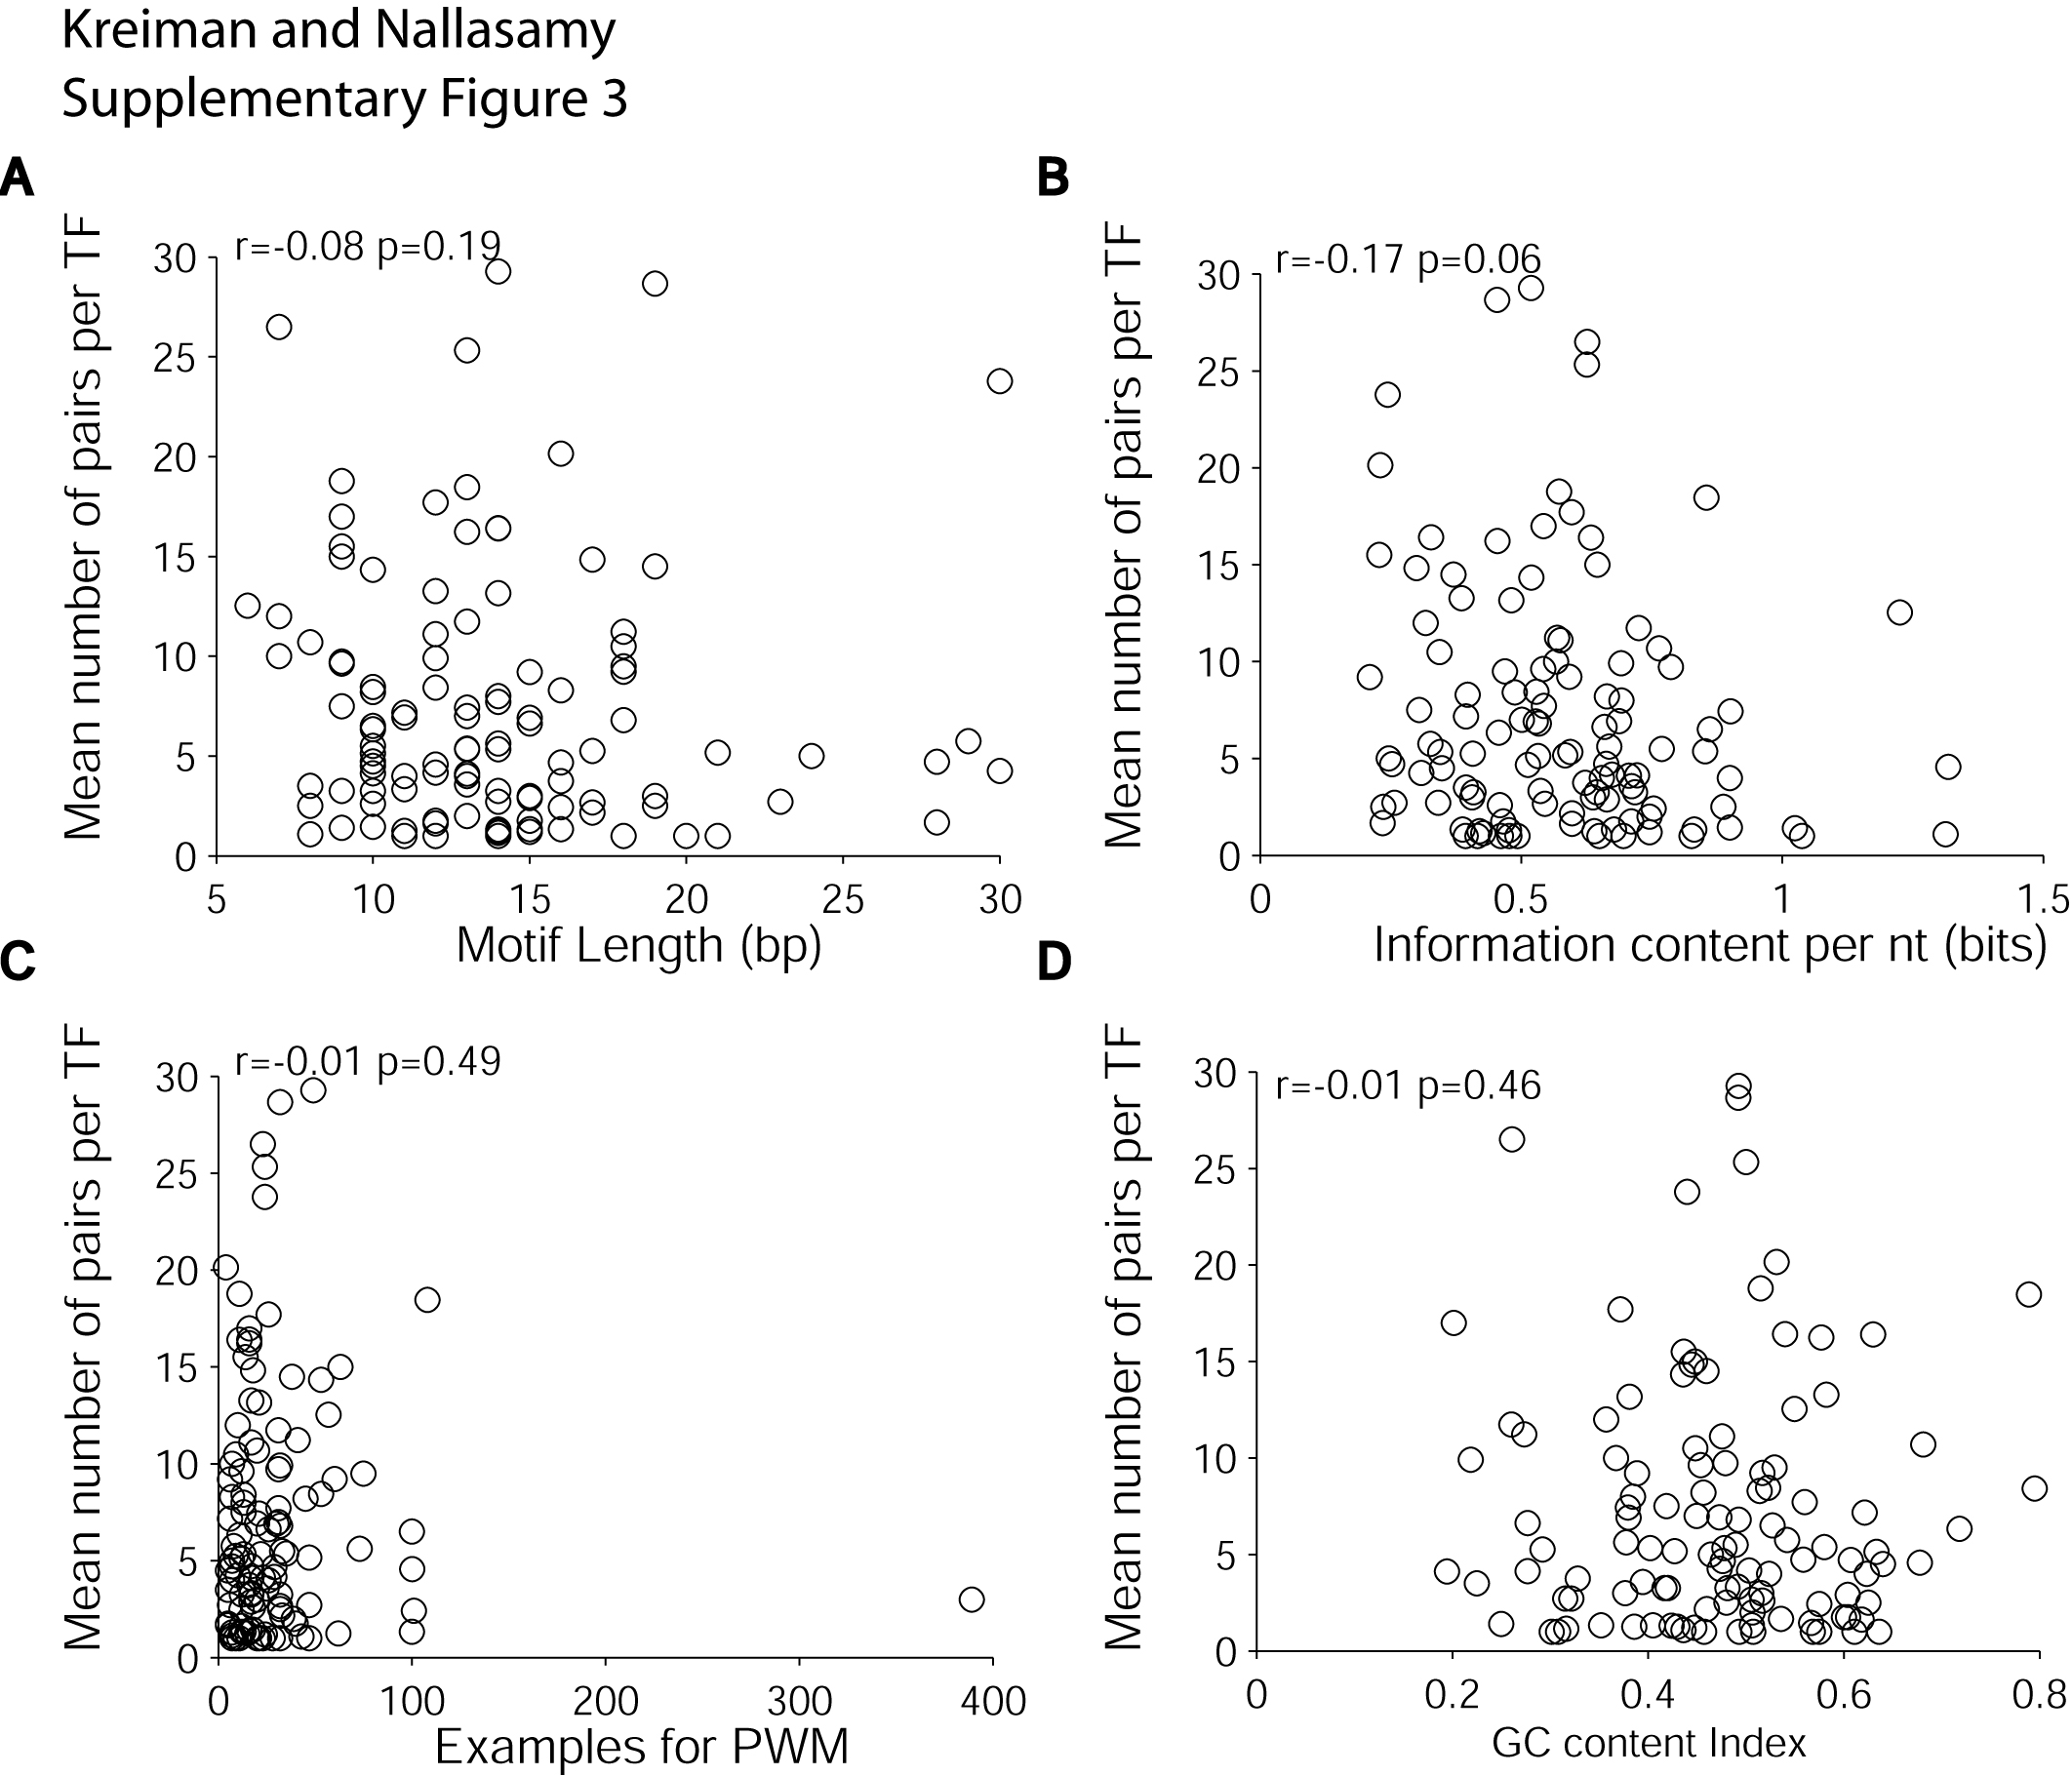
Number of motif pairs with significant order/orientation pattern biases for
each motif as a function of different properties of the motif:
(A) motif length, (B) motif information content
per nucleotide (Stormo, 2000), (C) number of examples used
to build the PWM model and
(D) GC content index (average G+C fraction per nucleotide).
The “r” value shows the Pearson correlation coefficient
and the “p” value
is the probability of observing such a value for r under the null hypothesis
that the two variables are uncorrelated using a non-parametric
permutation test.
The number of motif pairs showed only a weak correlation with the length of
the motif, the number of sites used to define the PWM model, the information
content per nucleotide or the GC content.
In contrast to these observations, the numer of pairs for a given motif was
significantly correlated with the degree of palindromicity of the PWM (see main
text and Figure S6).