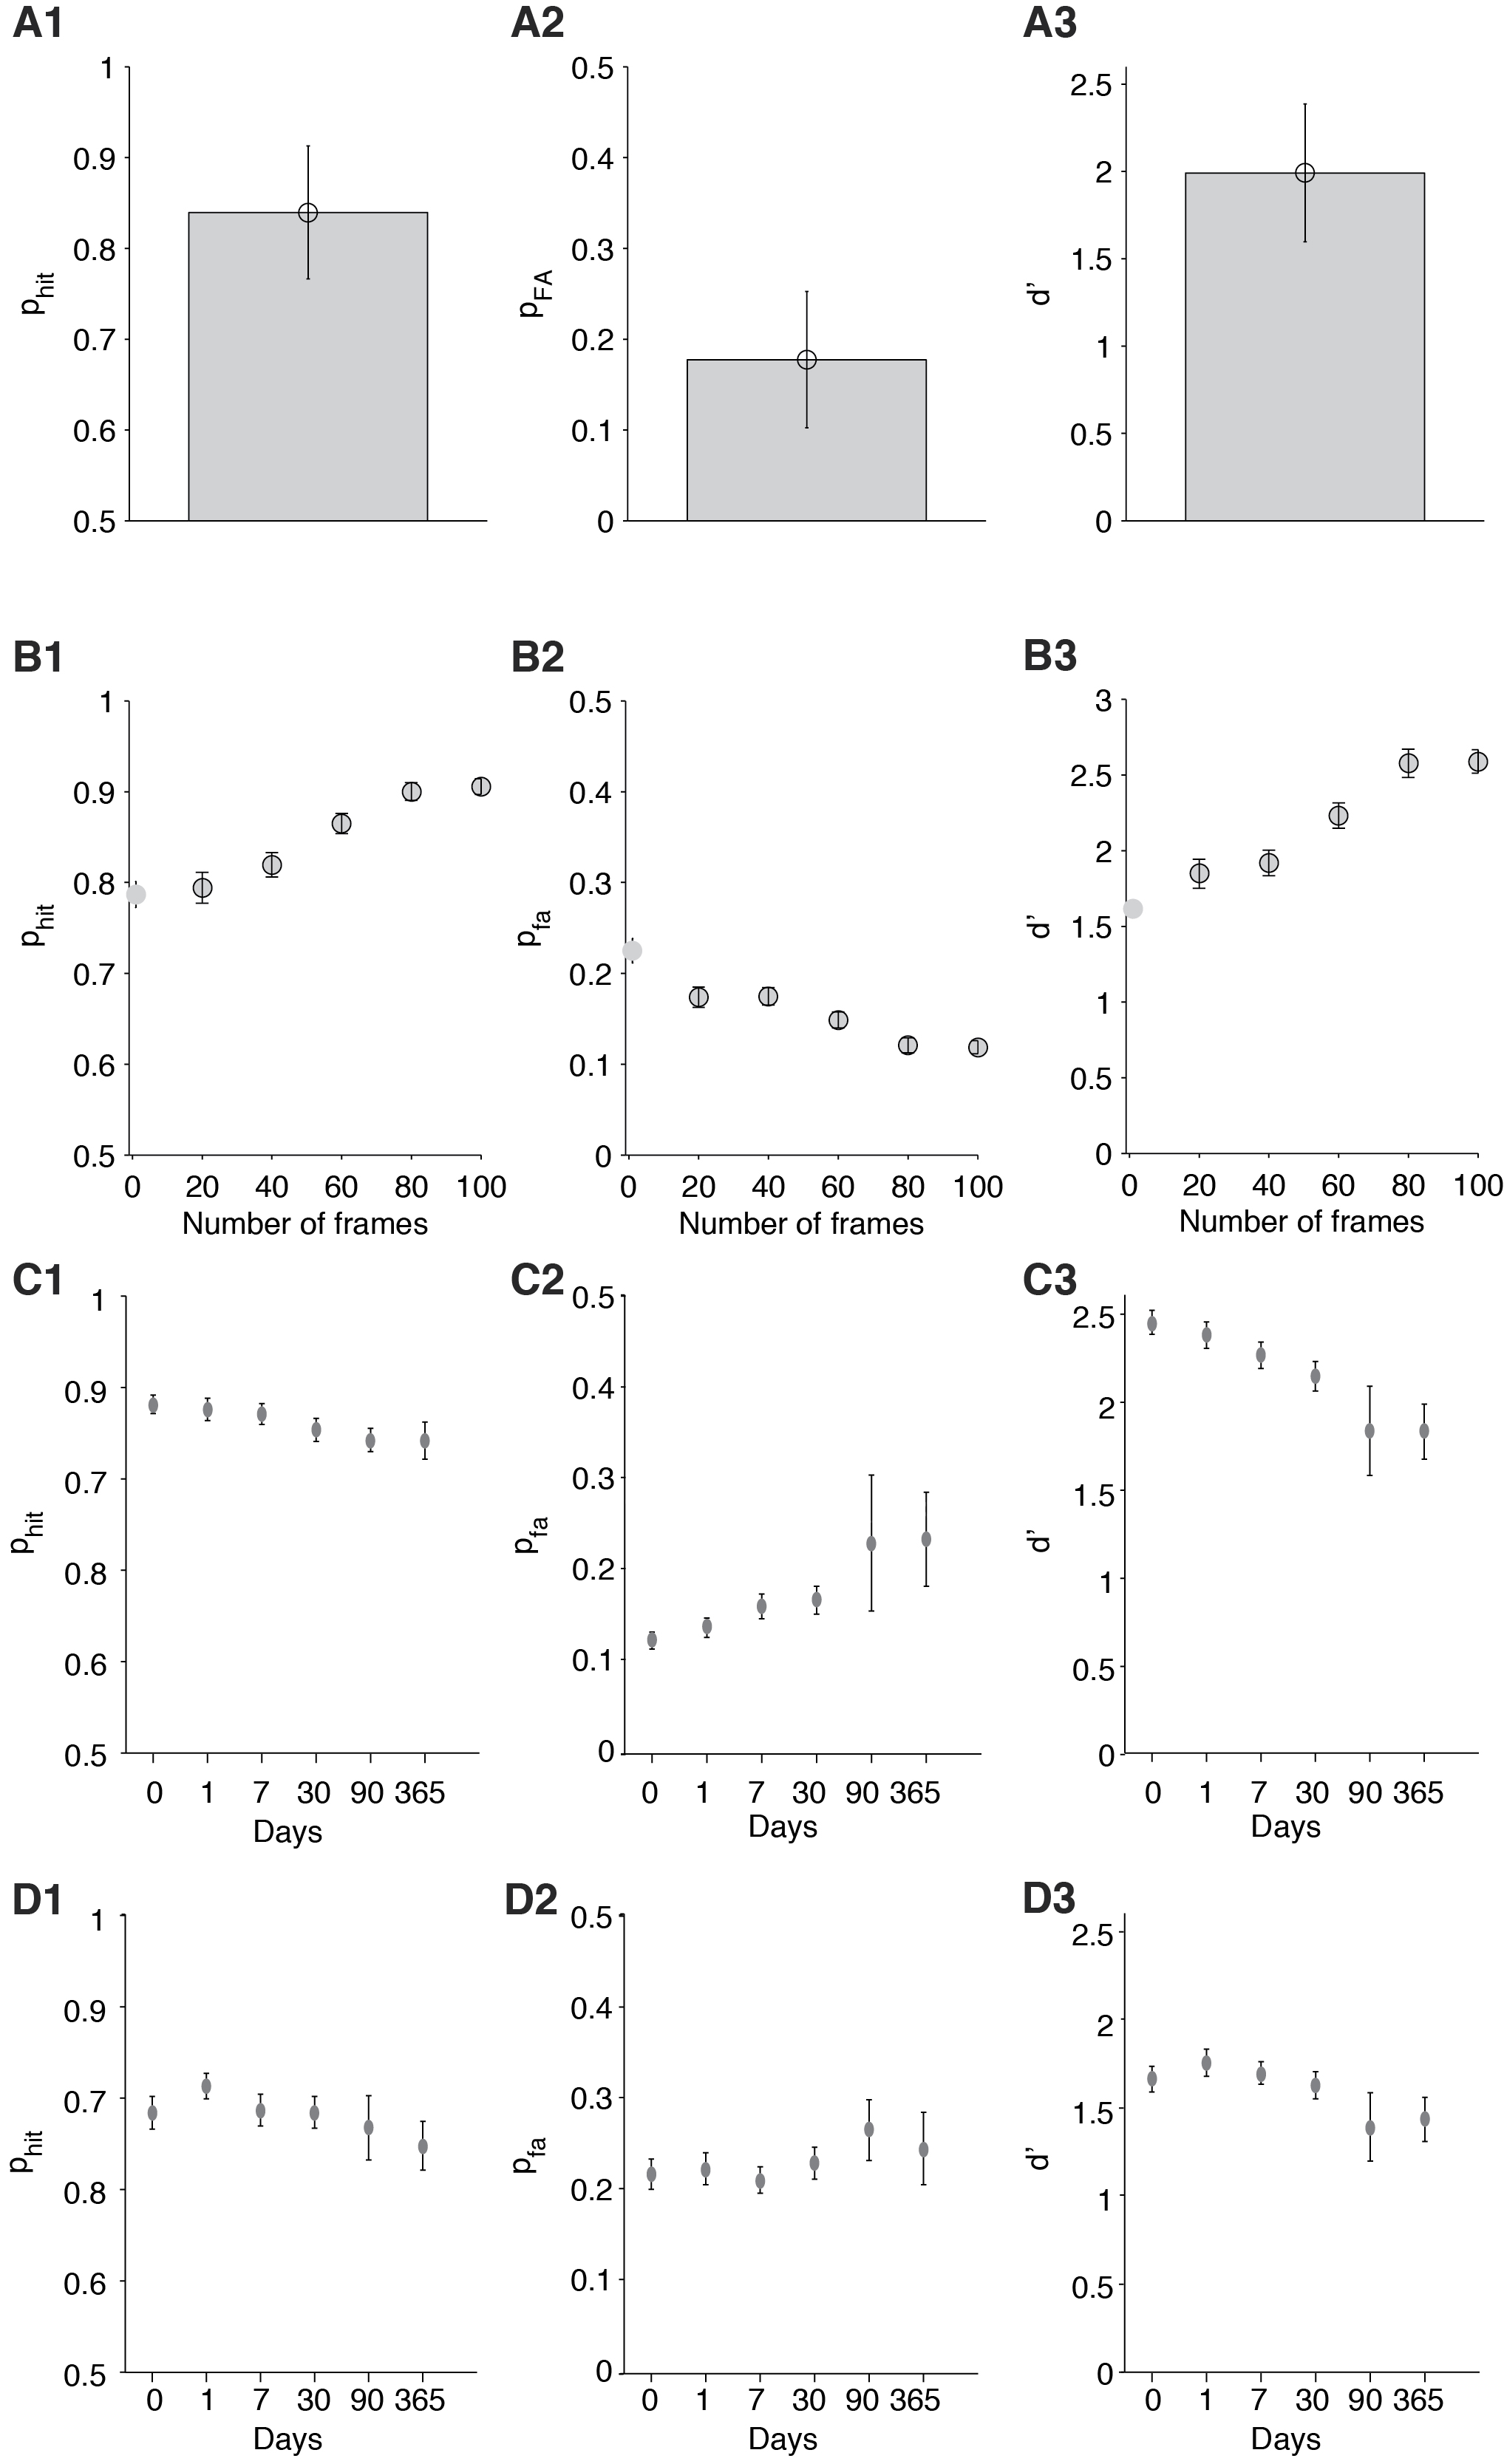
Figure W5 (expanding on Figure 2 in the main text): Performance increases with the number of frames and decreased with elapsed time after encoding. A. Overall performance (mean±SD, n=41 subjects) showing probability of hits (phit, A1), probability of false alarms (pfa, A2) and d' (A3). B. Performance increased with the number of frames in the shot. Bin size = 30 frames; results are shown in the center of each bin. C. Performance for shots decreased with elapsed time after encoding. Note that the scale on the x-axis is not linear in time (test points are shown at equidistant intervals along the x-axis). D. Same as C, showing performance for individual frames.