

Robustness
to two-object images in human visual cortex
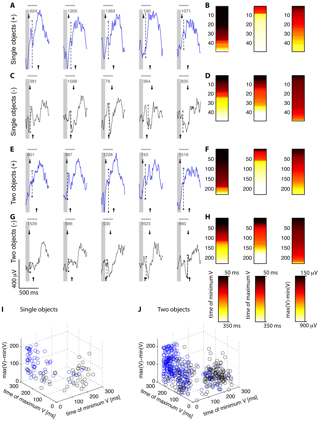
Figure W4: Decoding object information
in cluttered images in single trials
 Decoding object information in
cluttered images in single trials. A, C, E, G. Five
examples of single-trial responses for the electrode shown in Figure 1 in
the main text (see scale bar at the bottom left of part G). The gray vertical bar shows
the stimulus presentation interval (100 ms). The single-trial examples were
taken from the single-object images including the preferred category (A),
single-object images excluding the preferred category (C), two-object images including the
preferred category (E) and two-object images excluding the preferred category (G). The
number in each subplot indicates the trial order number. For each trial, we
considered the interval between 50 ms and 300 ms after stimulus onset (gray
horizontal bar above each plot) and extracted three features: the range of the
response (dotted lines), the time of minimum voltage (tmin, downward arrow) and the
time of maximum voltage (tmax, upward arrow). B, D, F, H. Response vectors for each of the three
features and each of the four image types (A, C, E, G). The subplot on the left shows the
time of minimum voltage, the middle plot shows the time of maximum voltage and
the subplot on the right shows the IFP response magnitude (see color scale bars
at the bottom). Each row in these response vectors denotes a single trial. I,
J. These 3D plots show the relationships among the 3 feature
variables used for the classification task for single-object images (I) and
two-object images (J). The blue circles indicate images where the preferred category
for this electrode was present and the black circles indicate trials where the
preferred category for this electrode was not present. Training the classifier
involves finding a plane to optimally separate the blue and black circles
(Experimental Procedures).
Top