

Robustness
to two-object images in human visual cortex
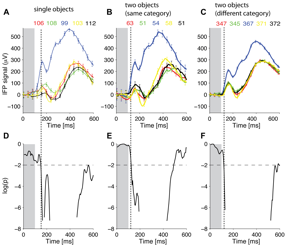
Figure W8: Definition of response
latency
 We discuss two
definitions of response latency in Figure 4. Here we illustrate the computation of
latency based on “Definition 2”. At each time point, we performed a one-way
ANOVA to assess whether the variance in the IFP signal across categories was
significantly different from the variance in the IFP within a category. The
response latency was defined as the first time point where 15 consecutive bins
yielded p<0.01
in the ANOVA analysis. Here we show the responses and latency analyses for the
same electrode illustrated in Figure 1.
A. Responses to
single object images. Each color corresponds to a separate object category (see Figure W01). On the top, we show the number of
repetitions averaged in each curve. Error bars indicate one SEM (shown in one
every 10 points for clarity). The gray rectangle denotes the image presentation
time. The dotted line indicates the latency as determined in part D.
B. Responses to
images containing two objects from the same category.
C. Responses to
images containing two objects from different categories.
D-F. Point-by-point log10 of the p values obtained in the one-way ANOVA. The y-axis was cut at log10(p)=-8 for
illustration purposes. The vertical dotted line indicates the latency.
Top