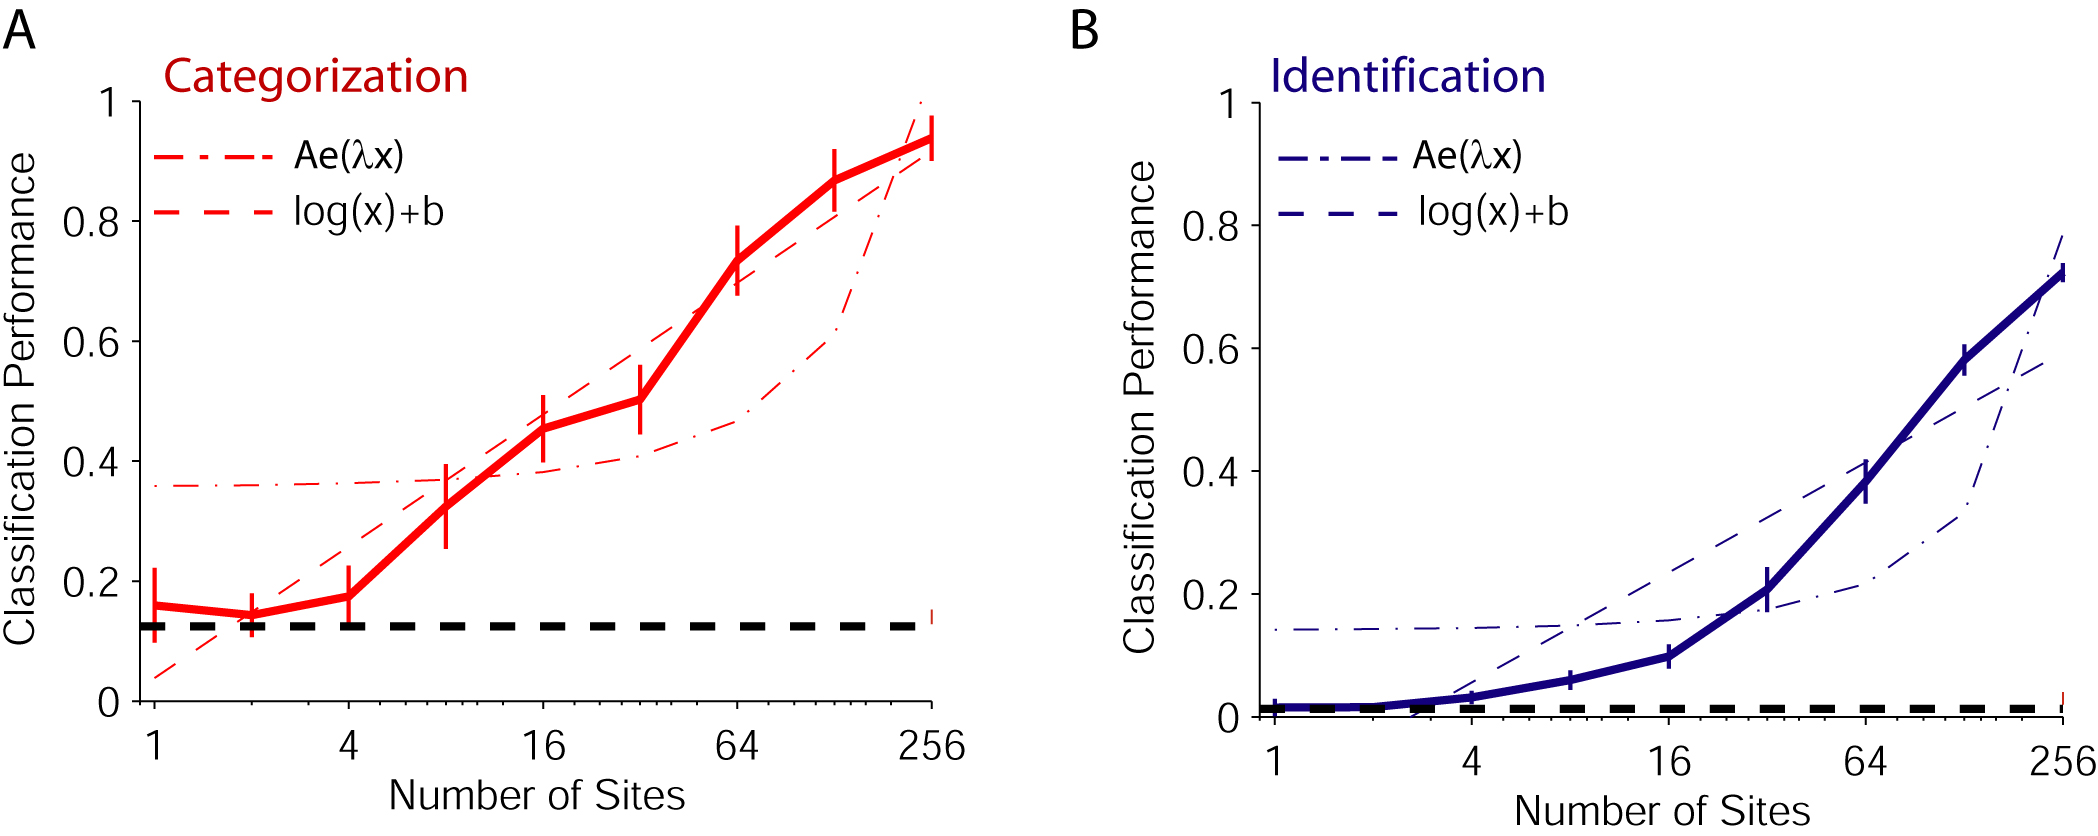
TopClassifier performance versus number of sites with fits
Performance of the classifier as a function of the number of sites for categorization (left) and identification (right) including an exponential fit to the data (dash-dotted line) and a logarithmic fit (dashed line). Note that the x scale is logarithmic in these plots.
Parameters
MUA, [100;300) ms interval, bin size = 50 ms