TopPattern of mistakes made by the classifier
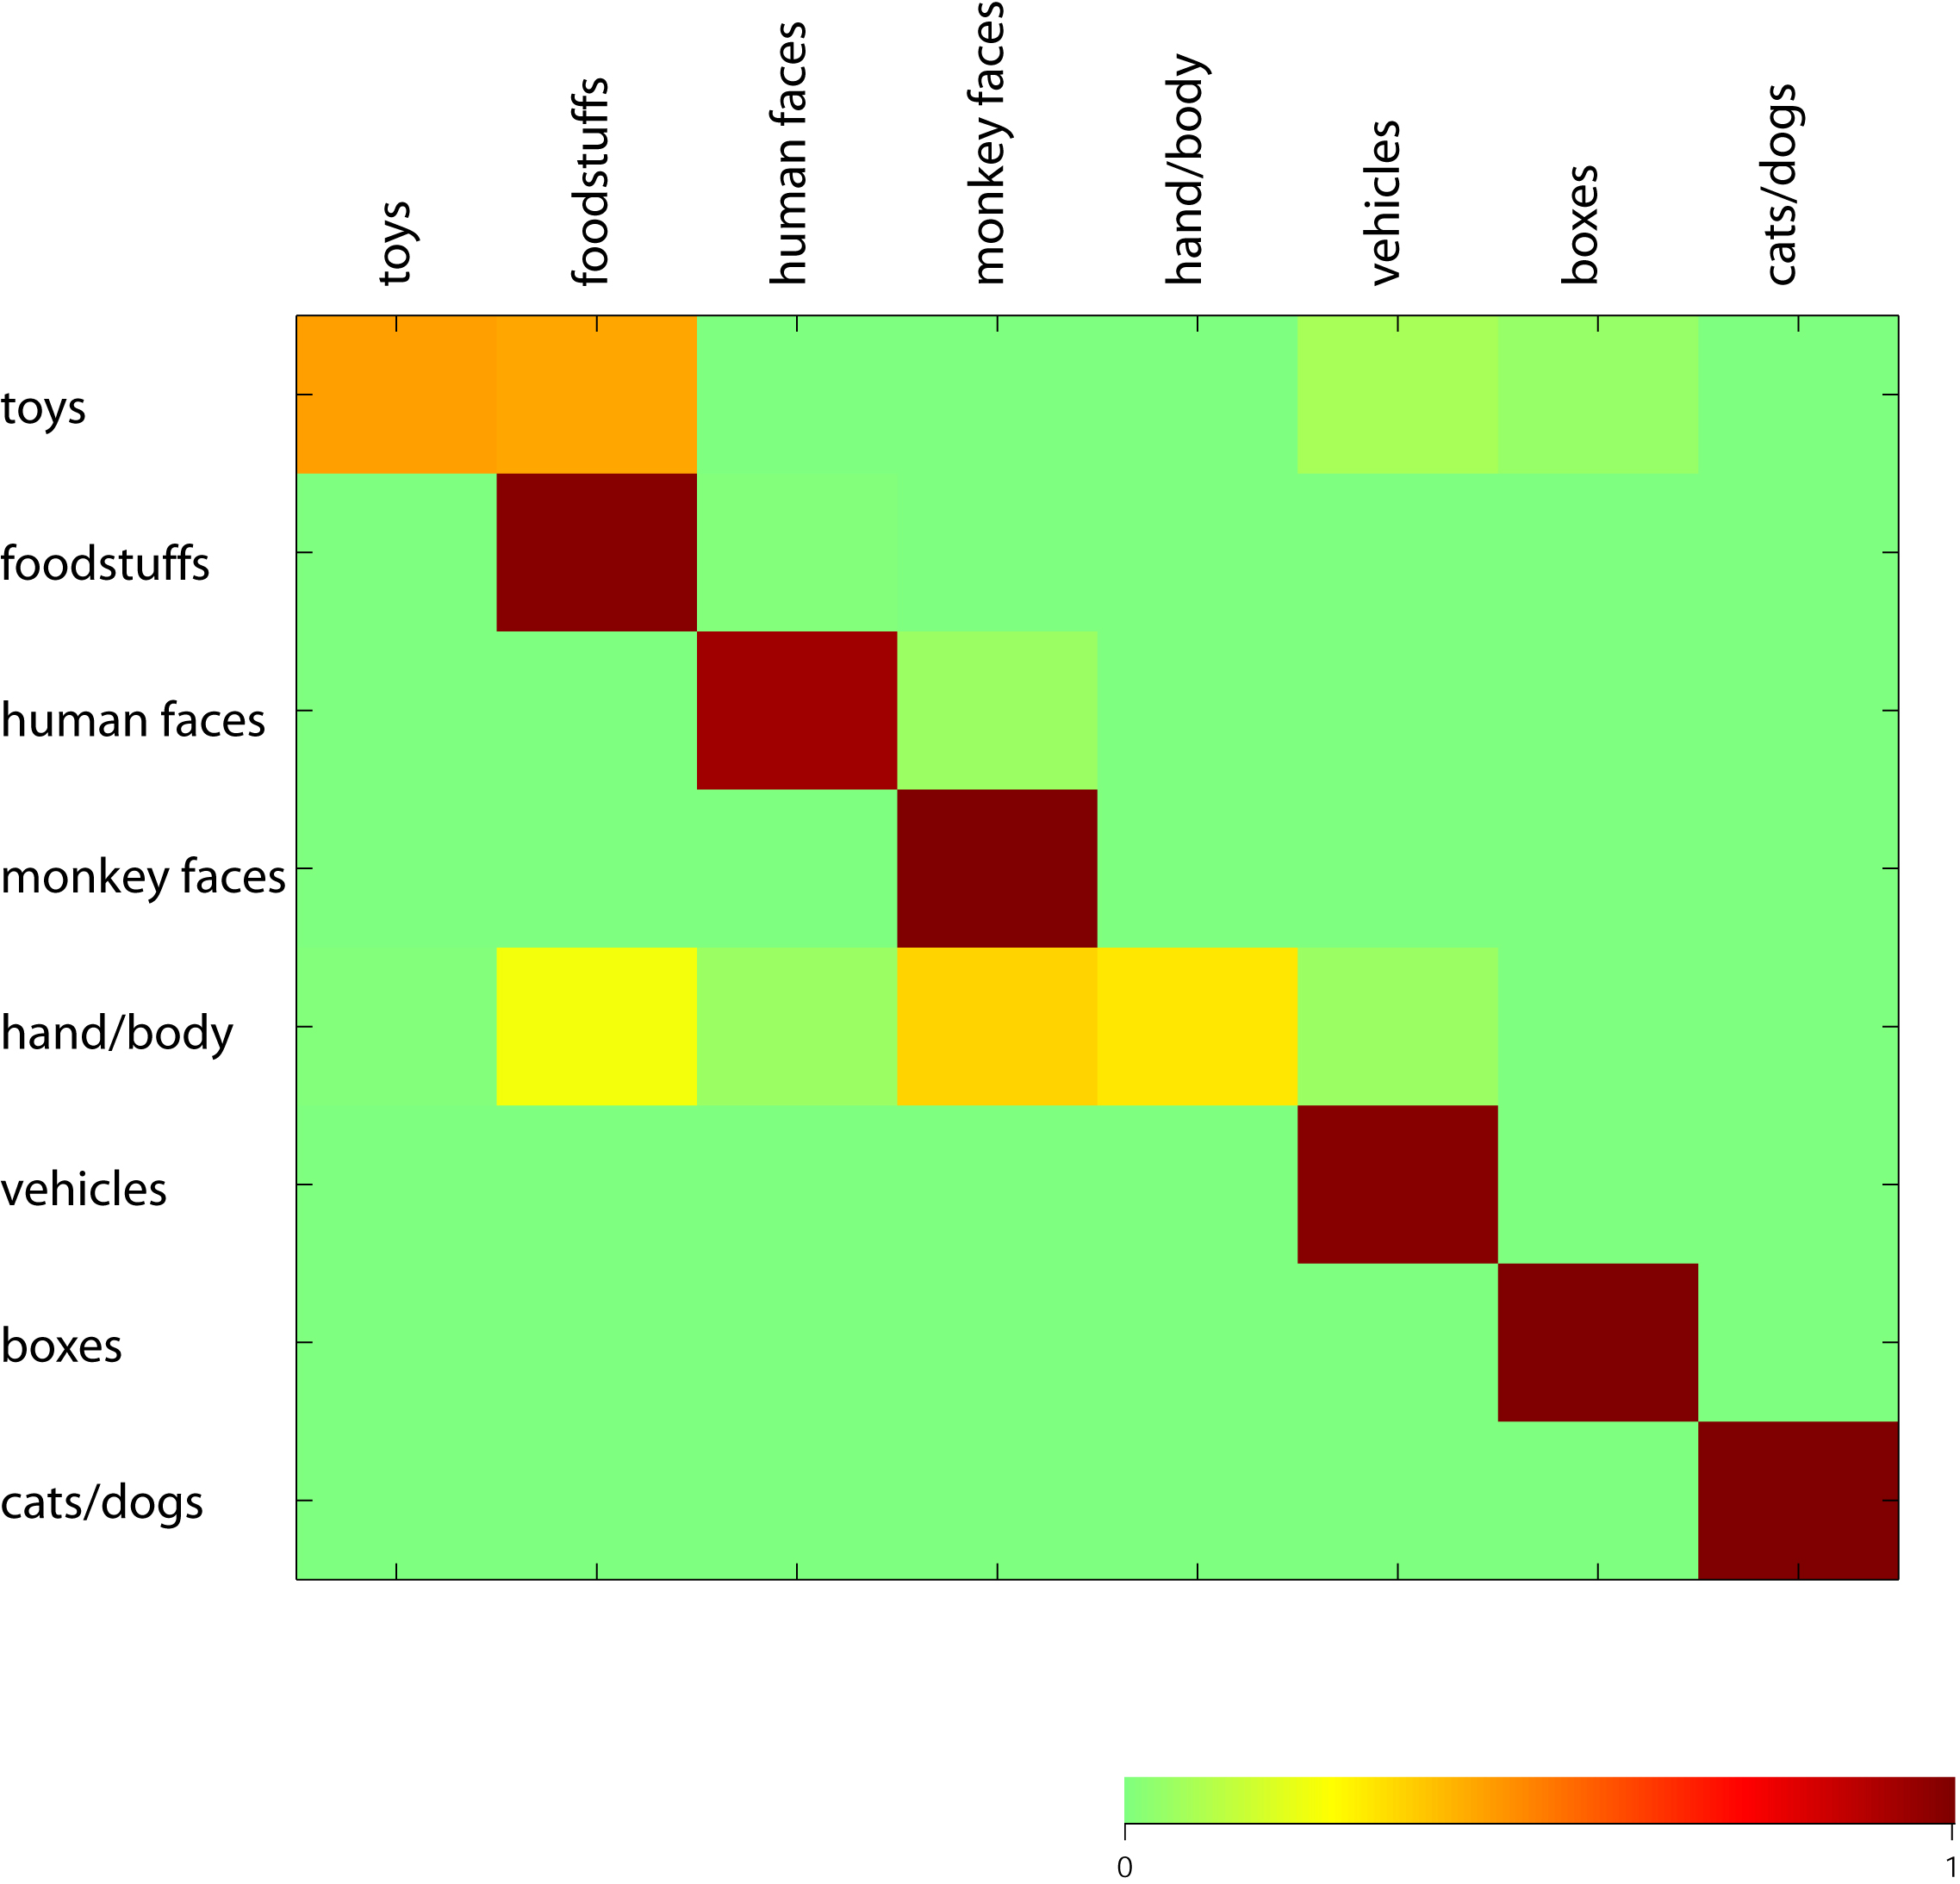
This confusion matrix describes the pattern of mistakes made by the classifier. The color table shows the actual group presented on the monitor to the monkey on the left and the classifier predictions on the top. The table shows (in color code) the proportion of cases where a given category was confused by another category (see color scale below main plot). If all entries were 1 along the diagonal and 0 elsewhere, this would mean that the performance of the classifier is perfect. If all entries showed a uniform color (corresponding to 1/8) then classifier performance would be at chance. Note that the performance of the classifier is better for some groups (e.g. monkey faces) than for others (e.g. toys). Classifier parameters: MUA, n=256 sites, [100;300) ms interval, bin size=50 ms.
Parameters
signal = MUA, number of sites = 256, time interval = [100;300), bin size = 50 ms