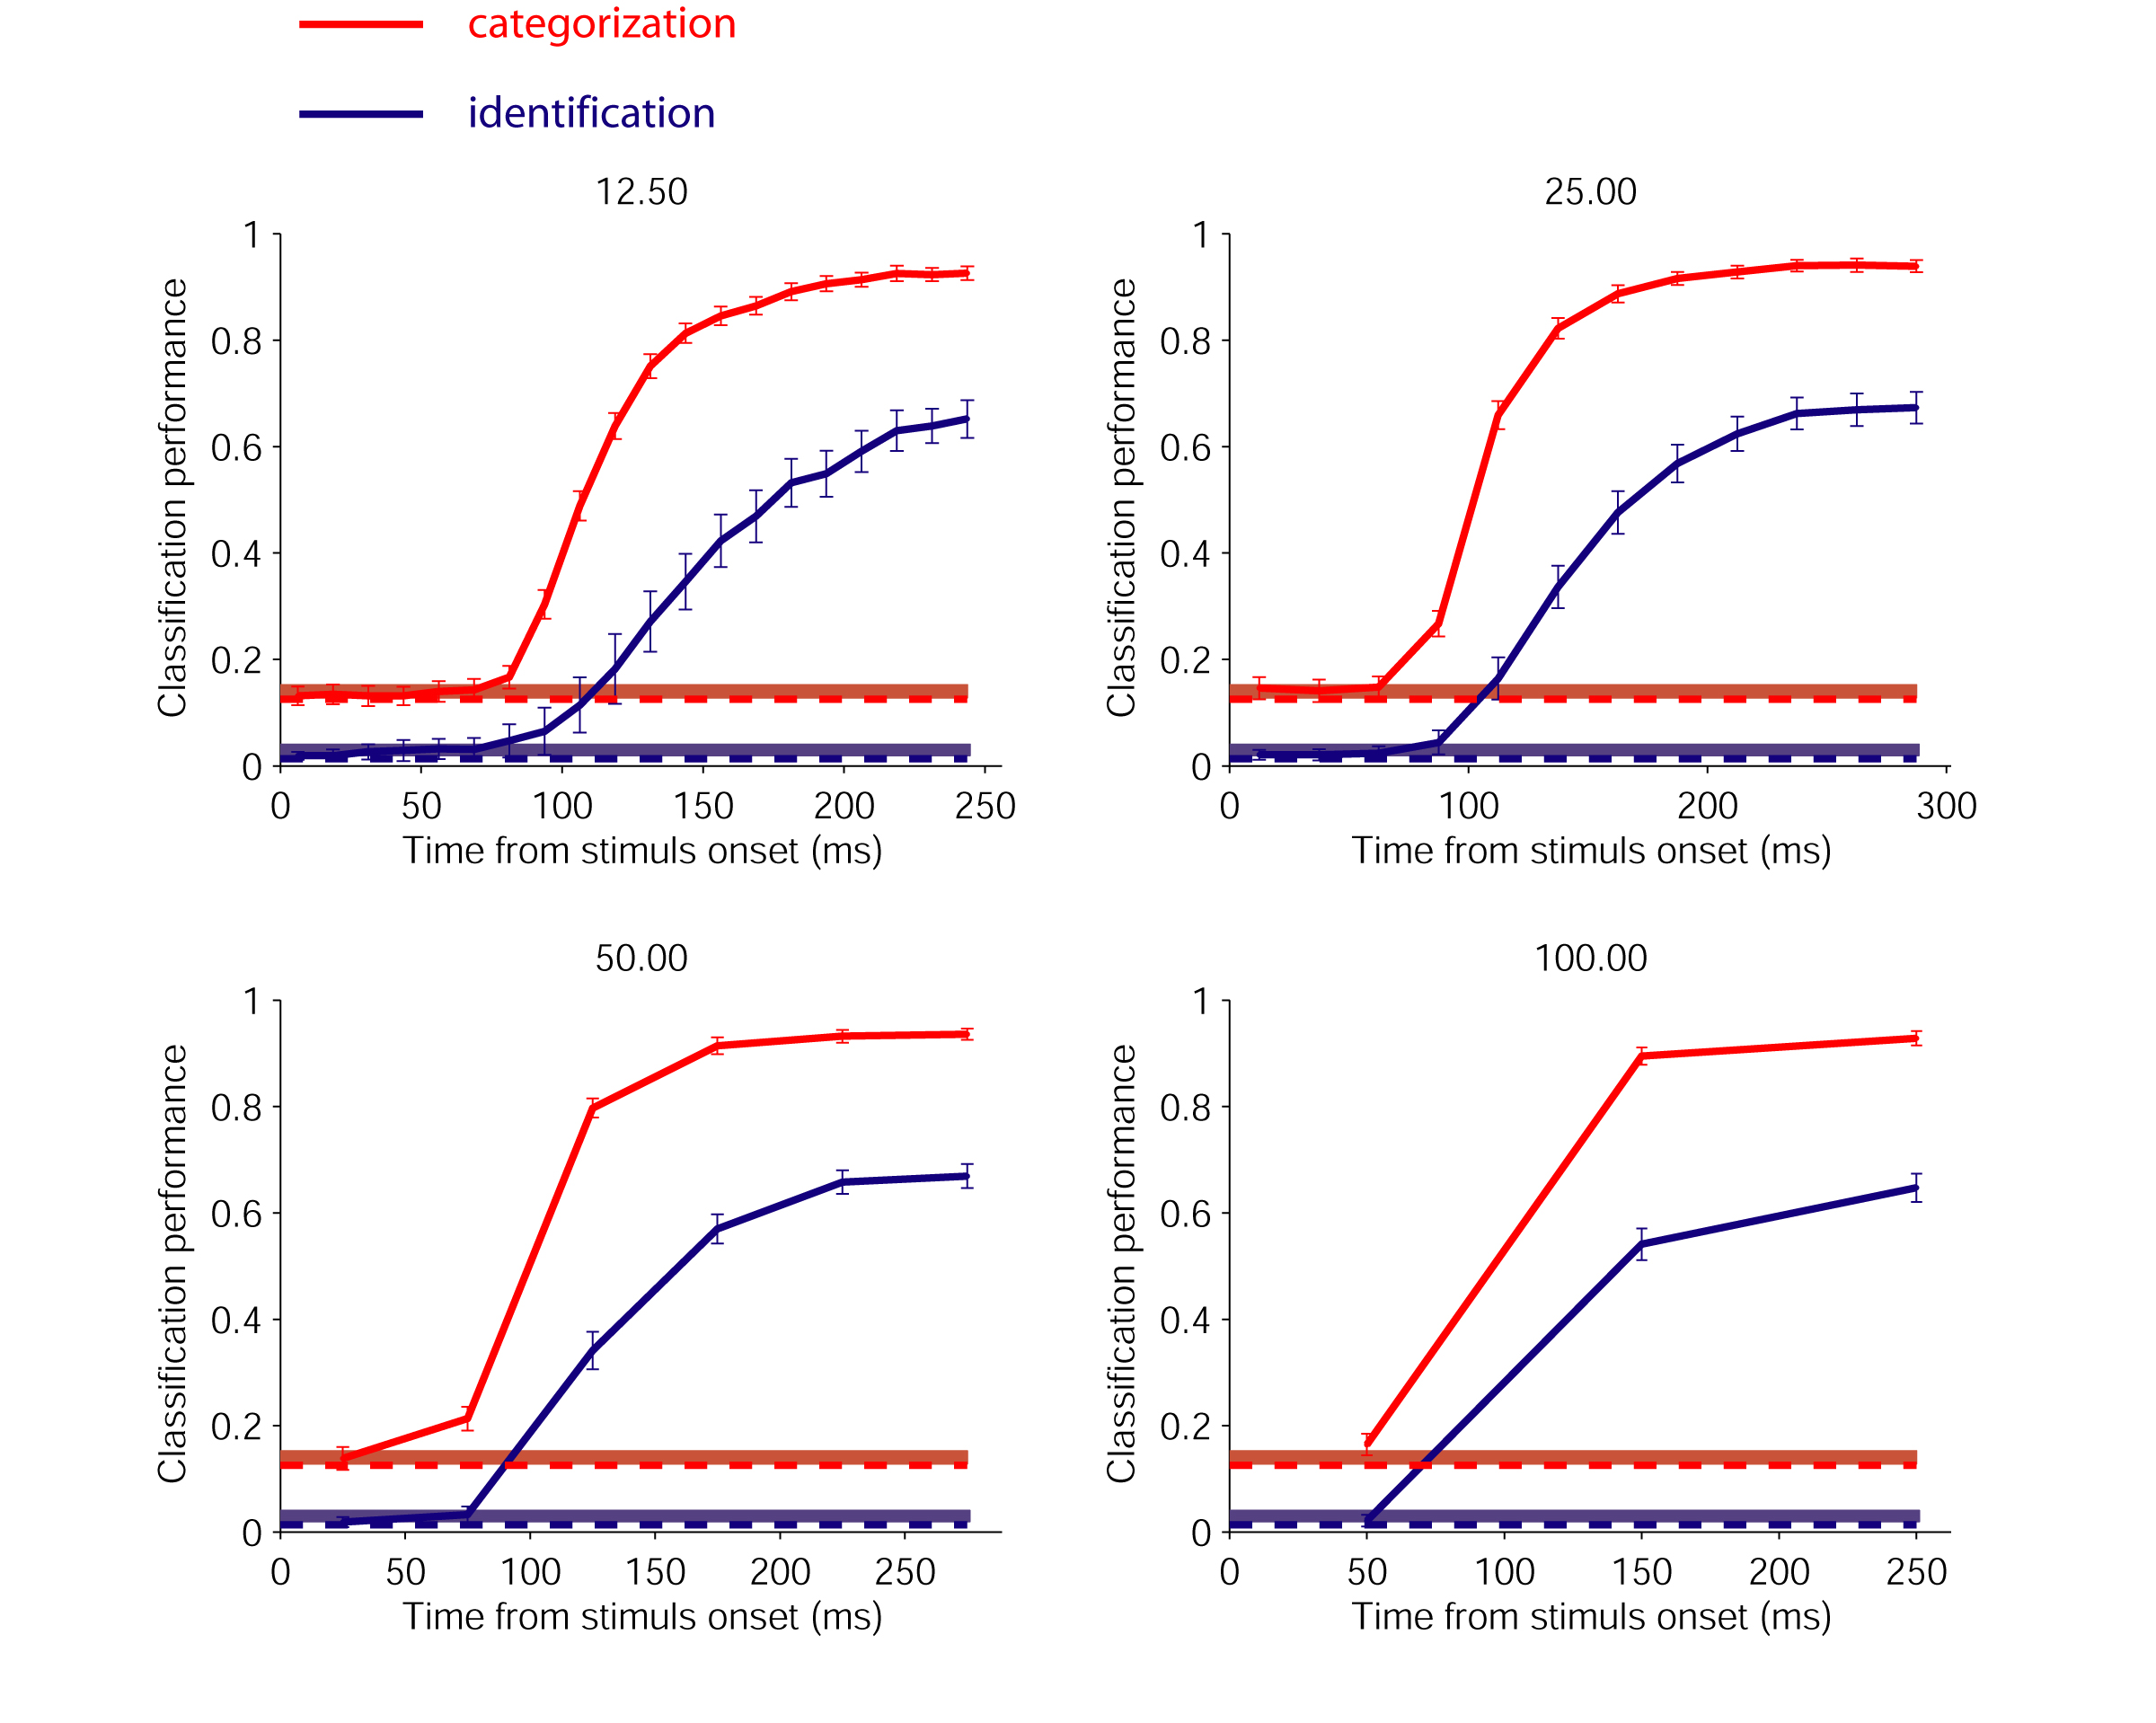
TopLatency of categorization versus identification
Classifier performance as a function of cumulative time from stimulus onset for classification (red) and identification (blue). Bin size = 12.5 ms, 25 ms, 50 ms and 100 ms. The performance values are shown in the center of the corresponding bin. Number of sites = 256. Error bars = s.d. for 20 random choices of sites. The dashed line shows the chance performance levels (1/8 for classification and 1/77 for identification). The red and blue areas near the dashed lines show the range of performances for the 100 ms time interval before stimulus fonset.