TopSpike sorting - Separation of single units and multi-units
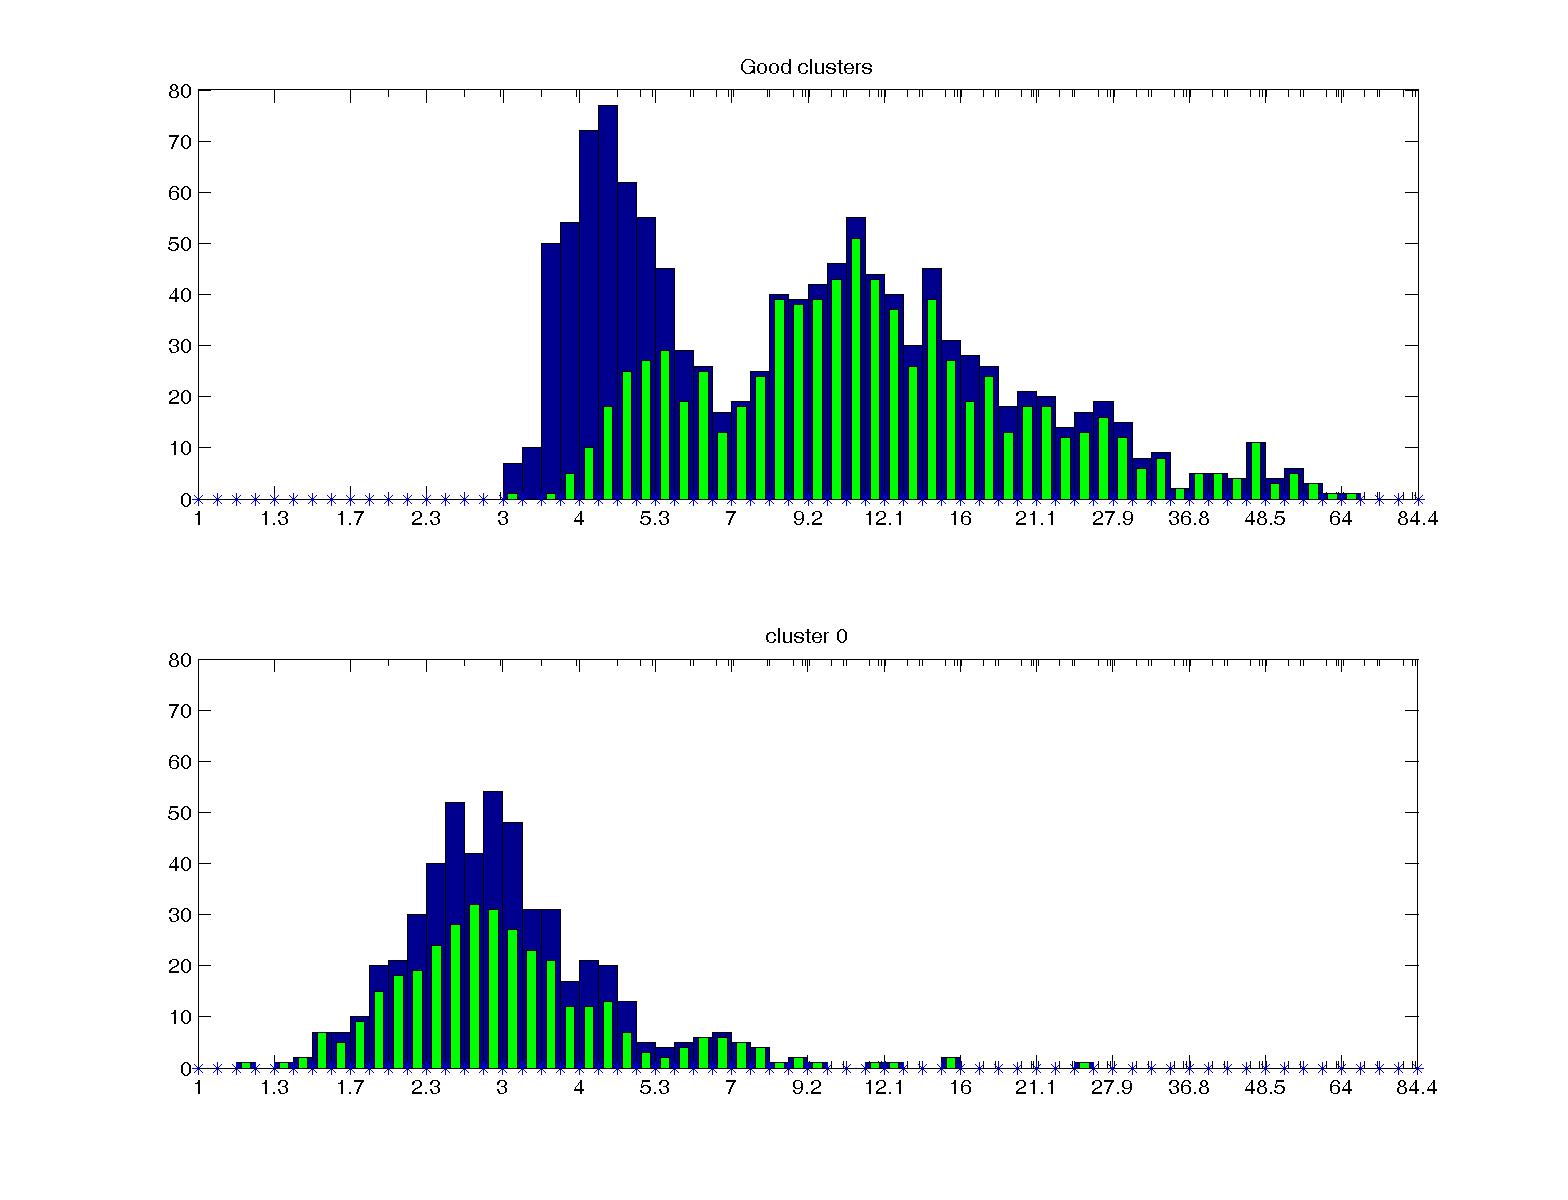
Histogram of number of clusters (y-axis) with given levels of signal to noise ratio (x-axis) for MUA (blue) and SUA (green, clusters not
containing spikes separated by less than 2 ms). Well separated ('Good') clusters are shown at top and the remaining poorly-separated
cluster ('Cluster 0') is shown at bottom. For our analysis, MUA included spikes from blue bins in both top and bottom plots, and SUA
included only spikes from green bins in top plot."
Note: the analysis was done by Alexander Kraskov and Rodrigo Quian Quiro