

Robustness
to two-object images in human visual cortex
Figure W1: Stimuli and stimulus
presentation scheme
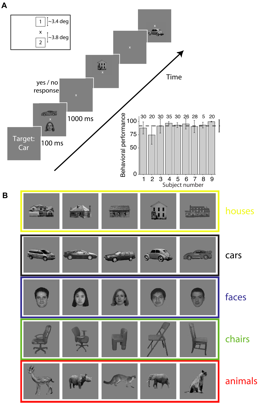
 Figure W1: Schematic description of the experimental
paradigm. A. The experiment
was divided into blocks, with 50 image presentations per block. At the
beginning of each block, a target category was announced by visually presenting
the category name (in this example, “Car”). Subjects had to indicate whether
each image contained an object belonging to the target category or not by
pressing pre-assigned mouse buttons. There was no correct/incorrect feedback.
Each image contained either one object (~30% of the trials) or two objects
(~70% of the trials). Objects subtended ~3.4 degrees of visual angle. The
object center was presented at ~3.8 degrees eccentricity (both for
single-object images and two-object images) at one of two possible positions:
above/below the fixation point or left/right of the fixation point (in the
first three subjects, we used all four positions, see Experimental Procedures).
The inset on the top left shows the position of the two objects on the screen
with respect to the fixation point (“x”). Each image was presented for 100 ms,
with a 1000 ms gray image interval in between trials. The position of each
object as well as the presentation order was randomized. The inset shows the
proportion of correct trials for each of the 9 subjects (mean±s.d.). The total
number of blocks is indicated for each subject. Overall, behavioral performance
was 92±12% correct (horizontal dashed line) and the reaction times were 630±90
ms. B. Objects were
grayscale and contrast normalized and belonged to one of five possible
categories: houses, cars, human faces, chairs and animals. Here and throughout
the manuscript, each object category is represented by a different color. There
were 5 exemplars in each category.