

Robustness
to two-object images in human visual cortex
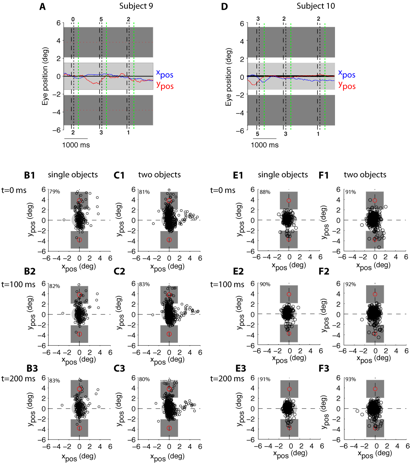
Figure W6: Eye-tracking data (two
subjects)
 In two subjects we were able to track eye movements
using a non-invasive system from ISCAN (DTL-300, Woburn, MA) which provides a
spatial resolution of ~1 deg and a temporal scanning frequency of 60 Hz.
A, D.
Sample eye tracking data as a function of time showing three consecutive
trials. The blue curve shows the horizontal position of the eye (xpos)
and the red curve shows the vertical position of the eye (ypos). The
horizontal line at position 0 indicates the fixation point. In each trial, the
vertical black dashed line denotes the onset of the image, the vertical black
dotted line denotes the offset of the image and the vertical green dotted line
denotes the end of the main time window used throughout the analyses (i.e. 300
ms after image onset). The dark gray rectangles show the position of the two
objects within the image. The light gray rectangle shows the ±1.5 deg fixation window. The number at the top
(bottom) shows the category of the object above (below) the fixation point. In
the first trial, there was only a single object (category 2) presented below
the fixation point. B-F. Eye positions for all the trials with single objects (B1-3, E1-3) and
all the trials with two objects (C1-3, F1-3) at three different time points (t=0 ms,
100 ms and 200 ms). Each point indicates the x and y position of the eye in a
separate trial. In <5% of the total number of trials, the eyes were outside
the 6 deg by 6 deg window shown here (almost invariably these trials involved
head movements or eye blinks). The dashed lines cross at the fixation point.
The dark gray squares show the position of the objects; the red circles denote
the object centers. The light gray circle shows the ±1.5
deg fixation window (mostly occluded by the eye position circles). On
the top left corner of each plot, we indicate the percentage of trials where
the eye was within the fixation window. In contrast to the relatively high
fixation rates indicated here, fixation rates were lower after t=300 ms (e.g.
at t=500 ms, the percentage of trials within the
fixation window was 60% and 63% for single-object images and two-object images
respectively).
Top