Figure
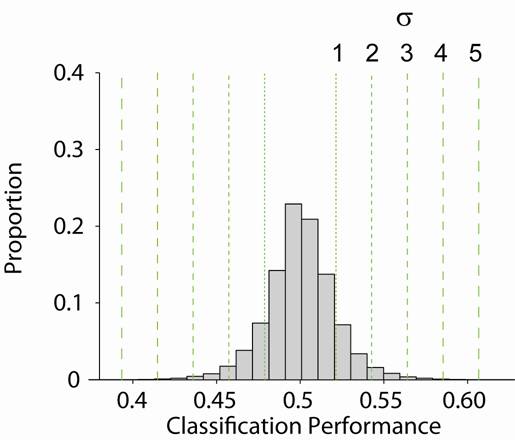
S5: Classification performance values under the null hypothesis
In
order to assess whether a given classification performance value was
statistically significant or not, we compared the values against those obtained
from the null hypothesis. The null hypothesis states that there is no
statistically significant difference across the different object categories.
The performance level under the null hypothesis was obtained by randomly
shuffling the object categories (n=100 iterations) and repeating the same
training/testing procedure used with the real data. Here we show the distribution
of classification performance values obtained under the null hypothesis (bin size=0.01).
The multiple green vertical dashed lines indicate 1 through 5 standard deviations.
Throughout the text, we used 0.57 as the threshold for statistical
significance. This value corresponds to a difference of 3 standard deviations
from the null hypothesis.