Figure
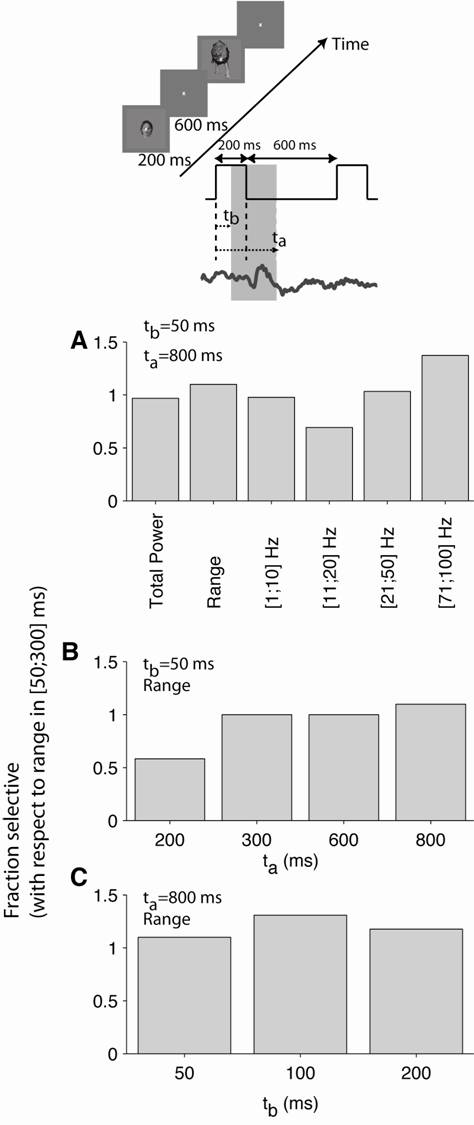
S8: Neural codes and classifier input
Classification performance for different IFP response
definitions. The inset on the top shows the
definition of the analysis windows [tb,ta]
where the times are defined with respect to the image onset. A. Comparison among different IFP response definitions: total power,
range and power in different frequency bands. The y axis shows the relative number
of selective electrodes with respect to the values reported in the text (which correspond
to the range in the [50;300) ms window. The high gamma
frequency band (71 to 100 Hz) yielded a higher number of selective electrodes. B.
Relative fraction of selective electrodes as a function of ta,
the end time for the analysis window (for a fixed tb=50 ms). C. Relative fraction of selective electrodes as a function of tb,
the start time for the analysis window (for a fixed ta=800 ms; see Supplementary Methods for
details).