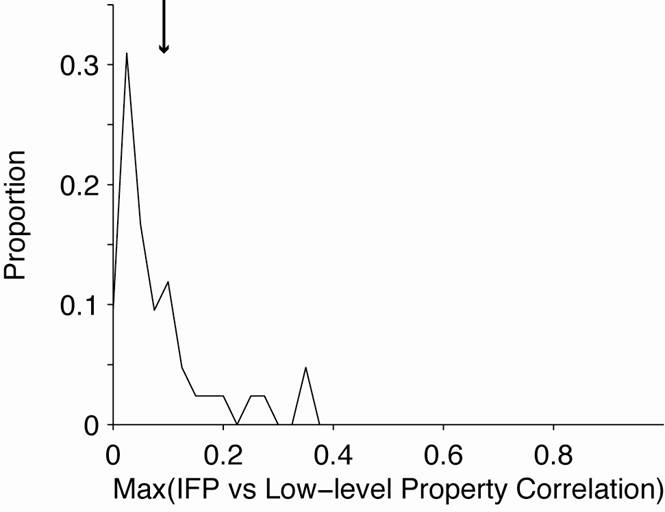
Figure
S9: Correlation with basic image properties
To
quantify the extent to which the IFP responses could be explained by low-level characteristics
of the images, we considered a list of 15 basic image properties: mean pixel
grayscale value, standard deviation of the pixel grayscale values, median of
the pixel grayscale values, minimum pixel grayscale value, maximum pixel
grayscale value, number of pixels different from the background gray, number of
pixels below the background gray, number of pixels above the background gray,
number of very dark pixels (grayscale value < 64), number of very bright
pixels (grayscale > 192), number of gray pixels, number of boxes above
background gray (box size = 20 pixels), number of boxes below background gray,
number of very dark boxes (mean intensity within the 20x20 pixel box < 64),
number of very bright boxes (mean intensity within the 20x20 pixel box >
192). For each electrode (n=912), and each image property (n=15), we computed
the Pearson correlation coefficient between the IFP responses to each image and
the corresponding property for each image. We considered the property that
yielded the maximum correlation (that is, the image property that accounts for
most of the variance in the IFP signals for that electrode). Here we show the
distribution of the Pearson correlation coefficients for all the electrodes.
Bin size = 0.02, the thick bar shows the average.