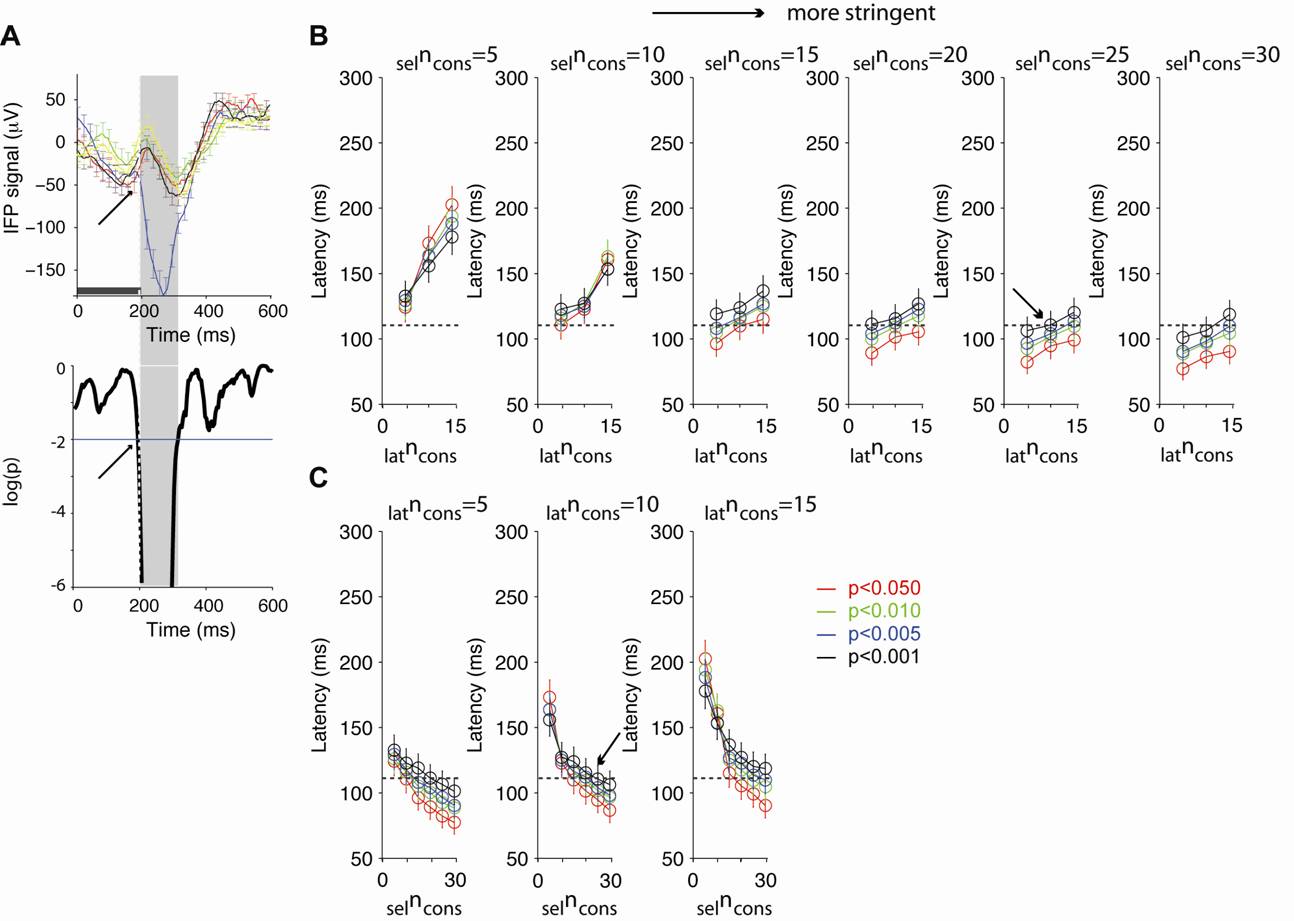
Figure
S15: Definition of latency and parameter dependency
A.
We followed the definition of latency used in Thorpe et al., 1996. At each
time point, we computed a one-way ANOVA on the IFP signals across object
categories. For the example electrode shown in the top part (same electrode
shown in Figure 1F),
we show the point-by-point p values
in the bottom figure (in log scale). An electrode was defined as “selective” if
there was a period of selncons = 25 consecutive time points (bin size = 2 ms) with p<0.01.
The response latency was defined as the first time point where latncons 10 consecutive points yielded p<0.01.
The latency for this electrode is indicated by an arrow and the shaded area
shows the interval of consecutive points where p<0.01.
The y-axis was cut at log(p)=-6 for graphic purposes; the log(p) values between ~200 and ~300
ms were below -6. The distribution of latency values for all the selective
electrodes is shown in Figure 3A in
the main text. B, C.
Dependence of the mean latency on latncons, latncons and p value
threshold. The horizontal dashed line shows the mean value reported in
the text (the mean of the distribution in Figure 3A which corresponds to the parameters indicated by the arrow
in the fifth subplot). The color corresponds to the p value thresholds (red: 0.05, green: 0.01, blue: 0.005,
black: 0.001). The error bars correspond to one SEM of the corresponding
distribution across electrodes.