Figure
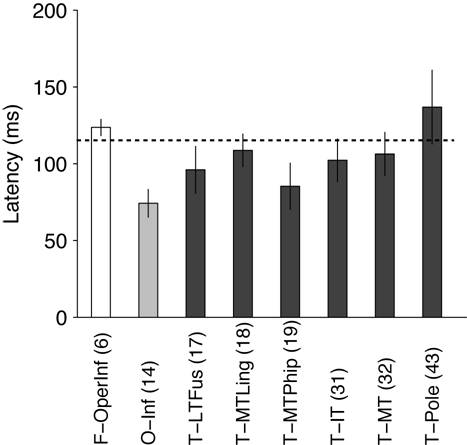
S16: Latencies for locations with selective electrodes
The
distribution of latencies shown in Figure 3A in the main text includes all the selective
electrodes. Here we show the mean latencies for those electrodes in each location
where there were at least 5 selective electrodes. The horizontal dashed line indicates
the mean value reported in the main text. The numbers in parenthesis indicate the
“area code” for each location. The location names, codes and Talairach
coordinates are indicated in Table S2. Frontal lobe locations are shown in
white, occipital lobe locations in gray and temporal lobe locations are shown
in black (there was no location with >5 selective electrodes in the parietal
lobe). Error bars are SEM.