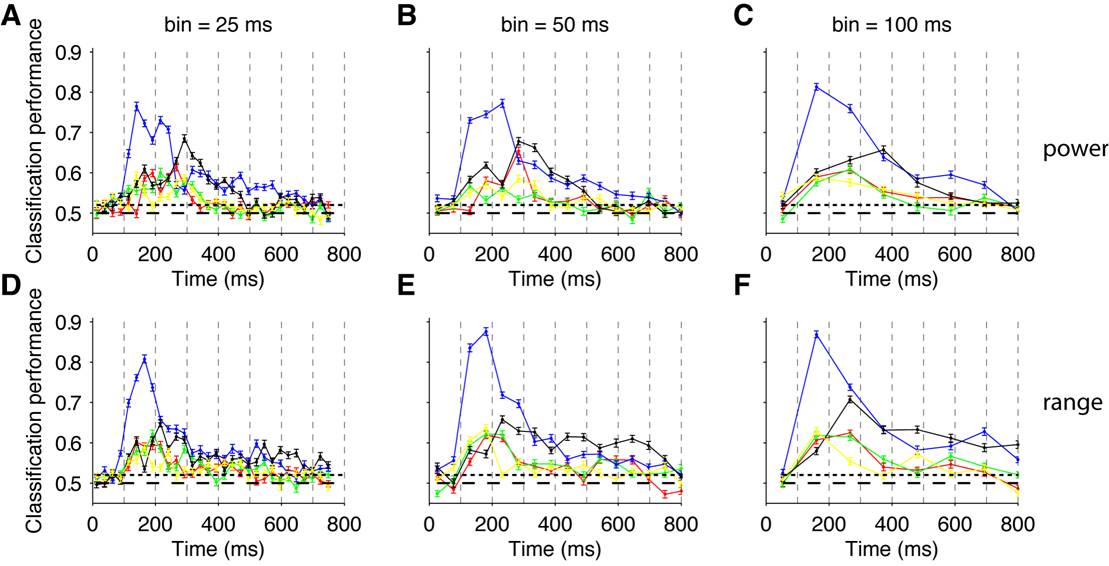
Figure S17: Fast decoding of object category
Classification performance as a function of time
from stimulus onset. Each color corresponds to
an object category (red=animals, green=chairs, blue=faces, black=fruits, yellow=vehicles). Here the classifier was trained using individual bins of size ô (A, D. ô=25 ms, B, E. ô=50 ms, c, f. ô=100 ms). In A-C, we used the power of the IFP signal in each bin whereas in D-F we used the range of the IFP
signal in each bin. The horizontal dashed lines denote the chance performance
value of 0.5 and the significance threshold value (note that this threshold is
different from the one in Figure S5 because we are using a much smaller window here). The vertical
dashed lines mark 100 ms intervals to facilitate visualizing the dynamics of
the responses. The average across all the categories in part B is reported in Figure 3B in the main text.