Figure
S18: Responses to all objects/transformations for the electrode in Figure 4
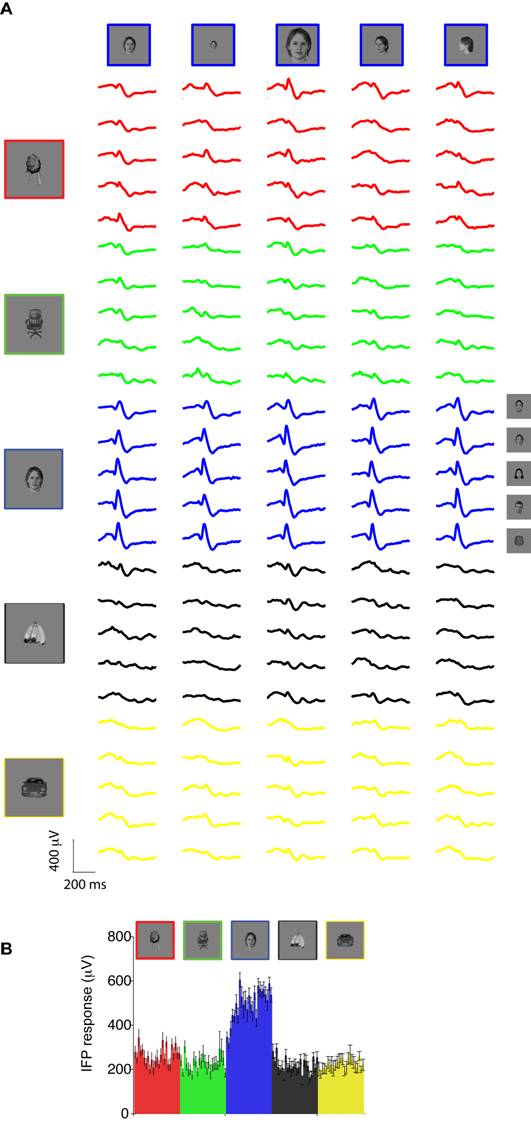
A. Expanding on the presentation in Figure 4, here we show the
IFPs of the same electrode to all the objects (each row corresponds to a
separate object) and transformations (each column corresponds to a separate
transformation). The top row shows an example of the transformations for only
one of the objects. Columns 2 and 3 correspond to two scaled versions (visual
angle of 1.5 degrees and 6 degrees respectively) of the standard image (visual
angle of 3 degrees) and columns 4 and 5 correspond to two rotated versions of
the original image (~45 and 90 degree rotation). Object category is indicated
by the response color. The strong response and invariance across objects and transformations
shows that the results are not due to selectivity or robustness for one particular
exemplar object only. B. Average
response to each object and transformation. Same data as in part A,
showing a single response value for each electrode (signal range in the
interval from 50 to 300 ms).