Figure
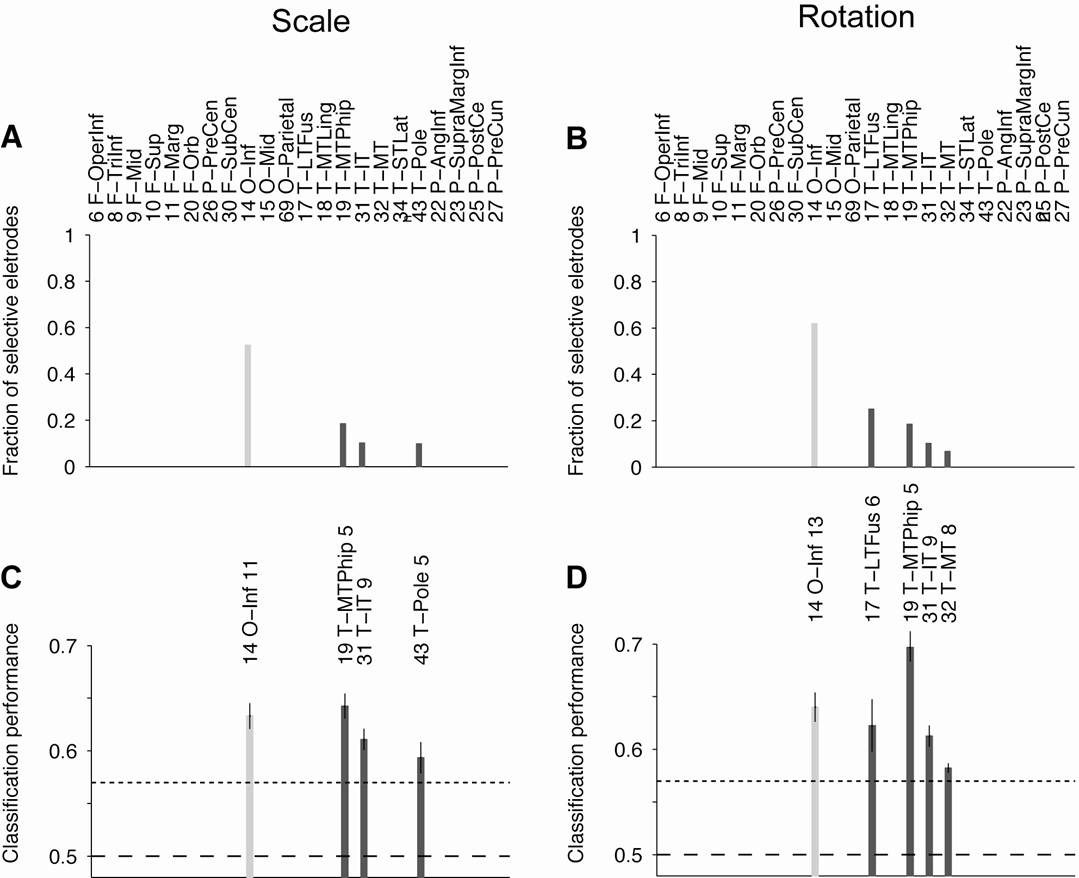
S20: Location of individual electrodes showing invariance
A,
B. Fraction of electrodes showing invariance to scale changes
(A) or rotation changes (B). C, D.
Mean classification performance for each location with at least 5 electrodes showing
invariance to scale (C)
or rotation (D). The number next to the location descriptor indicates the “area code” in the parcellation in (Desikan et al.,
2006) (Table S2). The color indicates the lobe
(white=frontal, gray=occipital, black=temporal). Error bars indicate SEM. The
dashed horizontal line shows chance classification performance (0.5) and the
dotted line shows the classification performance threshold (see Figure S5).