TopInvariance to novel objects
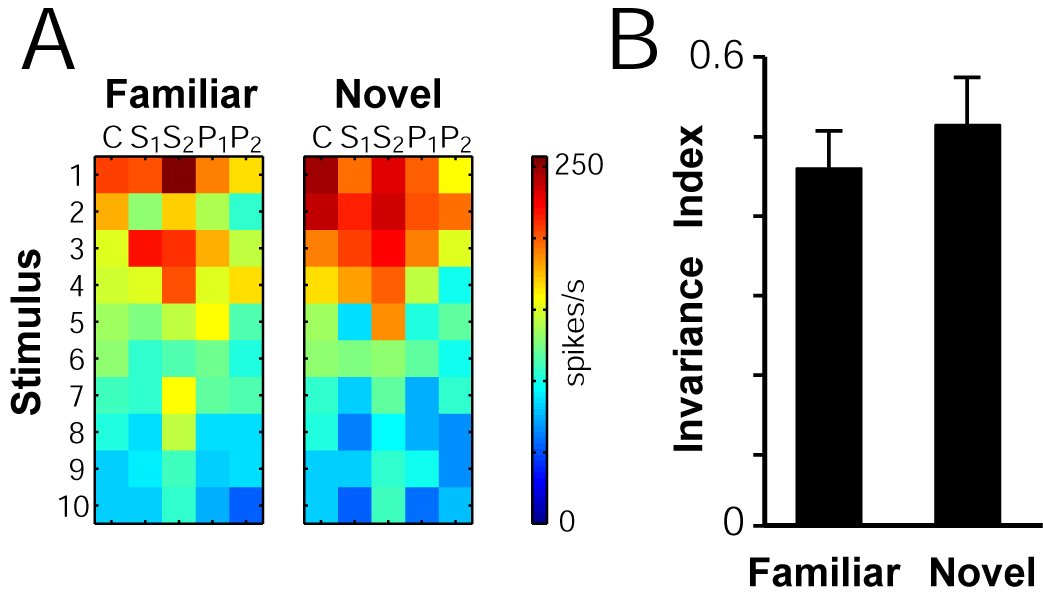
(A) Example of a site’s response to 10 familiar (left) and novel (right) objects at the 5 different scales and positions (C = center of gaze, 3,4o size; S1=center of gaze, 1.7o size; S2 = center of gaze, 6.8o size; P1 = 2o shift, 3.4o size; P2 = 4o shift, 3.4o size. The response of the unit (spike count in the 100 to 200 ms interval) is color-coded (axis next to response plot in spikes/s).
(B) Summary showing the degree of invariance for novel objects versus familiar objects. The invariance index was calculated by averaging the Spearman correlation coefficient for the top 10 objects across all possible condition pairs (1 indicates complete invariance and 0 indicates no invariance). Results are based on 13/19 sites selective among the 10 novel stimuli (ANOVA, p<0.05). Error bars show SEM (n=13).