TopTowards the Neural Code for object class, scale and location
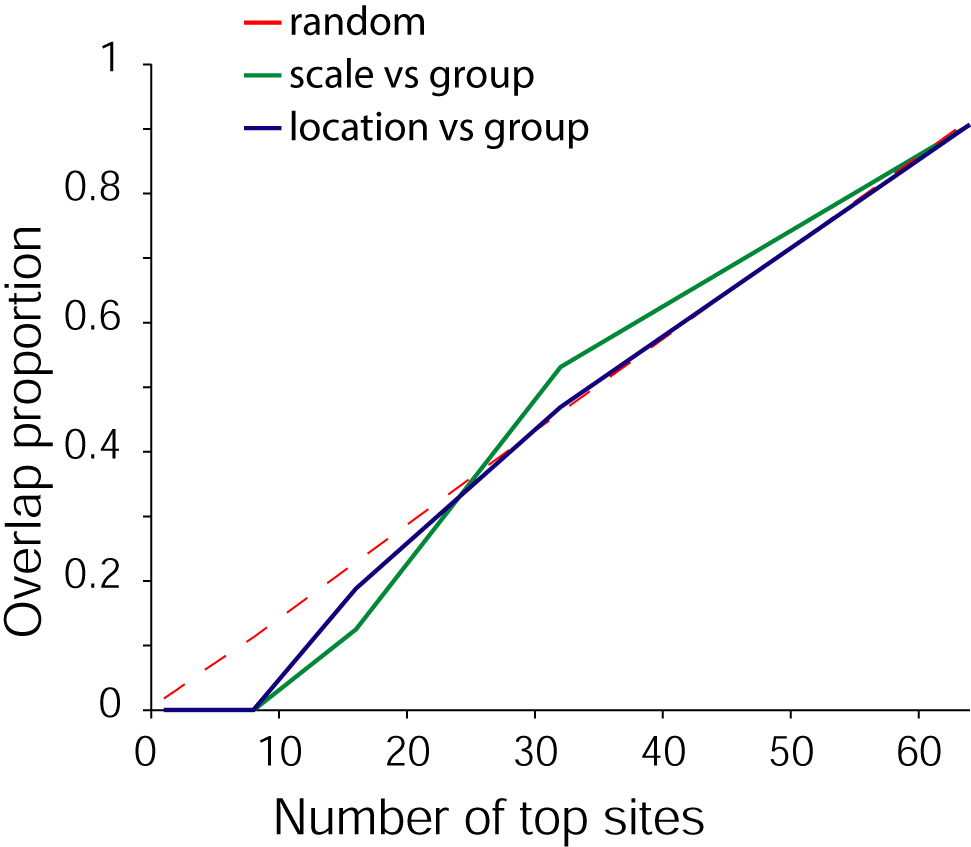
A. We ranked all sites by the signal to noise ratio (SNR) for each group/scale/location. For a given site and a given group, the SNR was defined as the difference between the mean response to that group and the mean response to other groups divided by the sum of the standard deviations of the group and non-group responses. This yielded a list of the "top" sites for each read-out task. The plot below shows the overlap between those top sites for the different read-out tasks. The total number of sites here was 70. We selected the top n sites for each task (n=1,2,...,256) and the y axis shows the overlap proportion between the top n sites for group read-out and scale read-out (green), group read-out and location read-out (blue), scale read-out and location read-out (yellow) or randomly choosing n out of 70 sites (red).
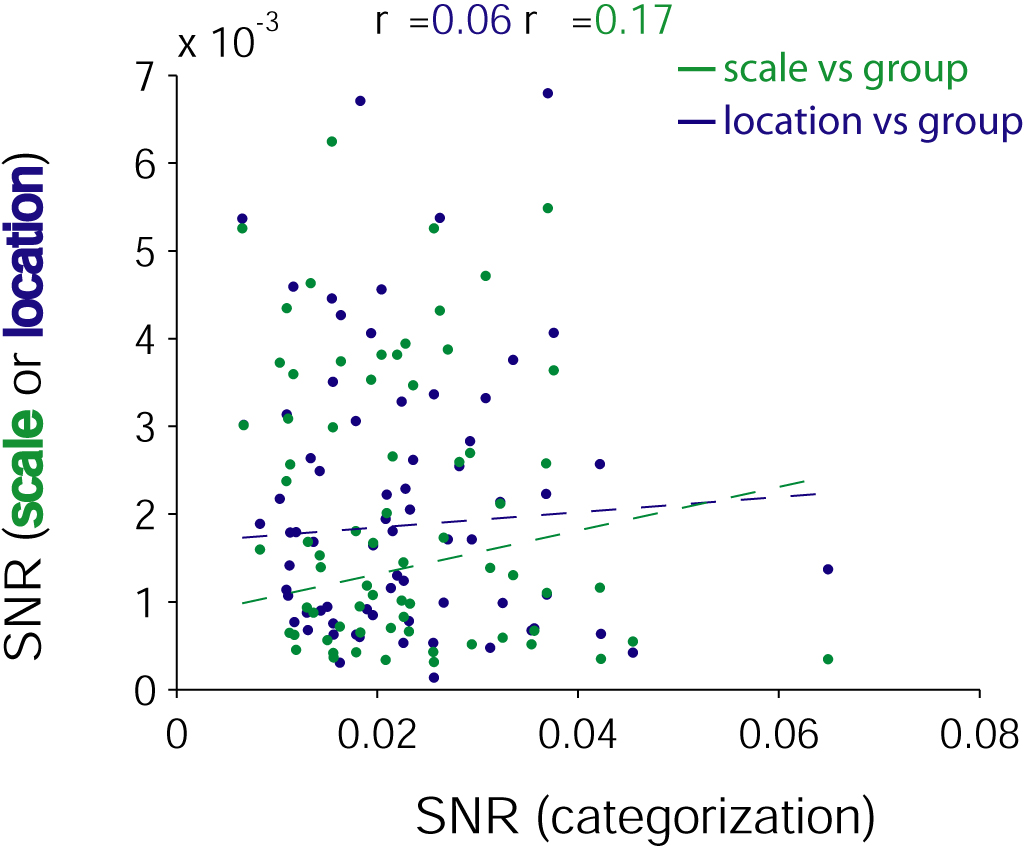
B. To explore the neural code underlying different types of information (identity, location, scale) expressed by the same population of neurons we used a standard variable selection technique (see Methods above). Here we show the SNR for scale read-out (green) or position read-out (blue) as a function of the SNR for categorization for each site. The dashed lines represent a linear fit to the data (r=0.06 for scale, r=0.17 for position). There is a poor correlation between scale read-out and category read-out SNR values and between position read-out and category read-out SNR values. In contrast, there was a stronger correlation between the SNR values for identification and categorization (r=0.54).
Parameters
Signal = MUA, Time interval = [100;300) ms, Bin size = 200 ms, Total number of sites = 70, Top sites defined by SNR:
SNR_i = <response_i>-<response_noti>/(s(response_i)+s(response_noti)) for group i versus the other stimuli (noti)