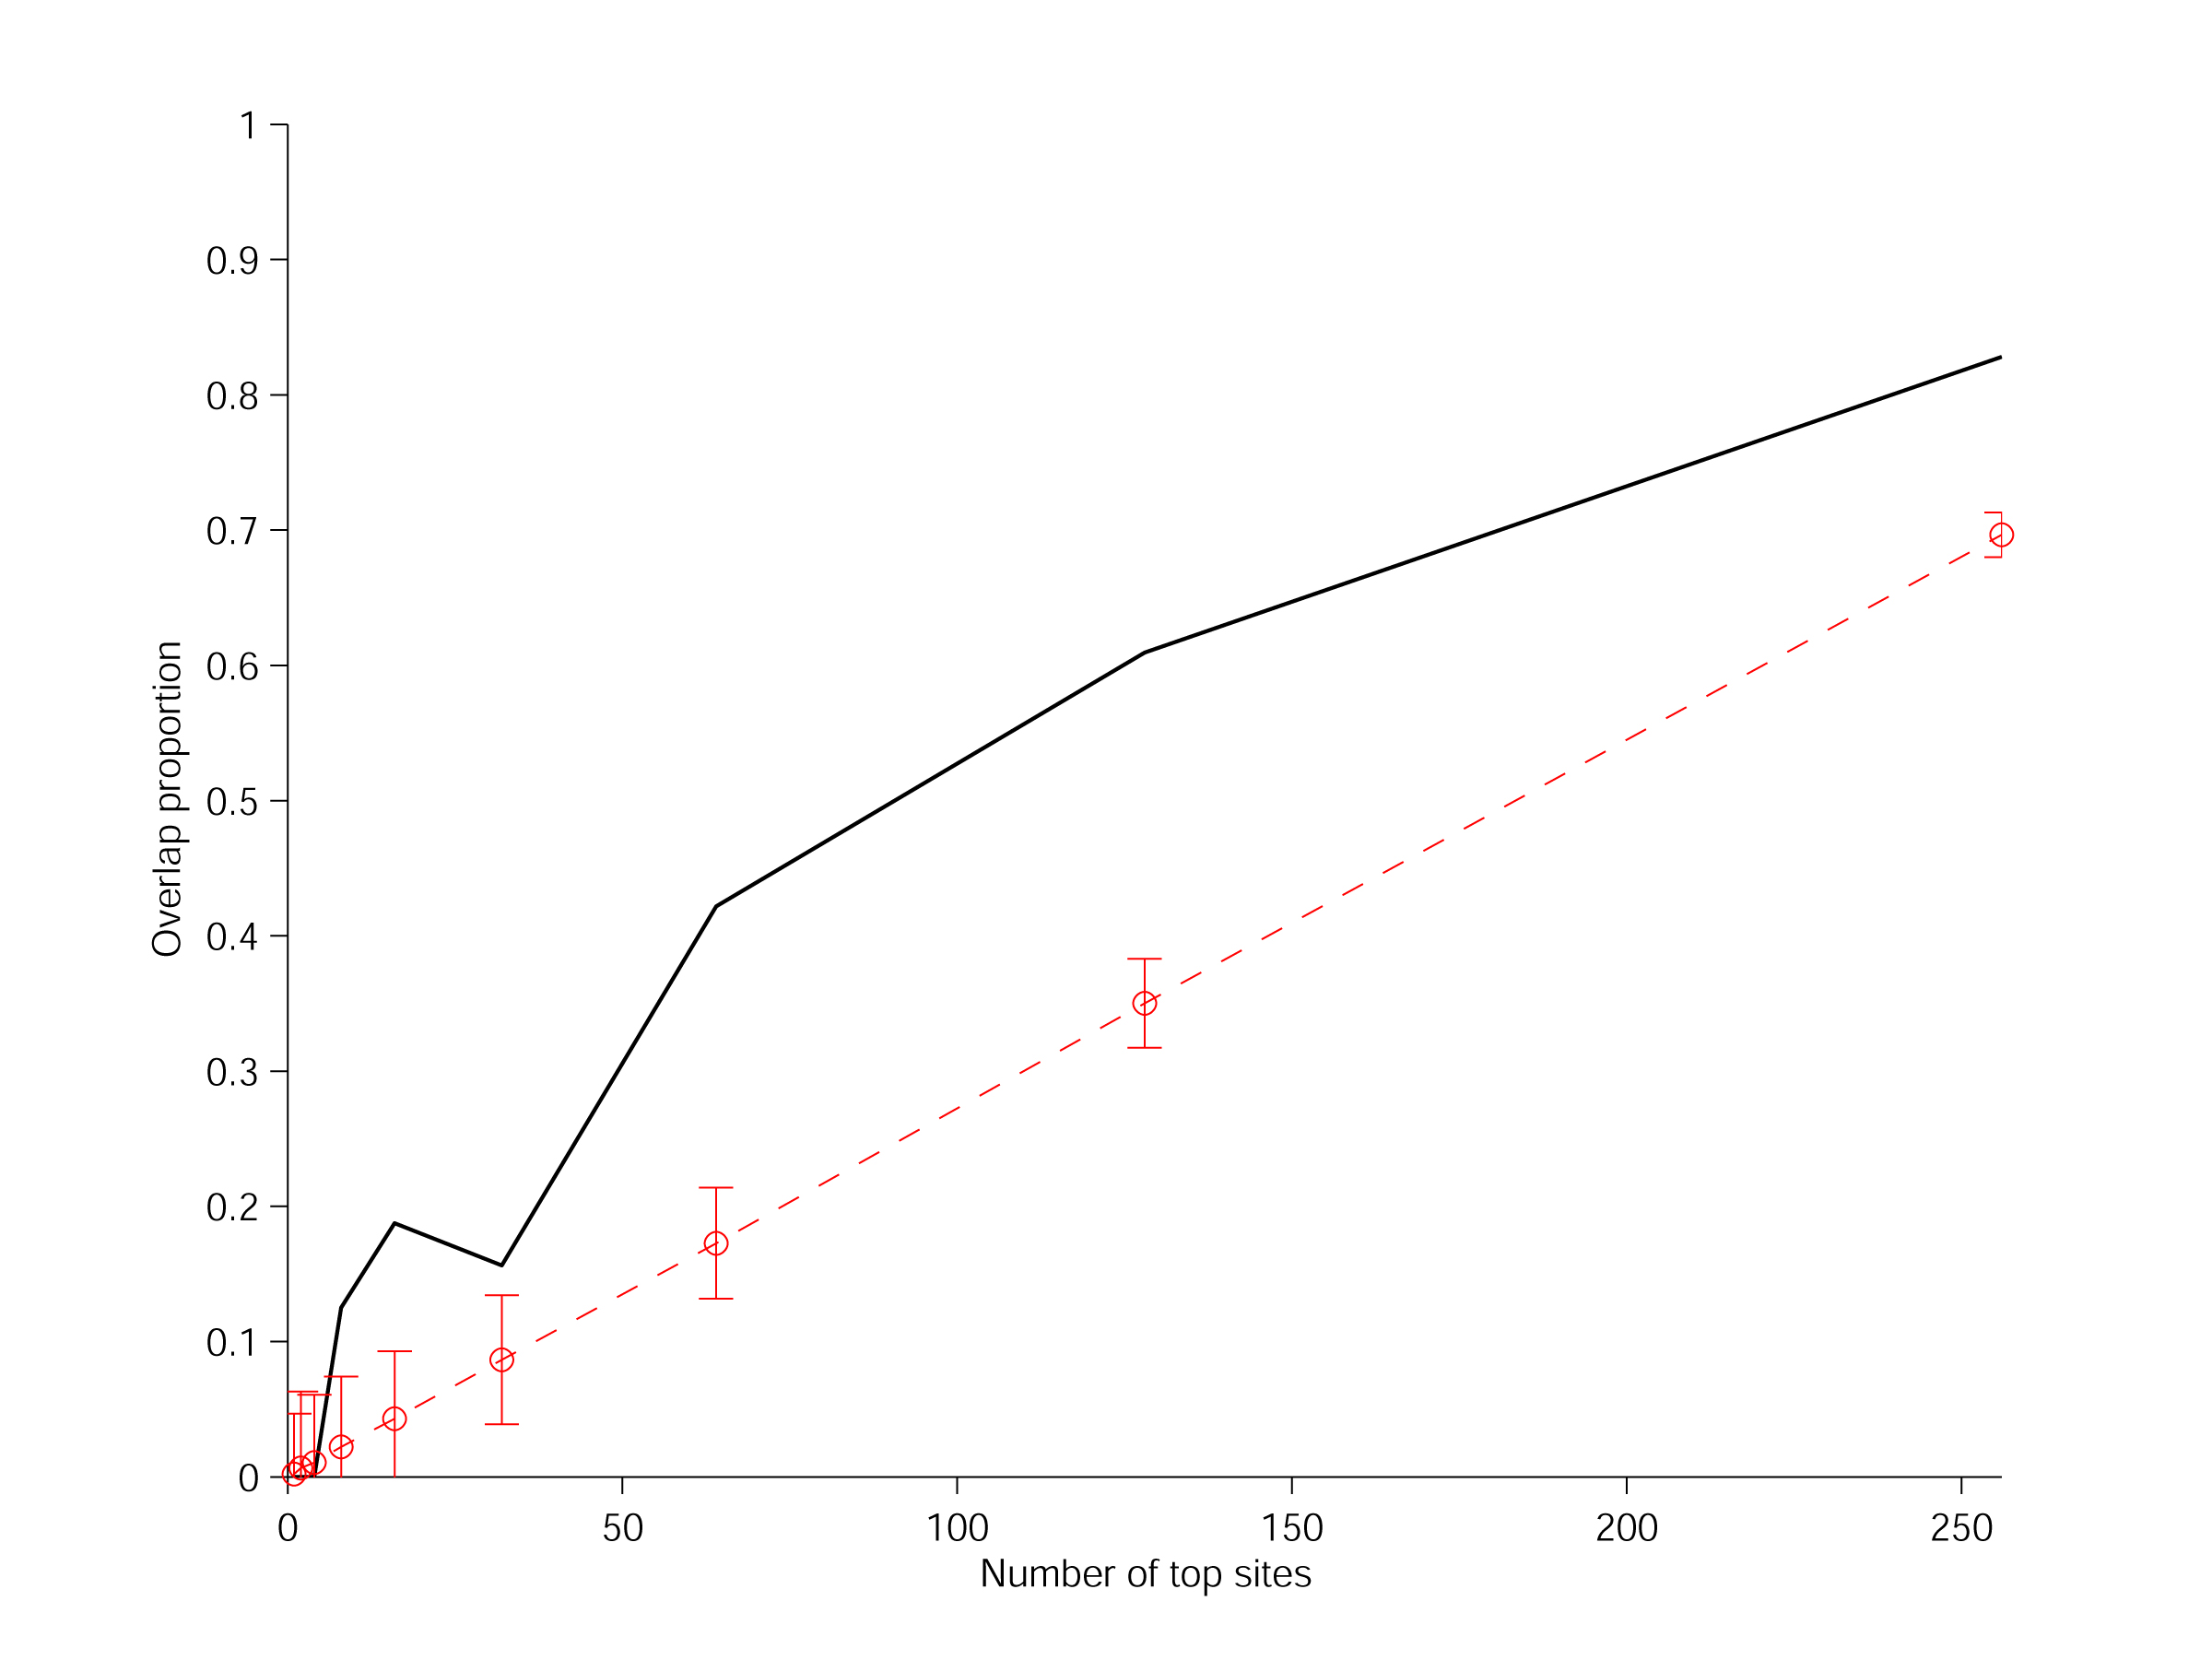
TopThere is a strong overlap between the best neurons for the categorization task and the identification tasks
We ranked all sites by the signal to noise ratio (SNR) for each group or picture. For a given site and a given group, the SNR was defined as the difference between the mean response to that group and the mean response to other groups normalized by the variability in the responses (see below). This yielded a list of the "top" sites for each read-out task (categorization and identification). The plot below shows the overlap between those top sites for categorization and identification. The total number of sites here was 367. We selected the top n sites for each task (n=1,2,...,256) and the y-axis shows the overlap proportion between the top n sites for categorization and identification (black), or randomly choosing n out of 367 sites (red).
Parameters
Signal = MUA, Time interval = [100;300) ms, Bin size = 200 ms, Total number of sites = 367
Top sites were defined by SNR:
where:
sSNRg is the signal-to-noise ratio for site s and group/picture g
<s_r_g> and s_s_g is the mean and standard deviation of the response of site s to group/picture g
<s_r_notg> and s_s_notg is the mean and standard deviation of the response of site s to stimuli not in group/picture g